
|
|||||
|
 | |
| |
| |
| |
| |
| |
|
Gene: MT1M |
Gene summary for MT1M |
| Gene information | Species | Human | Gene symbol | MT1M | Gene ID | 4499 |
| Gene name | metallothionein 1M | |
| Gene Alias | MT-1M | |
| Cytomap | 16q13 | |
| Gene Type | protein-coding | GO ID | GO:0006873 | UniProtAcc | A0A024R6T4 |
Top |
Malignant transformation analysis |
| Identification of the aberrant gene expression in precancerous and cancerous lesions by comparing the gene expression of stem-like cells in diseased tissues with normal stem cells |
| Entrez ID | Symbol | Replicates | Species | Organ | Tissue | Adj P-value | Log2FC | Malignancy |
| 4499 | MT1M | HTA11_2487_2000001011 | Human | Colorectum | SER | 6.94e-08 | 7.05e-01 | -0.1808 |
| 4499 | MT1M | HTA11_347_2000001011 | Human | Colorectum | AD | 7.48e-13 | 5.19e-01 | -0.1954 |
| 4499 | MT1M | HTA11_411_2000001011 | Human | Colorectum | SER | 2.83e-02 | 7.83e-01 | -0.2602 |
| 4499 | MT1M | HTA11_3361_2000001011 | Human | Colorectum | AD | 1.19e-02 | 2.81e-01 | -0.1207 |
| 4499 | MT1M | HTA11_866_2000001011 | Human | Colorectum | AD | 3.99e-18 | 6.02e-01 | -0.1001 |
| 4499 | MT1M | HTA11_2992_2000001011 | Human | Colorectum | SER | 6.06e-13 | 1.17e+00 | -0.1706 |
| 4499 | MT1M | HTA11_5212_2000001011 | Human | Colorectum | AD | 2.10e-22 | 1.65e+00 | -0.2061 |
| 4499 | MT1M | HTA11_5216_2000001011 | Human | Colorectum | SER | 2.87e-08 | 9.47e-01 | -0.1462 |
| 4499 | MT1M | HTA11_6801_2000001011 | Human | Colorectum | SER | 4.28e-03 | 6.28e-01 | 0.0171 |
| 4499 | MT1M | HTA11_7469_2000001011 | Human | Colorectum | AD | 2.62e-12 | 1.09e+00 | -0.0124 |
| 4499 | MT1M | LZE8T | Human | Esophagus | ESCC | 1.56e-04 | 2.46e-01 | 0.067 |
| 4499 | MT1M | P4T-E | Human | Esophagus | ESCC | 4.31e-07 | 9.77e-01 | 0.1323 |
| 4499 | MT1M | P8T-E | Human | Esophagus | ESCC | 7.09e-10 | 2.66e-01 | 0.0889 |
| 4499 | MT1M | P11T-E | Human | Esophagus | ESCC | 3.82e-02 | 1.23e+00 | 0.1426 |
| 4499 | MT1M | P12T-E | Human | Esophagus | ESCC | 2.89e-19 | 7.16e-01 | 0.1122 |
| 4499 | MT1M | P16T-E | Human | Esophagus | ESCC | 4.82e-25 | 6.31e-01 | 0.1153 |
| 4499 | MT1M | P20T-E | Human | Esophagus | ESCC | 7.63e-21 | 7.89e-01 | 0.1124 |
| 4499 | MT1M | P21T-E | Human | Esophagus | ESCC | 2.07e-66 | 1.84e+00 | 0.1617 |
| 4499 | MT1M | P24T-E | Human | Esophagus | ESCC | 9.58e-29 | 1.20e+00 | 0.1287 |
| 4499 | MT1M | P27T-E | Human | Esophagus | ESCC | 1.28e-11 | 2.49e-01 | 0.1055 |
| Page: 1 2 3 4 |
| Tissue | Expression Dynamics | Abbreviation |
| Colorectum (GSE201348) |  | FAP: Familial adenomatous polyposis |
| CRC: Colorectal cancer | ||
| Colorectum (HTA11) |  | AD: Adenomas |
| SER: Sessile serrated lesions | ||
| MSI-H: Microsatellite-high colorectal cancer | ||
| MSS: Microsatellite stable colorectal cancer | ||
| Esophagus | 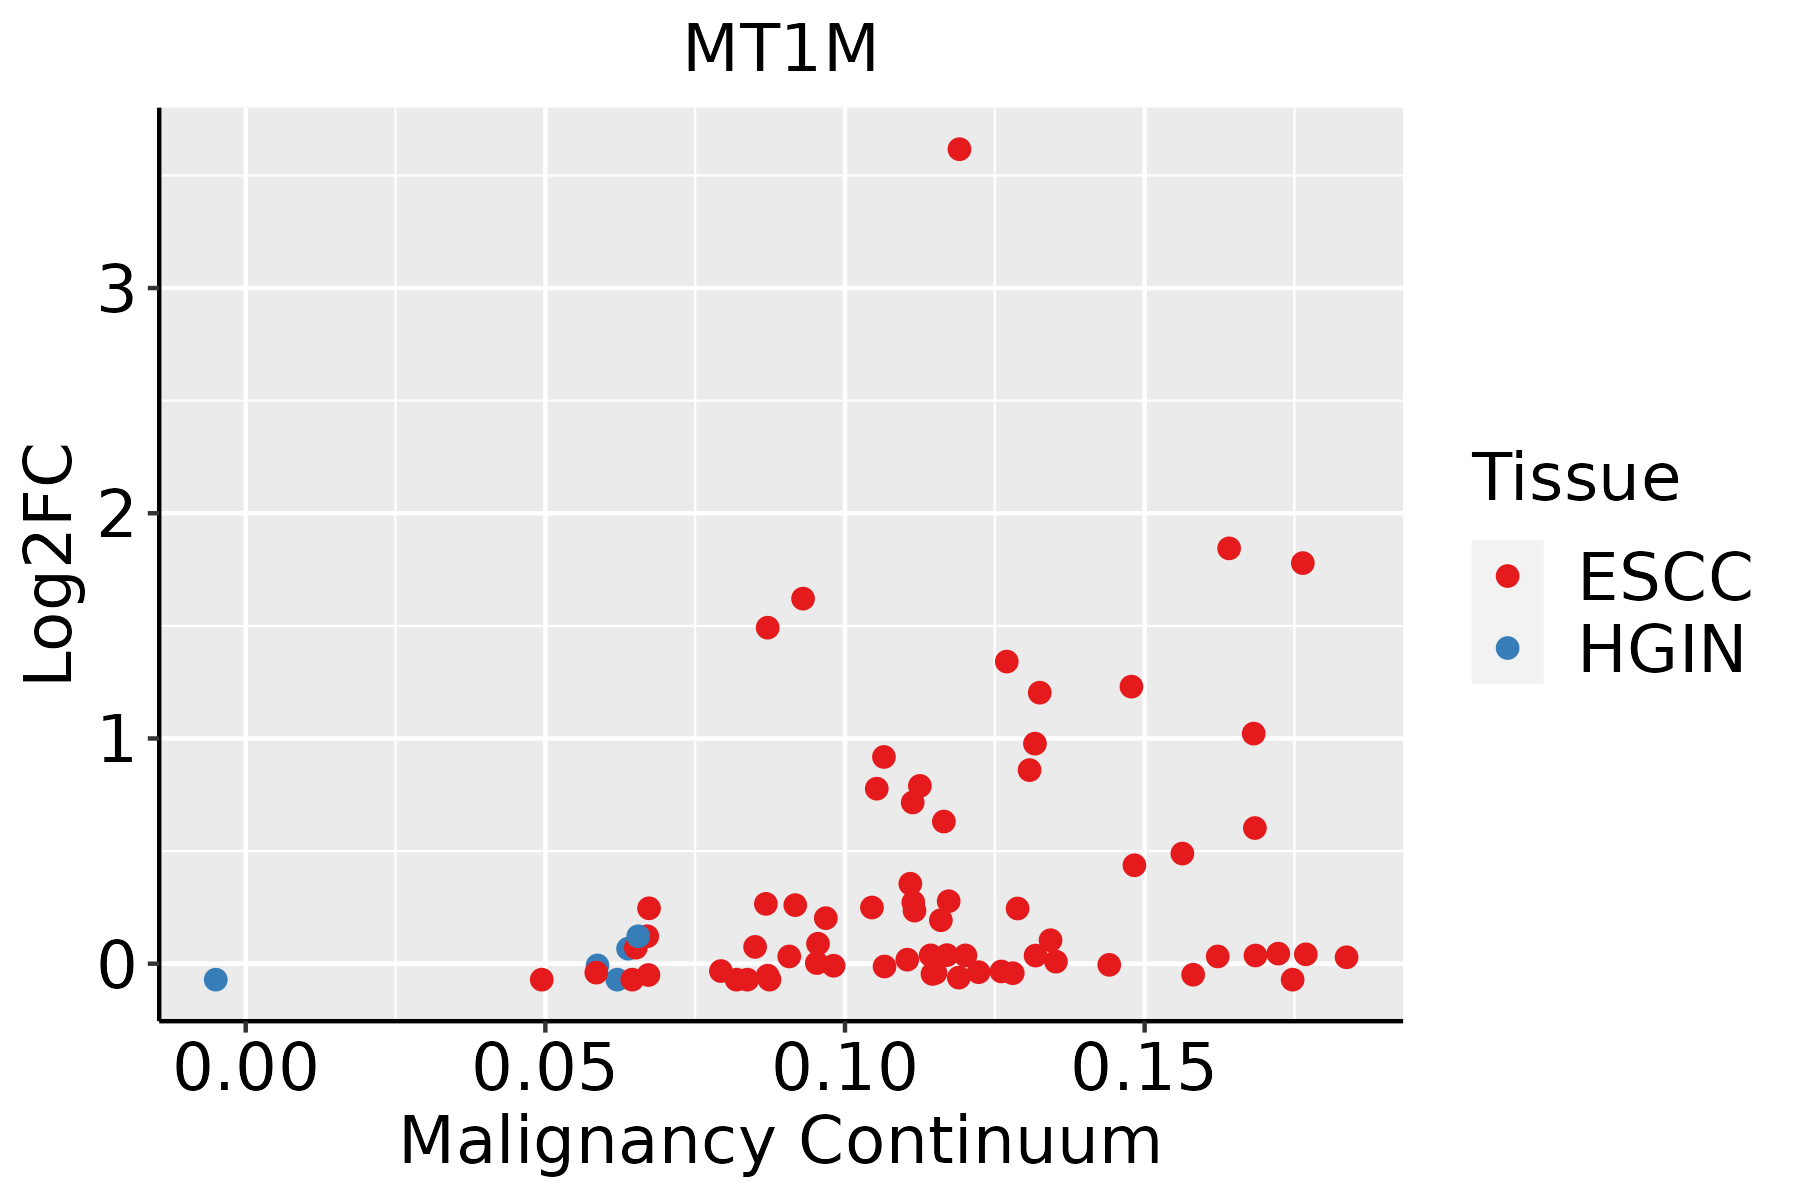 | ESCC: Esophageal squamous cell carcinoma |
| HGIN: High-grade intraepithelial neoplasias | ||
| LGIN: Low-grade intraepithelial neoplasias | ||
| Oral Cavity | 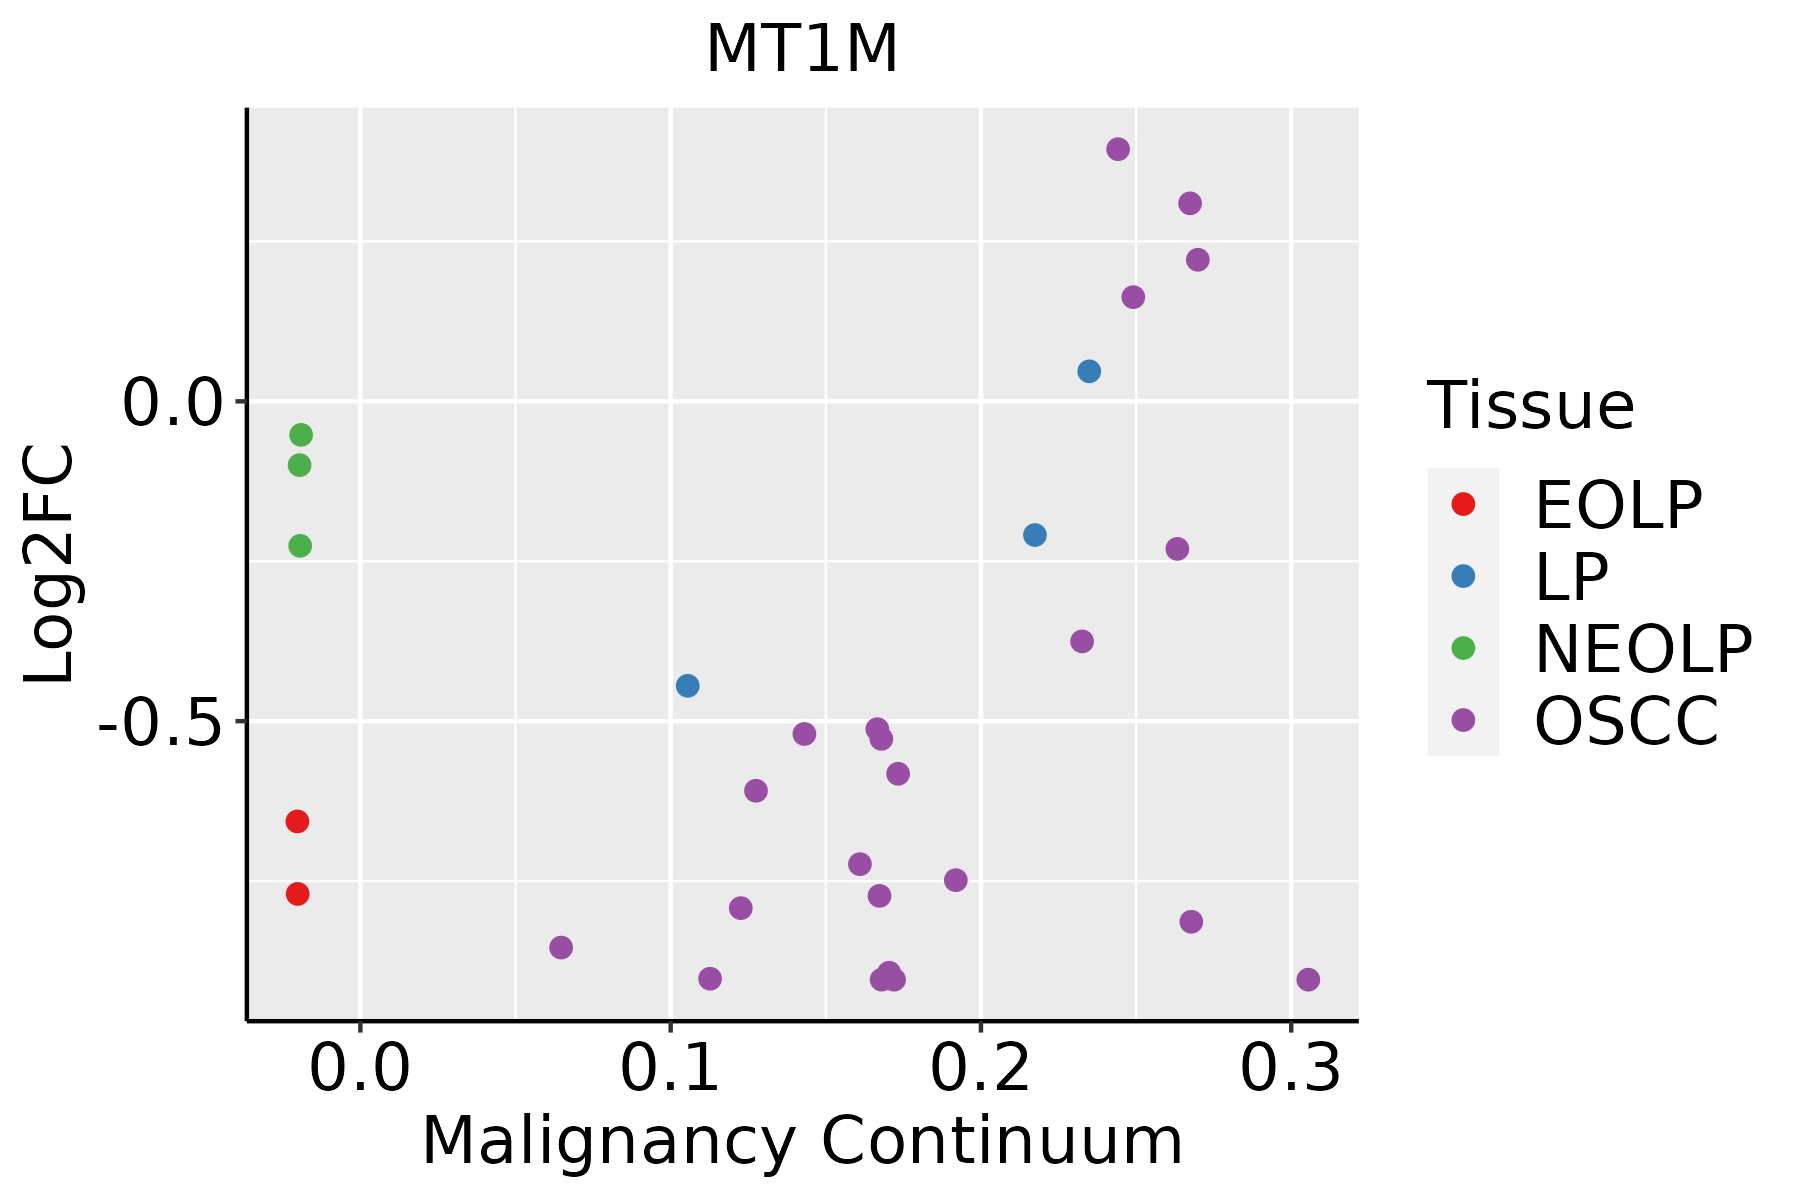 | EOLP: Erosive Oral lichen planus |
| LP: leukoplakia | ||
| NEOLP: Non-erosive oral lichen planus | ||
| OSCC: Oral squamous cell carcinoma | ||
| Prostate | 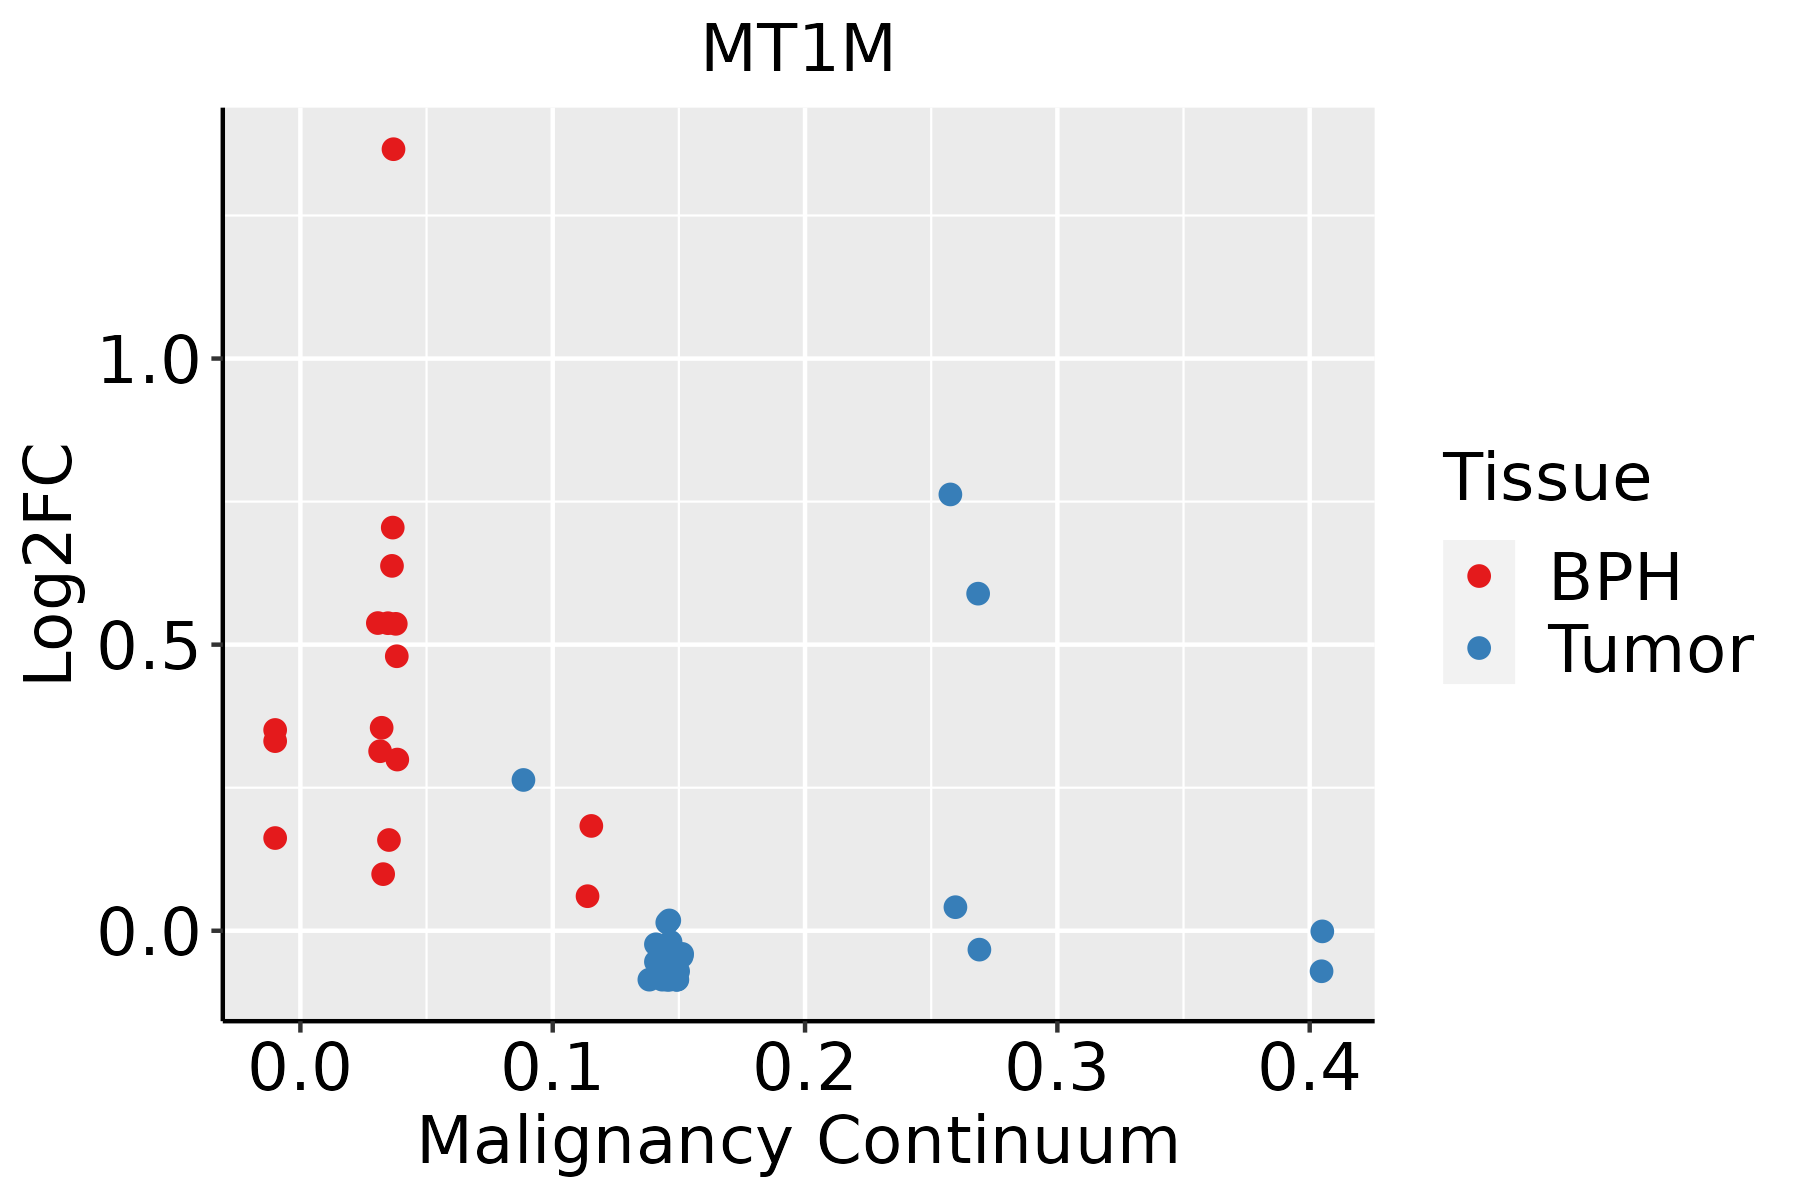 | BPH: Benign Prostatic Hyperplasia |
| Skin | 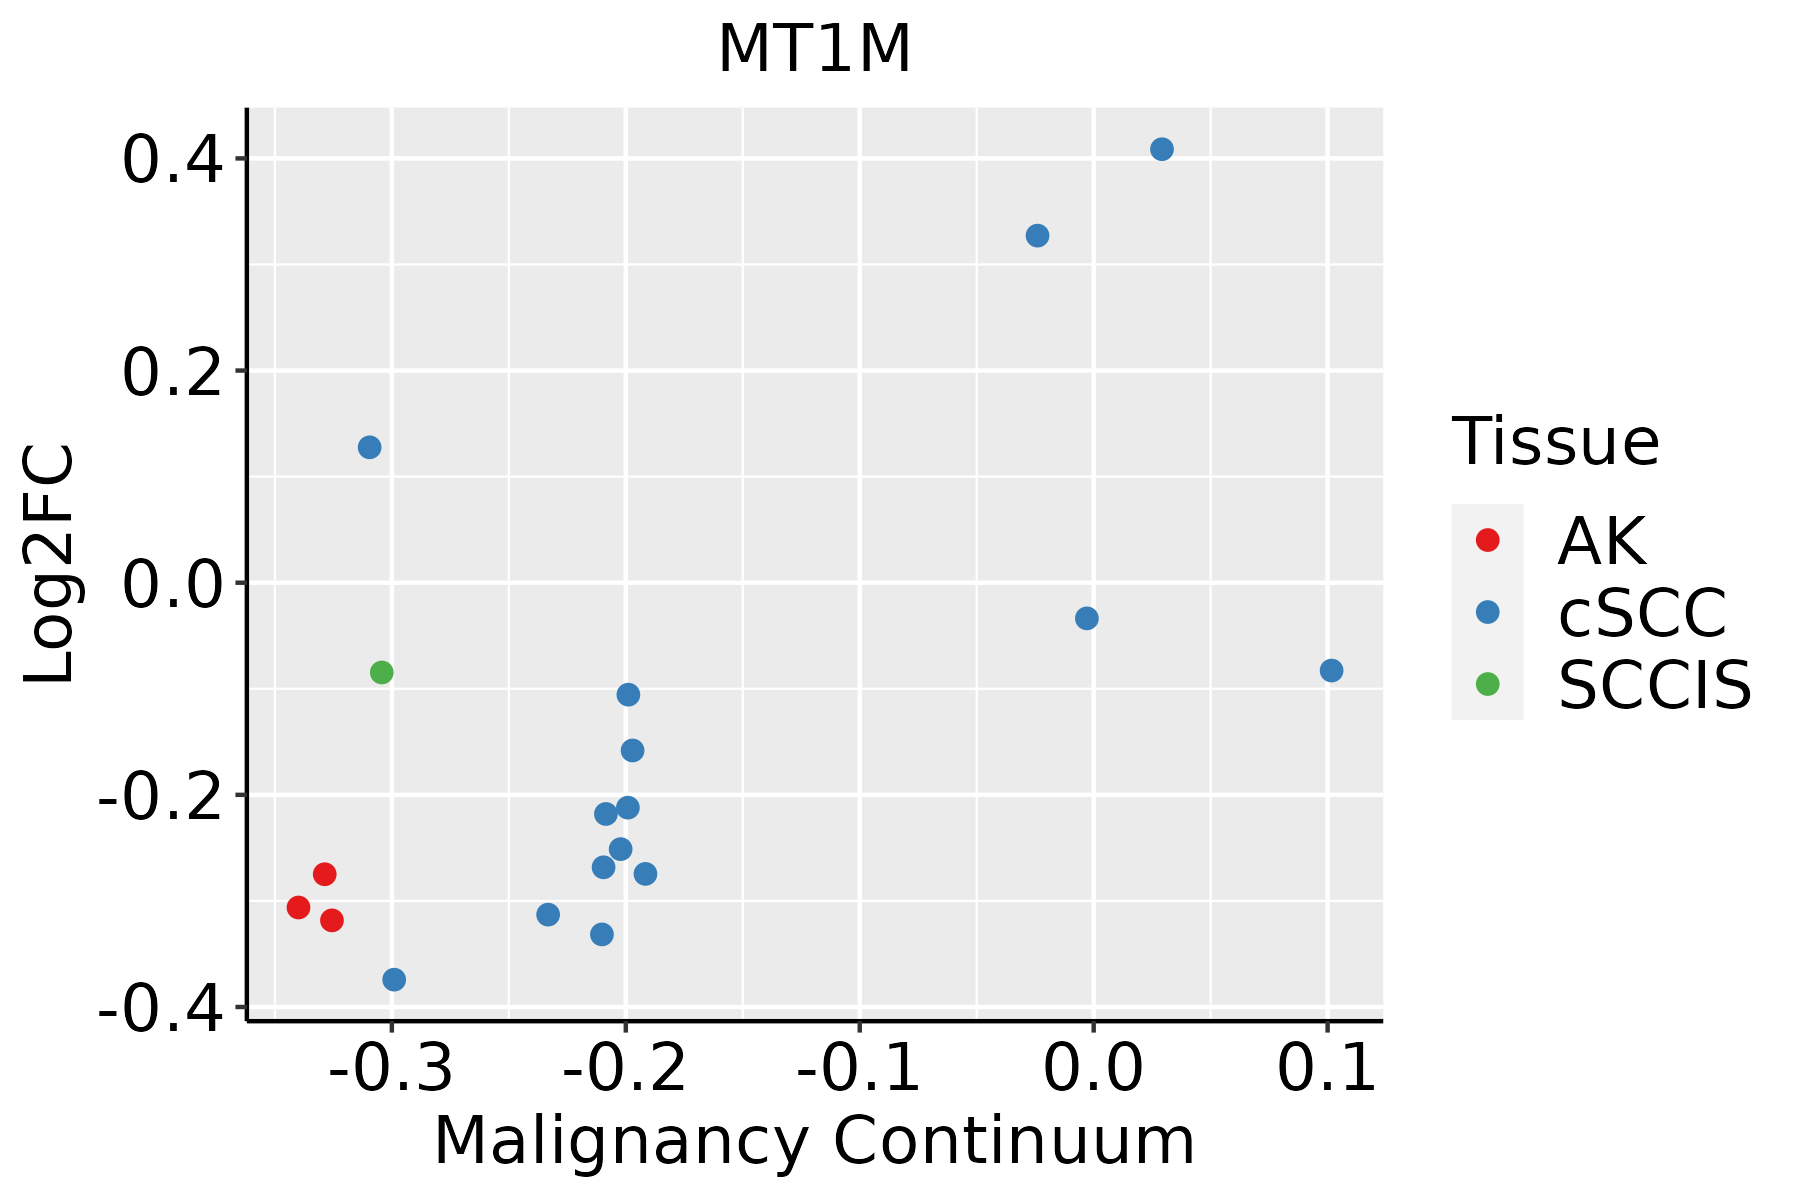 | AK: Actinic keratosis |
| cSCC: Cutaneous squamous cell carcinoma | ||
| SCCIS:squamous cell carcinoma in situ | ||
| Thyroid | 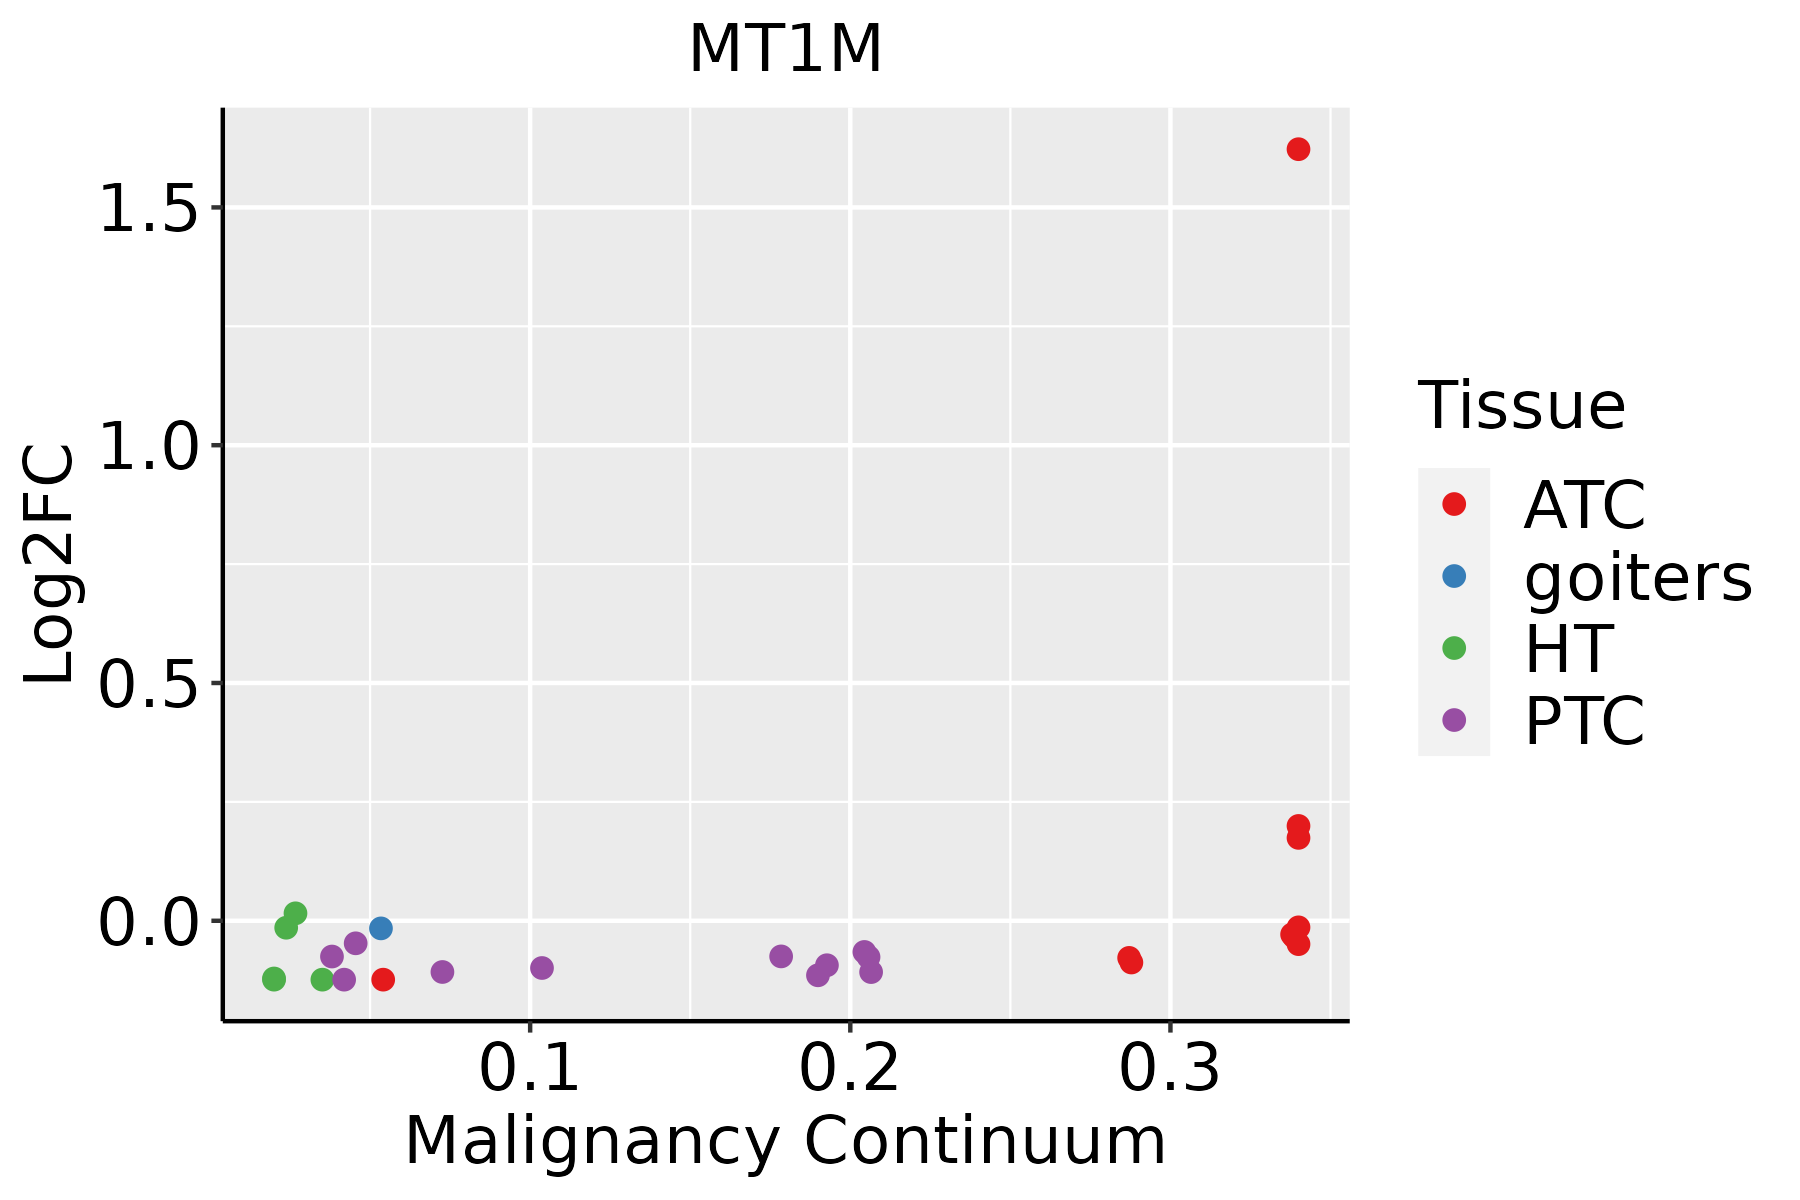 | ATC: Anaplastic thyroid cancer |
| HT: Hashimoto's thyroiditis | ||
| PTC: Papillary thyroid cancer |
| ∗log2FC in expression of this searched gene in stem-like cells from each diseased tissue sample relative to stem-like cells in normal samples in each tissue plotted against the malignancy continuum. Samples are colored based on if they are from different disease stage. |
Top |
Malignant transformation related pathway analysis |
| Find out the enriched GO biological processes and KEGG pathways involved in transition from healthy to precancer to cancer |
| Tissue | Disease Stage | Enriched GO biological Processes |
| Colorectum | AD |  |
| Colorectum | SER |  |
| Colorectum | MSS |  |
| Colorectum | MSI-H |  |
| Colorectum | FAP |  |
| ∗Top 15 enriched GO BP terms are showed in the bar plot of each disease state in each tissue. Each row represents a significant GO biological process which is colored according to the -log10(p.adjust). |
| Page: 1 2 3 4 5 6 7 8 9 |
| GO ID | Tissue | Disease Stage | Description | Gene Ratio | Bg Ratio | pvalue | p.adjust | Count |
| GO:0009636 | Colorectum | AD | response to toxic substance | 88/3918 | 262/18723 | 1.12e-06 | 3.72e-05 | 88 |
| GO:0055076 | Colorectum | AD | transition metal ion homeostasis | 53/3918 | 138/18723 | 1.89e-06 | 5.65e-05 | 53 |
| GO:0046916 | Colorectum | AD | cellular transition metal ion homeostasis | 43/3918 | 115/18723 | 3.62e-05 | 6.56e-04 | 43 |
| GO:0098754 | Colorectum | AD | detoxification | 53/3918 | 152/18723 | 4.63e-05 | 7.98e-04 | 53 |
| GO:0046686 | Colorectum | AD | response to cadmium ion | 27/3918 | 68/18723 | 3.19e-04 | 3.80e-03 | 27 |
| GO:0010038 | Colorectum | AD | response to metal ion | 106/3918 | 373/18723 | 3.22e-04 | 3.83e-03 | 106 |
| GO:0055069 | Colorectum | AD | zinc ion homeostasis | 18/3918 | 40/18723 | 5.36e-04 | 5.74e-03 | 18 |
| GO:0071276 | Colorectum | AD | cellular response to cadmium ion | 18/3918 | 40/18723 | 5.36e-04 | 5.74e-03 | 18 |
| GO:0071248 | Colorectum | AD | cellular response to metal ion | 61/3918 | 197/18723 | 5.74e-04 | 6.09e-03 | 61 |
| GO:0071241 | Colorectum | AD | cellular response to inorganic substance | 68/3918 | 226/18723 | 6.98e-04 | 7.10e-03 | 68 |
| GO:0006882 | Colorectum | AD | cellular zinc ion homeostasis | 17/3918 | 38/18723 | 8.26e-04 | 8.13e-03 | 17 |
| GO:0097501 | Colorectum | AD | stress response to metal ion | 10/3918 | 19/18723 | 2.25e-03 | 1.77e-02 | 10 |
| GO:0045926 | Colorectum | AD | negative regulation of growth | 70/3918 | 249/18723 | 4.07e-03 | 2.83e-02 | 70 |
| GO:0071294 | Colorectum | AD | cellular response to zinc ion | 11/3918 | 24/18723 | 5.43e-03 | 3.55e-02 | 11 |
| GO:0010273 | Colorectum | AD | detoxification of copper ion | 8/3918 | 15/18723 | 5.67e-03 | 3.64e-02 | 8 |
| GO:1990169 | Colorectum | AD | stress response to copper ion | 8/3918 | 15/18723 | 5.67e-03 | 3.64e-02 | 8 |
| GO:0071280 | Colorectum | AD | cellular response to copper ion | 12/3918 | 28/18723 | 7.21e-03 | 4.39e-02 | 12 |
| GO:0046688 | Colorectum | AD | response to copper ion | 16/3918 | 42/18723 | 8.10e-03 | 4.76e-02 | 16 |
| GO:00096361 | Colorectum | SER | response to toxic substance | 71/2897 | 262/18723 | 8.63e-07 | 4.07e-05 | 71 |
| GO:00987541 | Colorectum | SER | detoxification | 46/2897 | 152/18723 | 3.02e-06 | 1.20e-04 | 46 |
| Page: 1 2 3 4 5 6 7 |
| Pathway ID | Tissue | Disease Stage | Description | Gene Ratio | Bg Ratio | pvalue | p.adjust | qvalue | Count |
| hsa0497814 | Prostate | BPH | Mineral absorption | 20/1718 | 60/8465 | 1.22e-02 | 3.61e-02 | 2.23e-02 | 20 |
| hsa0497815 | Prostate | BPH | Mineral absorption | 20/1718 | 60/8465 | 1.22e-02 | 3.61e-02 | 2.23e-02 | 20 |
| Page: 1 |
Top |
Cell-cell communication analysis |
| Identification of potential cell-cell interactions between two cell types and their ligand-receptor pairs for different disease states |
| Ligand | Receptor | LRpair | Pathway | Tissue | Disease Stage |
| Page: 1 |
Top |
Single-cell gene regulatory network inference analysis |
| Find out the significant the regulons (TFs) and the target genes of each regulon across cell types for different disease states |
| TF | Cell Type | Tissue | Disease Stage | Target Gene | RSS | Regulon Activity |
| ∗The dot plots of a searched regulon are shown for all cell subpopulations in each disease state of each tissue based on the regulon specific score inferred using pySCENIC and by calculating the average expression. |
| Page: 1 |
Top |
Somatic mutation of malignant transformation related genes |
| Annotation of somatic variants for genes involved in malignant transformation |
| Hugo Symbol | Variant Class | Variant Classification | dbSNP RS | HGVSc | HGVSp | HGVSp Short | SWISSPROT | BIOTYPE | SIFT | PolyPhen | Tumor Sample Barcode | Tissue | Histology | Sex | Age | Stage | Therapy Types | Drugs | Outcome |
| MT1M | SNV | Missense_Mutation | c.4N>A | p.Asp2Asn | p.D2N | Q8N339 | protein_coding | deleterious_low_confidence(0.02) | possibly_damaging(0.831) | TCGA-E9-A1ND-01 | Breast | breast invasive carcinoma | Female | >=65 | I/II | Hormone Therapy | aromasin | SD | |
| MT1M | insertion | Nonsense_Mutation | novel | c.83_84insAGACATTTGAGTCTTCAGGGTTCAGCACAGAAGGTT | p.Ser28_Cys29insAspIleTerValPheArgValGlnHisArgArgPhe | p.S28_C29insDI*VFRVQHRRF | Q8N339 | protein_coding | TCGA-A8-A0AD-01 | Breast | breast invasive carcinoma | Female | >=65 | I/II | Hormone Therapy | tamoxiphen | SD | ||
| MT1M | SNV | Missense_Mutation | rs568220625 | c.49N>A | p.Gly17Ser | p.G17S | Q8N339 | protein_coding | tolerated(0.37) | benign(0.009) | TCGA-AA-3949-01 | Colorectum | colon adenocarcinoma | Female | >=65 | III/IV | Unknown | Unknown | SD |
| MT1M | SNV | Missense_Mutation | c.88N>G | p.Lys30Glu | p.K30E | Q8N339 | protein_coding | deleterious(0.01) | benign(0.225) | TCGA-D5-6928-01 | Colorectum | colon adenocarcinoma | Male | >=65 | I/II | Unknown | Unknown | SD | |
| MT1M | SNV | Missense_Mutation | c.80N>A | p.Thr27Asn | p.T27N | Q8N339 | protein_coding | deleterious(0) | possibly_damaging(0.508) | TCGA-DC-4749-01 | Colorectum | rectum adenocarcinoma | Male | <65 | I/II | Unknown | Unknown | SD | |
| MT1M | SNV | Missense_Mutation | novel | c.179N>A | p.Cys60Tyr | p.C60Y | Q8N339 | protein_coding | deleterious_low_confidence(0.02) | probably_damaging(0.998) | TCGA-AX-A2HA-01 | Endometrium | uterine corpus endometrioid carcinoma | Female | <65 | I/II | Unknown | Unknown | SD |
| MT1M | SNV | Missense_Mutation | c.177C>G | p.Cys59Trp | p.C59W | Q8N339 | protein_coding | deleterious_low_confidence(0) | probably_damaging(0.998) | TCGA-BG-A0M4-01 | Endometrium | uterine corpus endometrioid carcinoma | Female | <65 | I/II | Chemotherapy | carboplatin | SD | |
| MT1M | SNV | Missense_Mutation | novel | c.38G>A | p.Cys13Tyr | p.C13Y | Q8N339 | protein_coding | deleterious(0.02) | probably_damaging(0.958) | TCGA-73-A9RS-01 | Lung | lung adenocarcinoma | Male | <65 | I/II | Chemotherapy | carboplatin | PD |
| MT1M | SNV | Missense_Mutation | c.85T>A | p.Cys29Ser | p.C29S | Q8N339 | protein_coding | deleterious(0.01) | probably_damaging(0.995) | TCGA-CD-8531-01 | Stomach | stomach adenocarcinoma | Female | >=65 | III/IV | Chemotherapy | epirubicin | CR |
| Page: 1 |
Top |
Related drugs of malignant transformation related genes |
| Identification of chemicals and drugs interact with genes involved in malignant transfromation |
| (DGIdb 4.0) |
| Entrez ID | Symbol | Category | Interaction Types | Drug Claim Name | Drug Name | PMIDs |
| Page: 1 |

Copyright 2023-Present -The University of Texas Health Science Center at Houston |