
|
|||||
|
 | |
| |
| |
| |
| |
| |
|
Gene: MT1G |
Gene summary for MT1G |
| Gene information | Species | Human | Gene symbol | MT1G | Gene ID | 4495 |
| Gene name | metallothionein 1G | |
| Gene Alias | MT1 | |
| Cytomap | 16q13 | |
| Gene Type | protein-coding | GO ID | GO:0001775 | UniProtAcc | P13640 |
Top |
Malignant transformation analysis |
| Identification of the aberrant gene expression in precancerous and cancerous lesions by comparing the gene expression of stem-like cells in diseased tissues with normal stem cells |
| Entrez ID | Symbol | Replicates | Species | Organ | Tissue | Adj P-value | Log2FC | Malignancy |
| 4495 | MT1G | GSM4909282 | Human | Breast | IDC | 2.37e-14 | 4.67e-01 | -0.0288 |
| 4495 | MT1G | GSM4909286 | Human | Breast | IDC | 2.00e-78 | 1.12e+00 | 0.1081 |
| 4495 | MT1G | GSM4909289 | Human | Breast | IDC | 6.90e-10 | 8.73e-01 | 0.1064 |
| 4495 | MT1G | GSM4909293 | Human | Breast | IDC | 2.27e-18 | 5.04e-01 | 0.1581 |
| 4495 | MT1G | GSM4909294 | Human | Breast | IDC | 3.78e-06 | -1.69e-01 | 0.2022 |
| 4495 | MT1G | GSM4909301 | Human | Breast | IDC | 7.33e-04 | -1.78e-01 | 0.1577 |
| 4495 | MT1G | GSM4909304 | Human | Breast | IDC | 2.45e-34 | 7.87e-01 | 0.1636 |
| 4495 | MT1G | GSM4909306 | Human | Breast | IDC | 1.54e-24 | 6.17e-01 | 0.1564 |
| 4495 | MT1G | GSM4909308 | Human | Breast | IDC | 3.00e-04 | -1.90e-01 | 0.158 |
| 4495 | MT1G | GSM4909309 | Human | Breast | IDC | 4.91e-06 | 3.67e-01 | 0.0483 |
| 4495 | MT1G | GSM4909311 | Human | Breast | IDC | 5.56e-11 | 2.66e-01 | 0.1534 |
| 4495 | MT1G | GSM4909315 | Human | Breast | IDC | 1.72e-05 | -1.84e-01 | 0.21 |
| 4495 | MT1G | GSM4909319 | Human | Breast | IDC | 8.07e-06 | -1.75e-01 | 0.1563 |
| 4495 | MT1G | GSM4909321 | Human | Breast | IDC | 3.78e-06 | -1.90e-01 | 0.1559 |
| 4495 | MT1G | NCCBC5 | Human | Breast | DCIS | 2.20e-05 | 2.77e-01 | 0.2046 |
| 4495 | MT1G | P1 | Human | Breast | IDC | 1.41e-03 | -1.90e-01 | 0.1527 |
| 4495 | MT1G | DCIS2 | Human | Breast | DCIS | 4.22e-09 | -7.81e-02 | 0.0085 |
| 4495 | MT1G | HTA11_3410_2000001011 | Human | Colorectum | AD | 2.19e-03 | 2.51e-01 | 0.0155 |
| 4495 | MT1G | HTA11_2487_2000001011 | Human | Colorectum | SER | 2.90e-34 | 1.89e+00 | -0.1808 |
| 4495 | MT1G | HTA11_2951_2000001011 | Human | Colorectum | AD | 3.54e-06 | 7.94e-01 | 0.0216 |
| Page: 1 2 3 4 5 6 7 8 9 |
| Tissue | Expression Dynamics | Abbreviation |
| Breast | 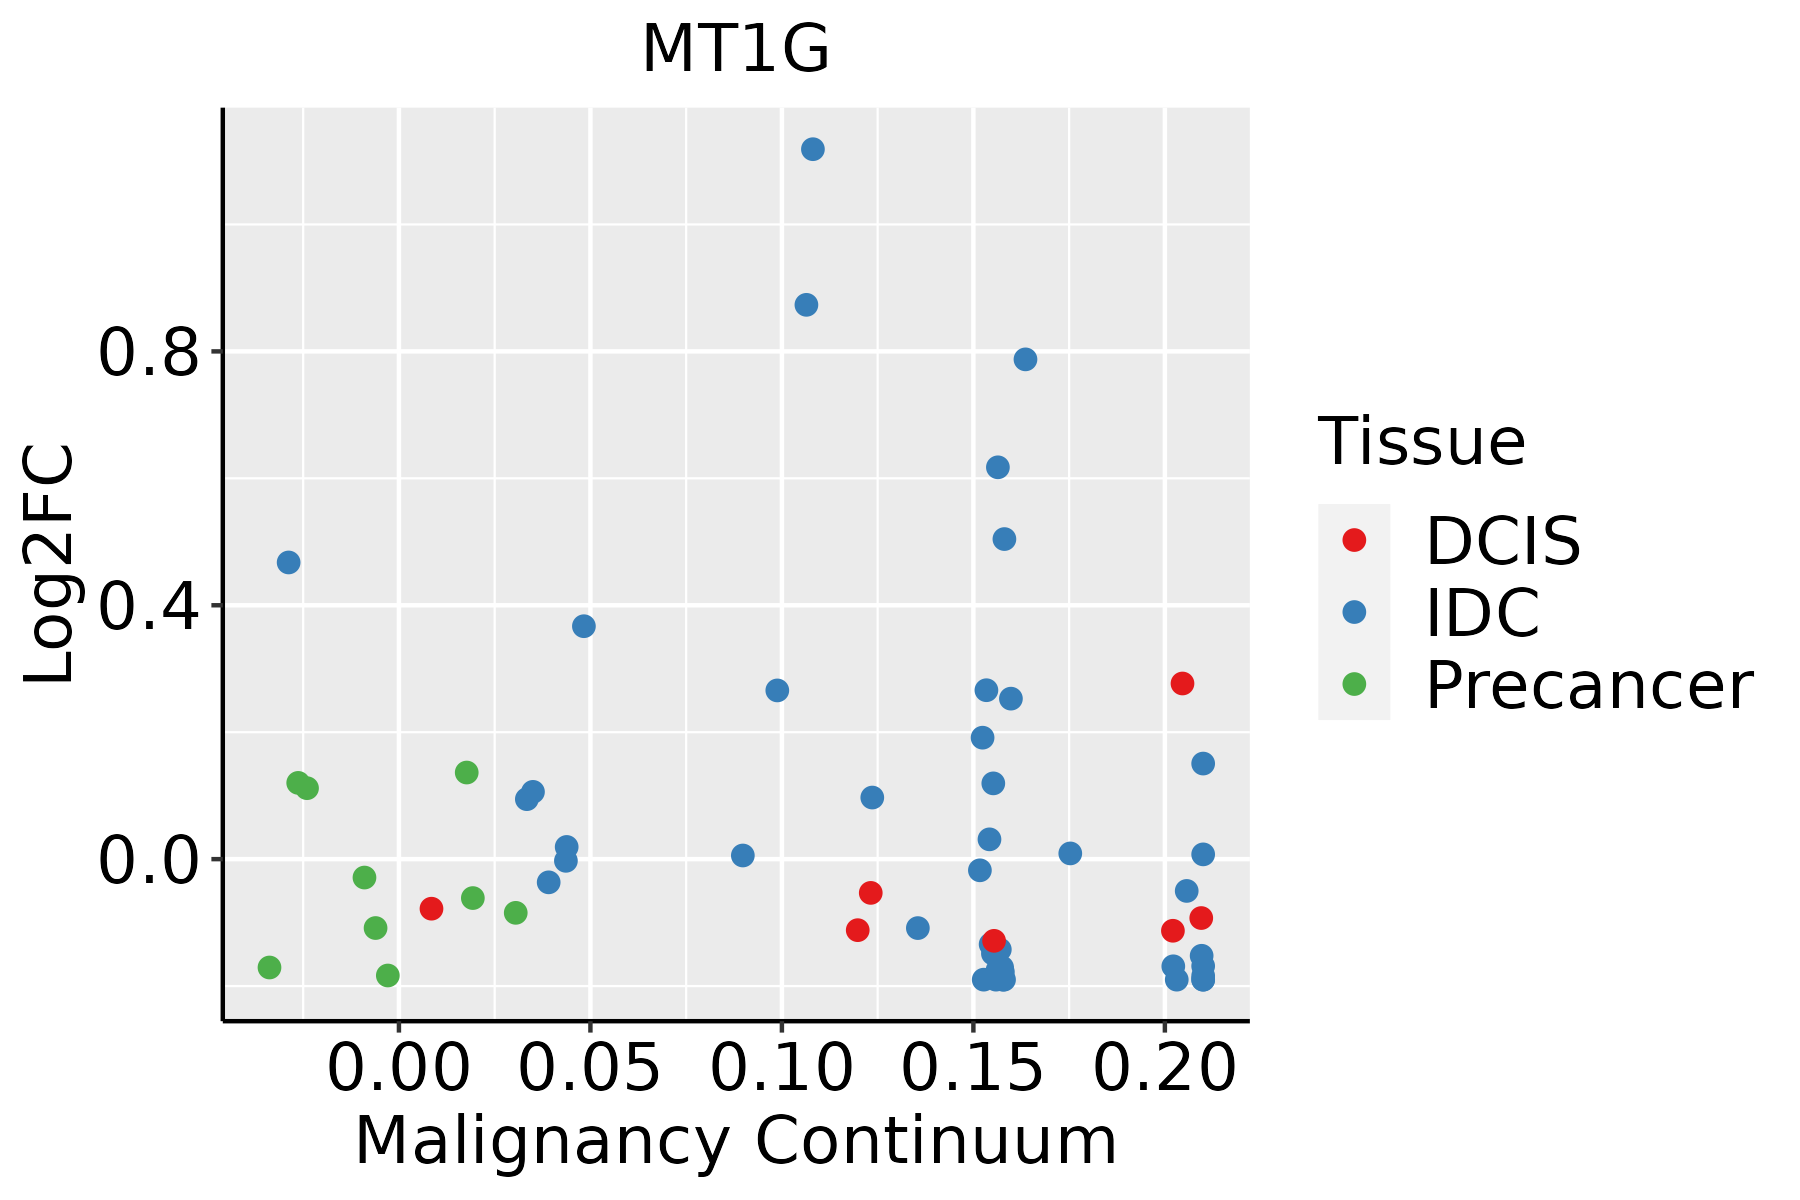 | IDC: Invasive ductal carcinoma |
| DCIS: Ductal carcinoma in situ | ||
| Precancer(BRCA1-mut): Precancerous lesion from BRCA1 mutation carriers | ||
| Colorectum (GSE201348) |  | FAP: Familial adenomatous polyposis |
| CRC: Colorectal cancer | ||
| Colorectum (HTA11) |  | AD: Adenomas |
| SER: Sessile serrated lesions | ||
| MSI-H: Microsatellite-high colorectal cancer | ||
| MSS: Microsatellite stable colorectal cancer | ||
| Esophagus |  | ESCC: Esophageal squamous cell carcinoma |
| HGIN: High-grade intraepithelial neoplasias | ||
| LGIN: Low-grade intraepithelial neoplasias | ||
| GC | 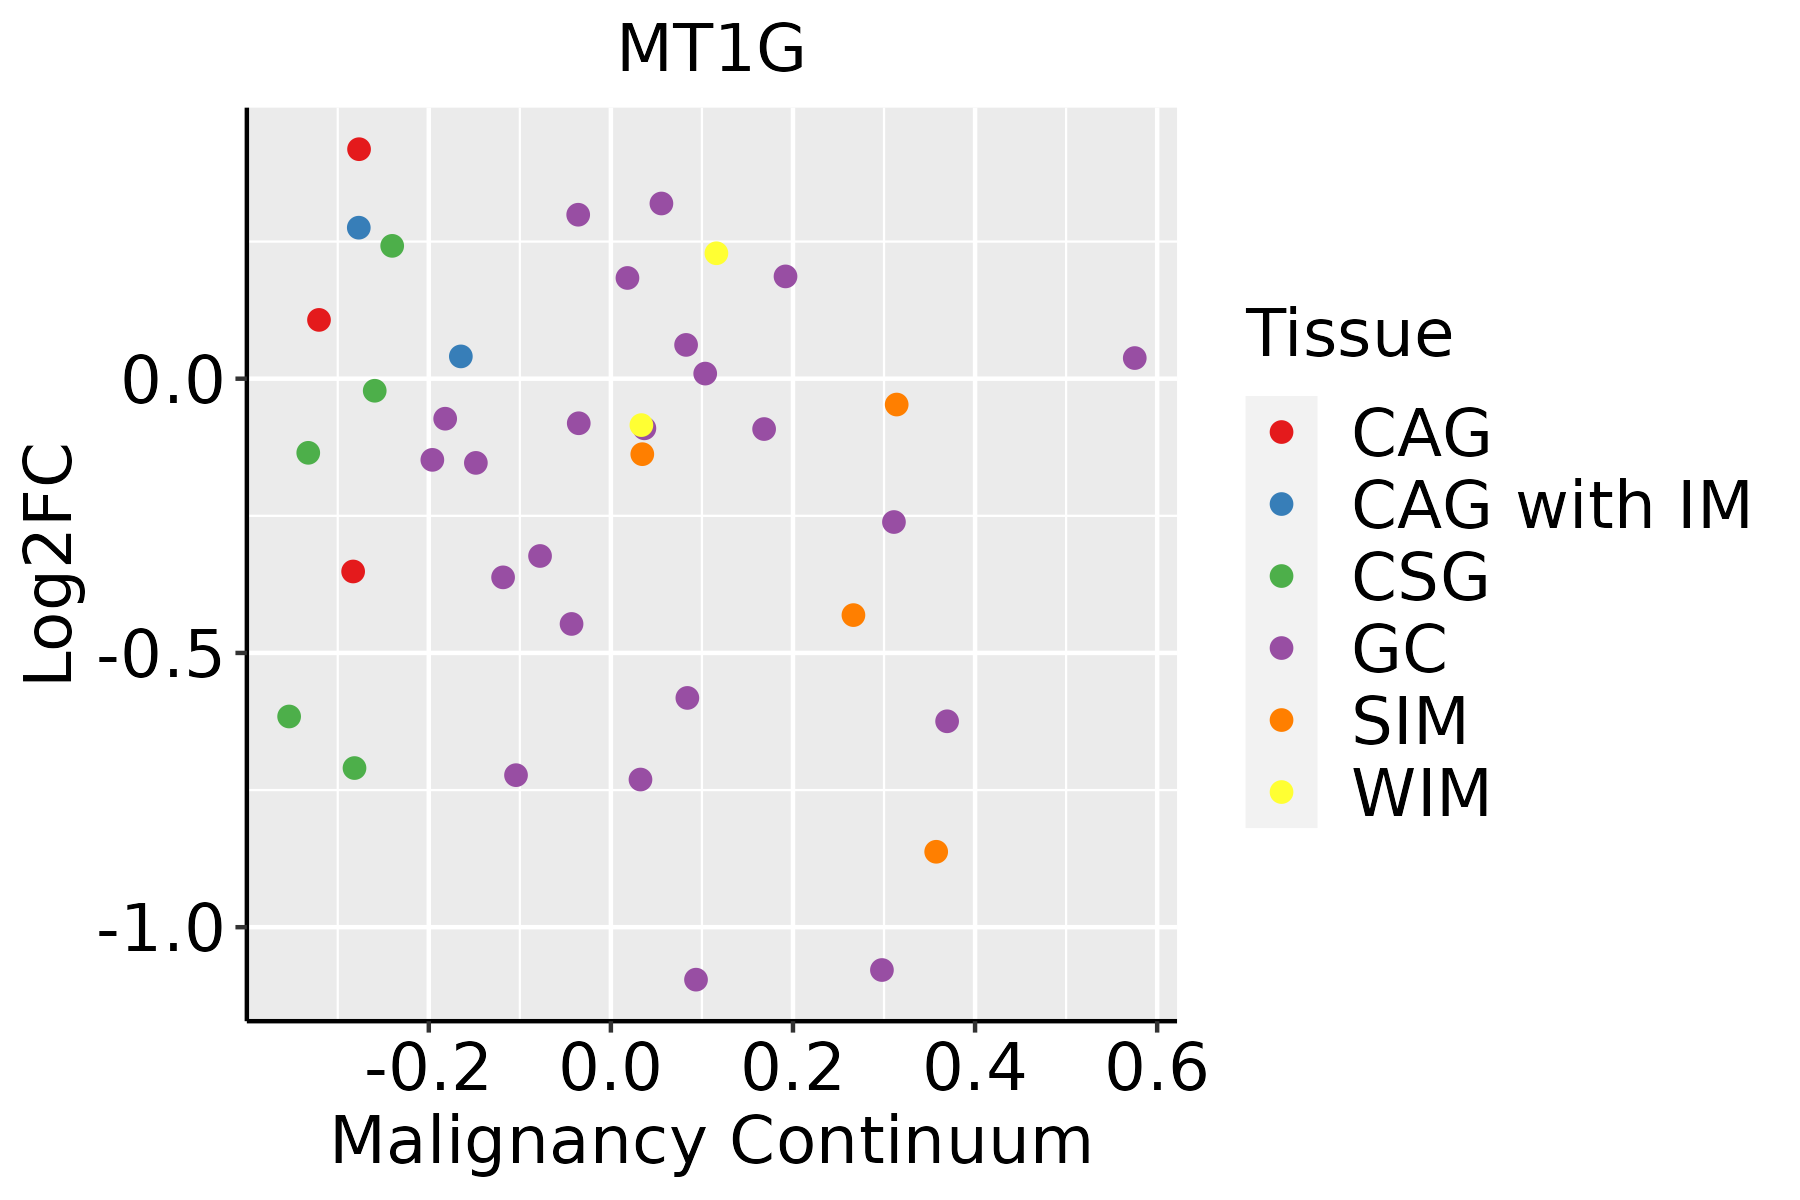 | CAG: Chronic atrophic gastritis |
| CAG with IM: Chronic atrophic gastritis with intestinal metaplasia | ||
| CSG: Chronic superficial gastritis | ||
| GC: Gastric cancer | ||
| SIM: Severe intestinal metaplasia | ||
| WIM: Wild intestinal metaplasia | ||
| Liver | 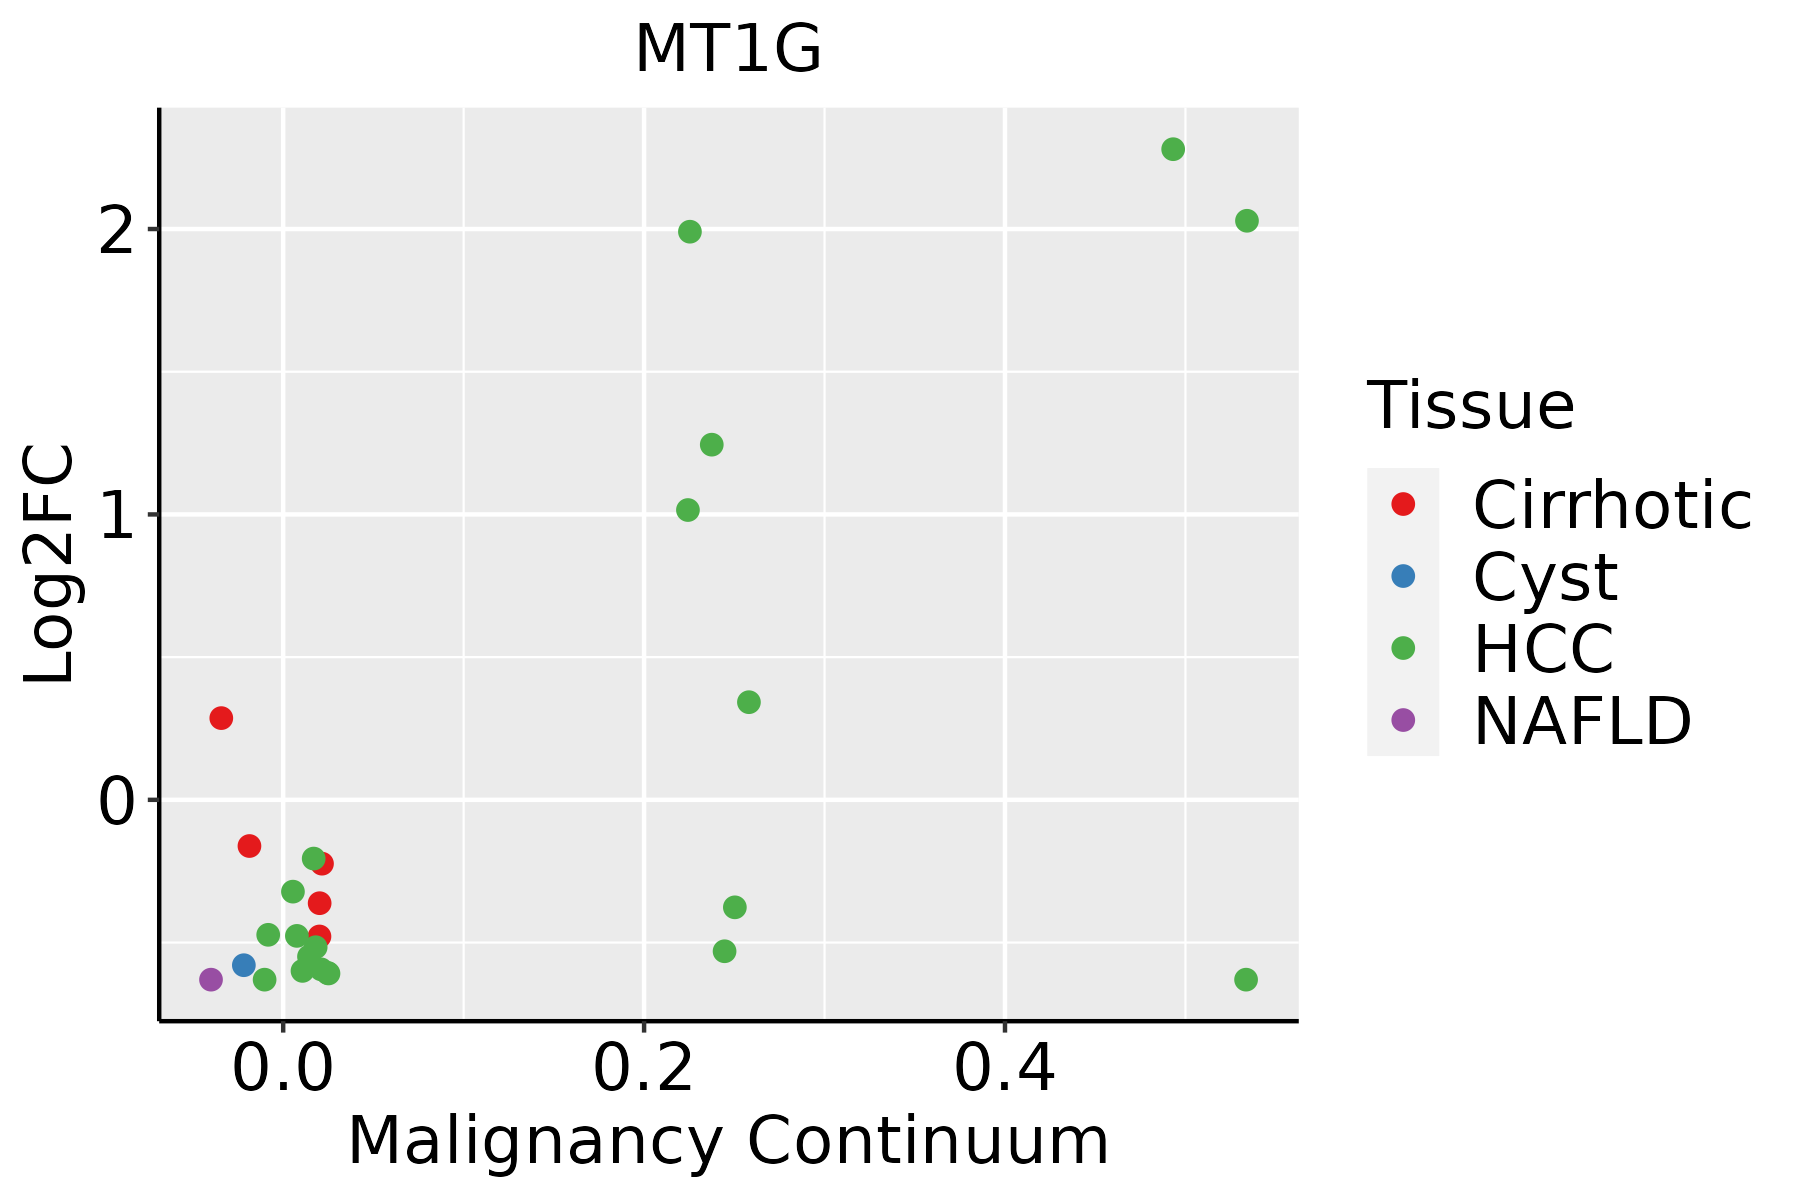 | HCC: Hepatocellular carcinoma |
| NAFLD: Non-alcoholic fatty liver disease | ||
| Oral Cavity | 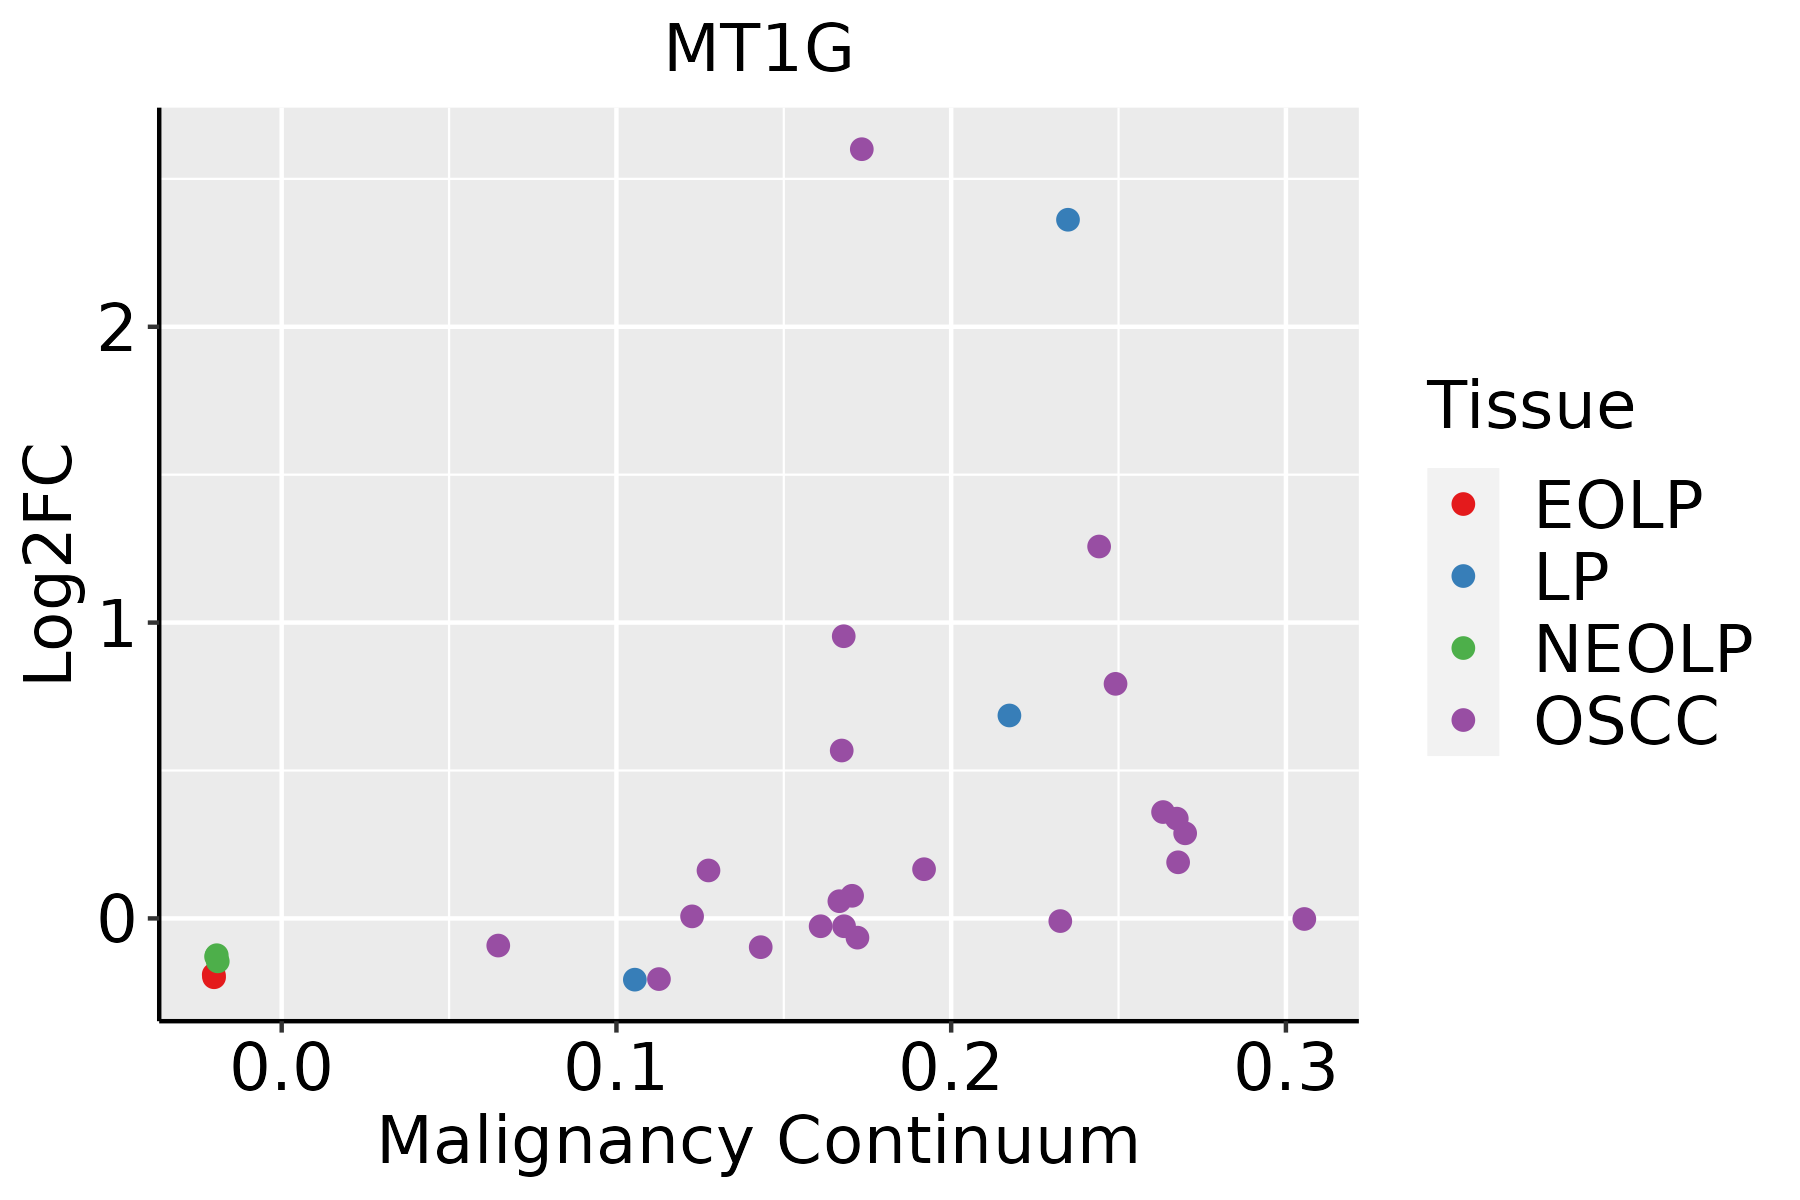 | EOLP: Erosive Oral lichen planus |
| LP: leukoplakia | ||
| NEOLP: Non-erosive oral lichen planus | ||
| OSCC: Oral squamous cell carcinoma | ||
| Prostate | 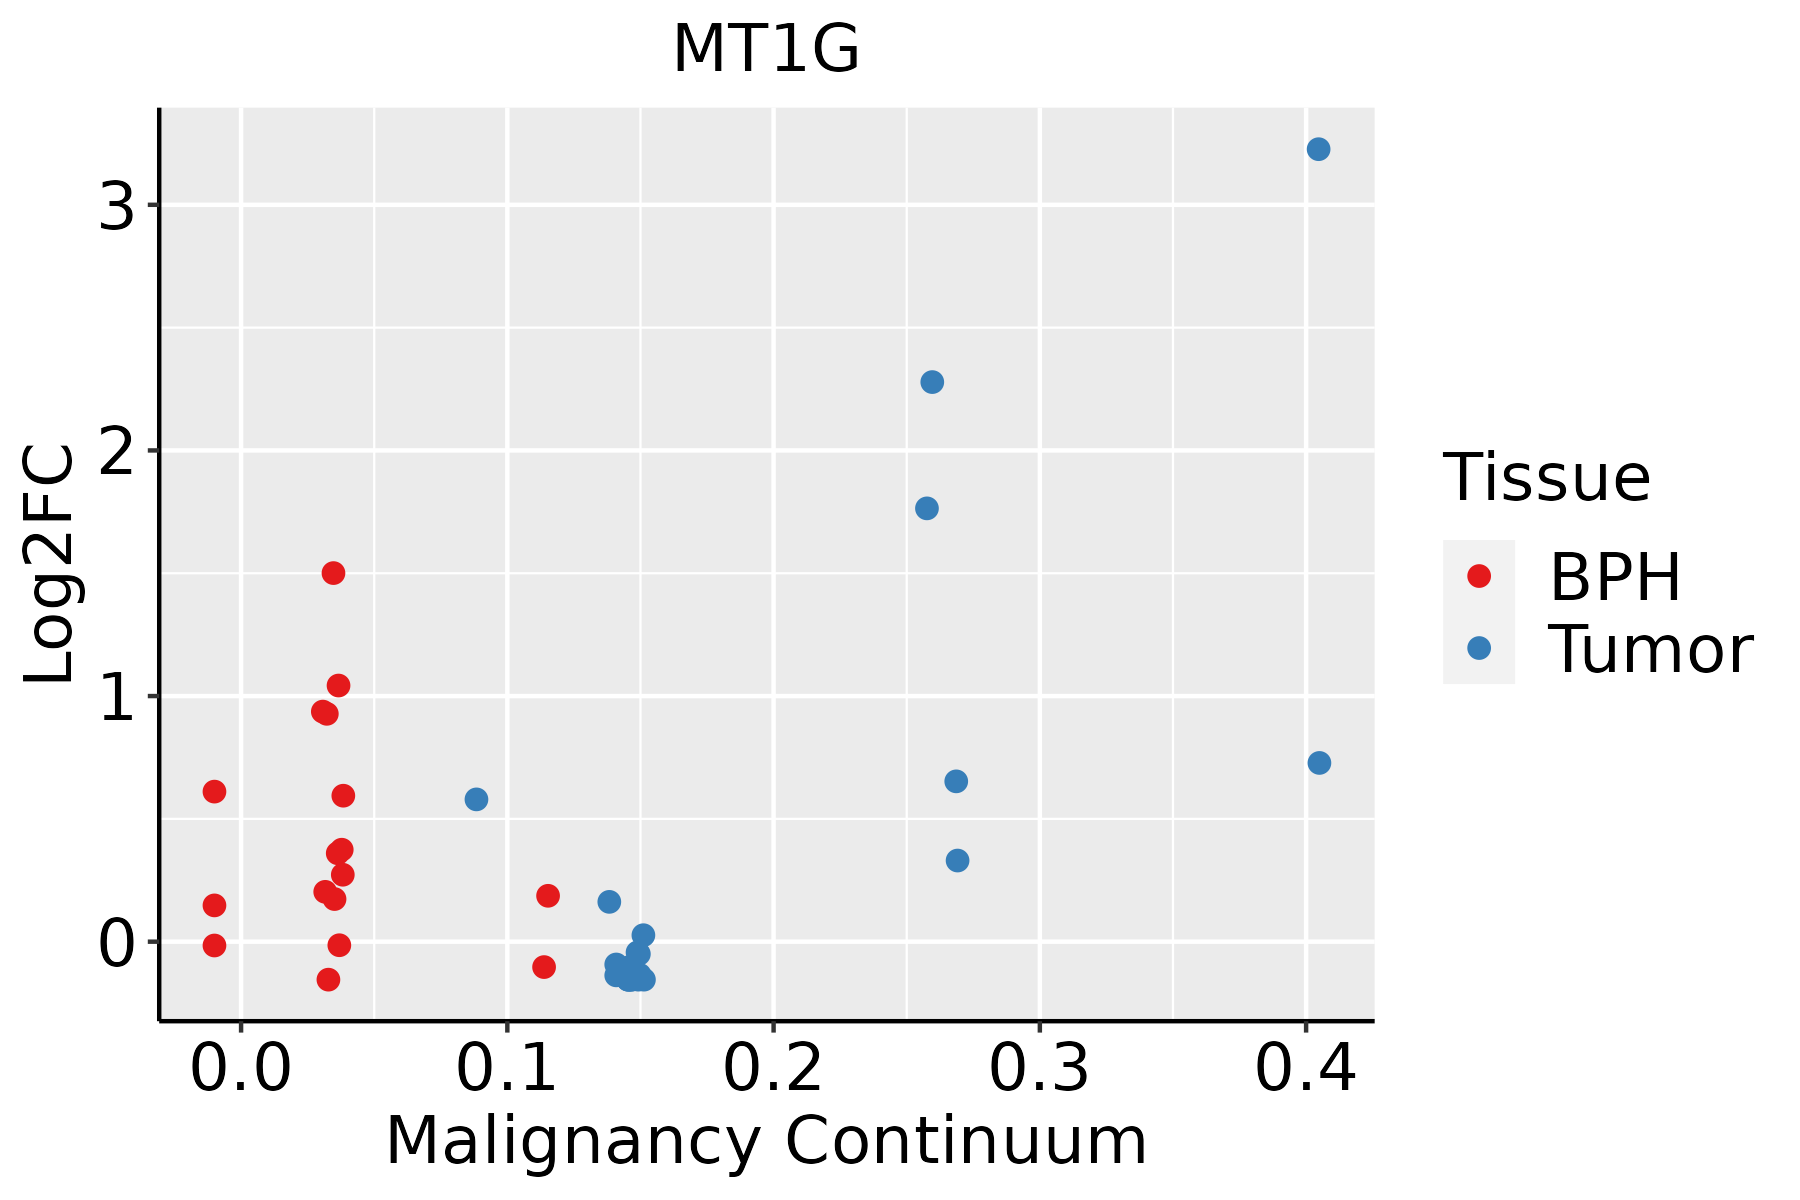 | BPH: Benign Prostatic Hyperplasia |
| Skin | 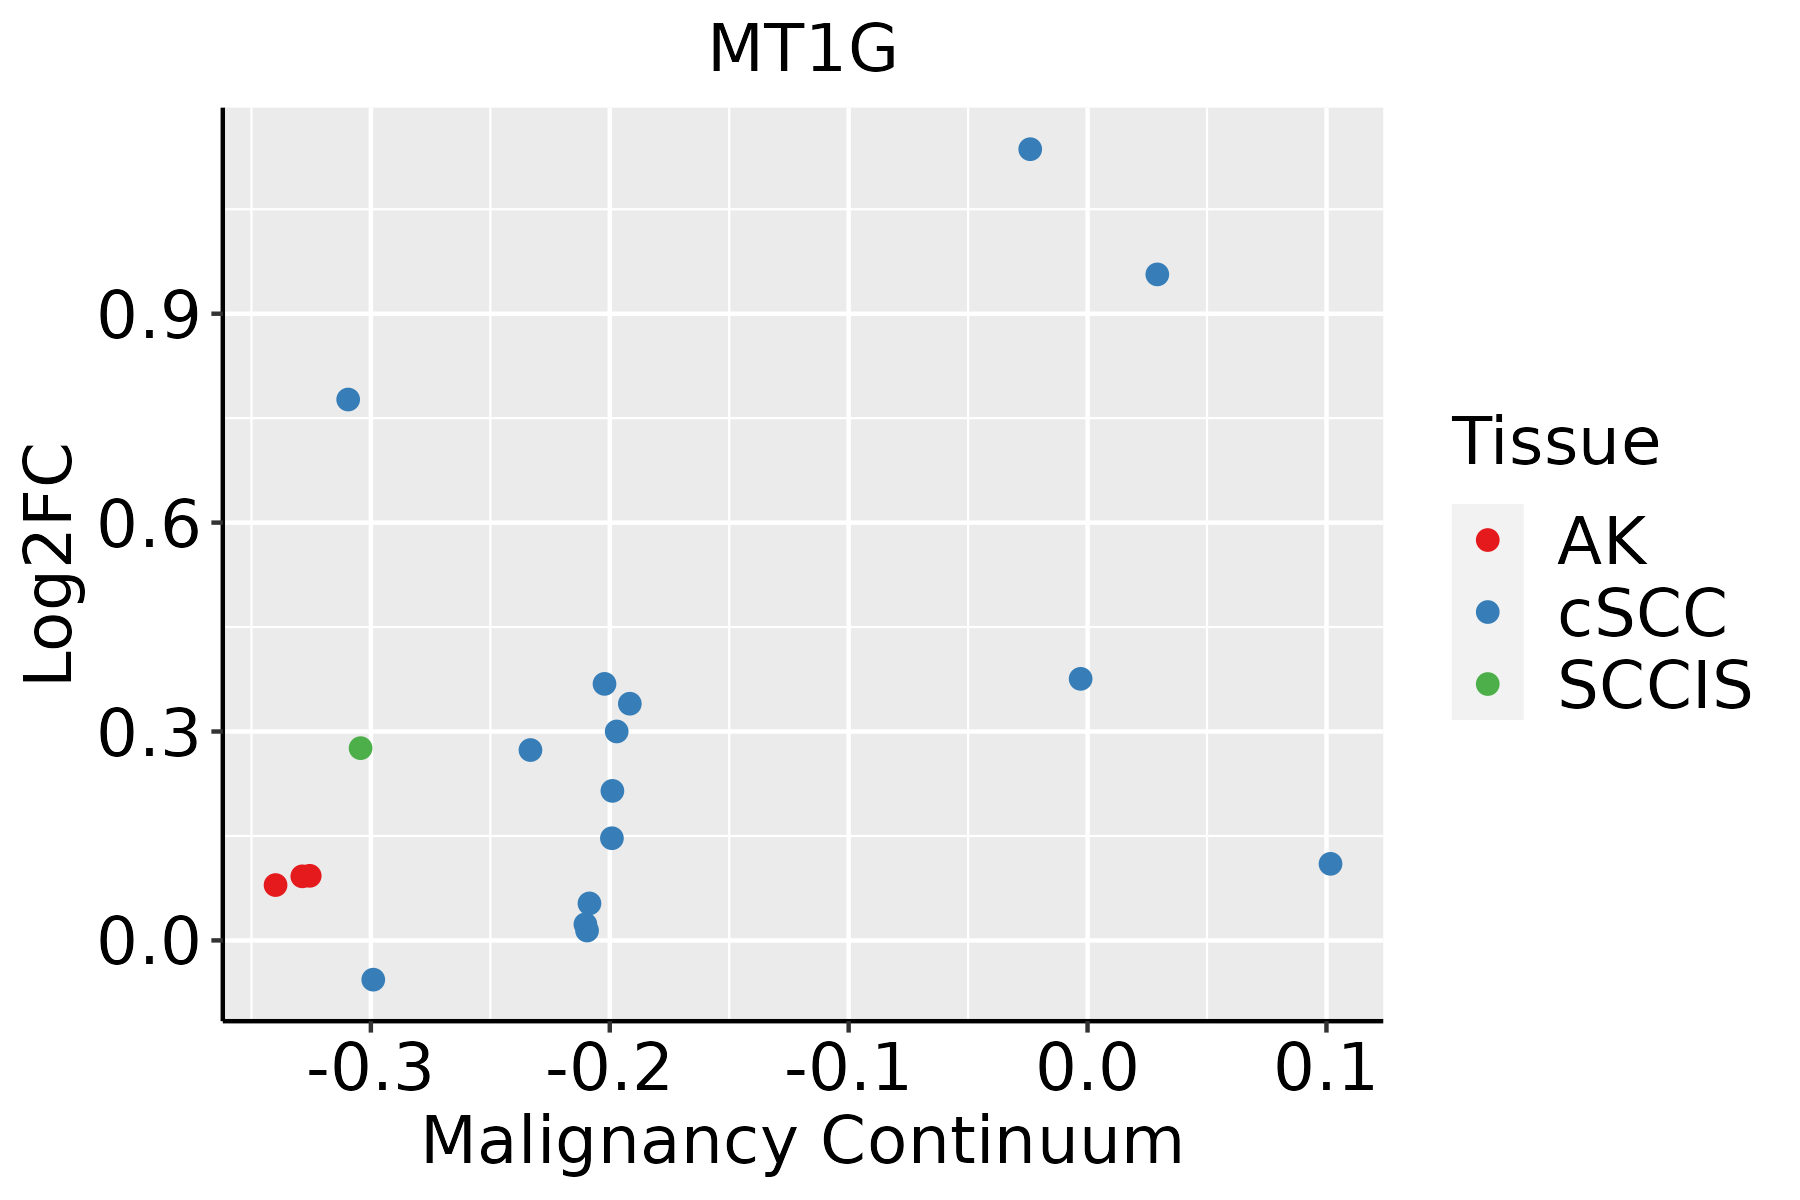 | AK: Actinic keratosis |
| cSCC: Cutaneous squamous cell carcinoma | ||
| SCCIS:squamous cell carcinoma in situ | ||
| Thyroid | 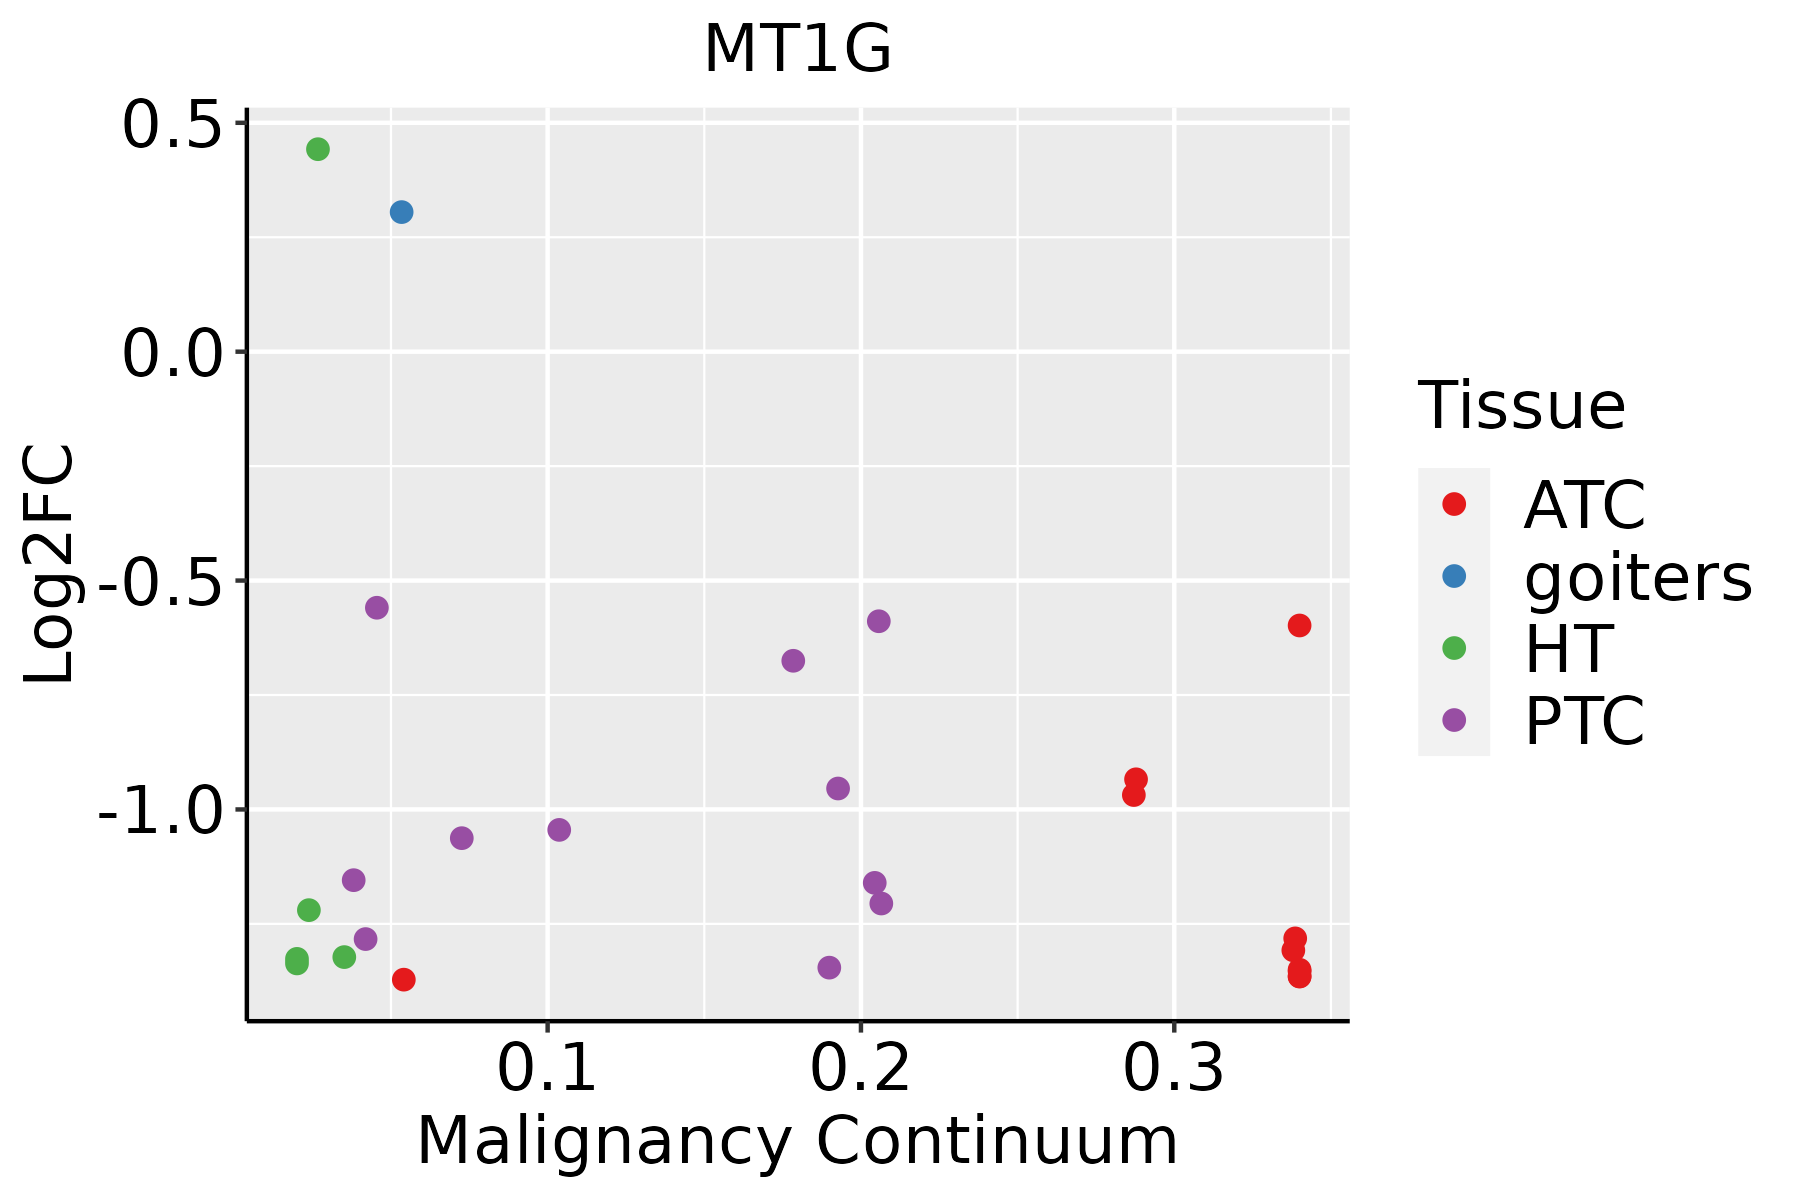 | ATC: Anaplastic thyroid cancer |
| HT: Hashimoto's thyroiditis | ||
| PTC: Papillary thyroid cancer |
| ∗log2FC in expression of this searched gene in stem-like cells from each diseased tissue sample relative to stem-like cells in normal samples in each tissue plotted against the malignancy continuum. Samples are colored based on if they are from different disease stage. |
Top |
Malignant transformation related pathway analysis |
| Find out the enriched GO biological processes and KEGG pathways involved in transition from healthy to precancer to cancer |
| Tissue | Disease Stage | Enriched GO biological Processes |
| Colorectum | AD |  |
| Colorectum | SER |  |
| Colorectum | MSS |  |
| Colorectum | MSI-H |  |
| Colorectum | FAP |  |
| ∗Top 15 enriched GO BP terms are showed in the bar plot of each disease state in each tissue. Each row represents a significant GO biological process which is colored according to the -log10(p.adjust). |
| Page: 1 2 3 4 5 6 7 8 9 |
| GO ID | Tissue | Disease Stage | Description | Gene Ratio | Bg Ratio | pvalue | p.adjust | Count |
| GO:001003814 | Breast | IDC | response to metal ion | 65/1434 | 373/18723 | 2.95e-10 | 3.42e-08 | 65 |
| GO:004668613 | Breast | IDC | response to cadmium ion | 19/1434 | 68/18723 | 4.97e-07 | 2.45e-05 | 19 |
| GO:000963613 | Breast | IDC | response to toxic substance | 44/1434 | 262/18723 | 6.33e-07 | 3.00e-05 | 44 |
| GO:009875413 | Breast | IDC | detoxification | 29/1434 | 152/18723 | 3.97e-06 | 1.43e-04 | 29 |
| GO:003009914 | Breast | IDC | myeloid cell differentiation | 54/1434 | 381/18723 | 8.07e-06 | 2.39e-04 | 54 |
| GO:003022412 | Breast | IDC | monocyte differentiation | 12/1434 | 36/18723 | 8.61e-06 | 2.47e-04 | 12 |
| GO:000257312 | Breast | IDC | myeloid leukocyte differentiation | 33/1434 | 208/18723 | 5.02e-05 | 1.09e-03 | 33 |
| GO:007127613 | Breast | IDC | cellular response to cadmium ion | 11/1434 | 40/18723 | 1.48e-04 | 2.60e-03 | 11 |
| GO:005507613 | Breast | IDC | transition metal ion homeostasis | 23/1434 | 138/18723 | 3.20e-04 | 4.79e-03 | 23 |
| GO:001004311 | Breast | IDC | response to zinc ion | 13/1434 | 58/18723 | 3.59e-04 | 5.18e-03 | 13 |
| GO:004691612 | Breast | IDC | cellular transition metal ion homeostasis | 20/1434 | 115/18723 | 4.35e-04 | 5.90e-03 | 20 |
| GO:190313111 | Breast | IDC | mononuclear cell differentiation | 51/1434 | 426/18723 | 9.81e-04 | 1.11e-02 | 51 |
| GO:00466887 | Breast | IDC | response to copper ion | 10/1434 | 42/18723 | 1.03e-03 | 1.14e-02 | 10 |
| GO:009750112 | Breast | IDC | stress response to metal ion | 6/1434 | 19/18723 | 2.27e-03 | 2.09e-02 | 6 |
| GO:007124813 | Breast | IDC | cellular response to metal ion | 27/1434 | 197/18723 | 2.28e-03 | 2.09e-02 | 27 |
| GO:00102737 | Breast | IDC | detoxification of copper ion | 5/1434 | 15/18723 | 4.10e-03 | 3.25e-02 | 5 |
| GO:19901697 | Breast | IDC | stress response to copper ion | 5/1434 | 15/18723 | 4.10e-03 | 3.25e-02 | 5 |
| GO:007124113 | Breast | IDC | cellular response to inorganic substance | 29/1434 | 226/18723 | 4.28e-03 | 3.34e-02 | 29 |
| GO:001003824 | Breast | DCIS | response to metal ion | 65/1390 | 373/18723 | 8.03e-11 | 9.88e-09 | 65 |
| GO:004668623 | Breast | DCIS | response to cadmium ion | 19/1390 | 68/18723 | 3.07e-07 | 1.46e-05 | 19 |
| Page: 1 2 3 4 5 6 7 8 9 10 11 12 13 14 15 16 17 |
| Pathway ID | Tissue | Disease Stage | Description | Gene Ratio | Bg Ratio | pvalue | p.adjust | qvalue | Count |
| hsa0497812 | Breast | IDC | Mineral absorption | 13/867 | 60/8465 | 6.73e-03 | 3.42e-02 | 2.56e-02 | 13 |
| hsa0497813 | Breast | IDC | Mineral absorption | 13/867 | 60/8465 | 6.73e-03 | 3.42e-02 | 2.56e-02 | 13 |
| hsa0497821 | Breast | DCIS | Mineral absorption | 13/846 | 60/8465 | 5.48e-03 | 2.81e-02 | 2.07e-02 | 13 |
| hsa0497831 | Breast | DCIS | Mineral absorption | 13/846 | 60/8465 | 5.48e-03 | 2.81e-02 | 2.07e-02 | 13 |
| hsa0497814 | Prostate | BPH | Mineral absorption | 20/1718 | 60/8465 | 1.22e-02 | 3.61e-02 | 2.23e-02 | 20 |
| hsa0497815 | Prostate | BPH | Mineral absorption | 20/1718 | 60/8465 | 1.22e-02 | 3.61e-02 | 2.23e-02 | 20 |
| hsa04978 | Stomach | GC | Mineral absorption | 15/708 | 60/8465 | 8.88e-05 | 9.80e-04 | 6.90e-04 | 15 |
| hsa049781 | Stomach | GC | Mineral absorption | 15/708 | 60/8465 | 8.88e-05 | 9.80e-04 | 6.90e-04 | 15 |
| hsa049782 | Stomach | CAG with IM | Mineral absorption | 12/640 | 60/8465 | 1.52e-03 | 1.01e-02 | 7.10e-03 | 12 |
| hsa049783 | Stomach | CAG with IM | Mineral absorption | 12/640 | 60/8465 | 1.52e-03 | 1.01e-02 | 7.10e-03 | 12 |
| hsa049784 | Stomach | CSG | Mineral absorption | 11/633 | 60/8465 | 4.40e-03 | 2.53e-02 | 1.82e-02 | 11 |
| hsa049785 | Stomach | CSG | Mineral absorption | 11/633 | 60/8465 | 4.40e-03 | 2.53e-02 | 1.82e-02 | 11 |
| hsa049786 | Stomach | CAG | Mineral absorption | 8/368 | 60/8465 | 4.18e-03 | 2.94e-02 | 2.36e-02 | 8 |
| hsa049787 | Stomach | CAG | Mineral absorption | 8/368 | 60/8465 | 4.18e-03 | 2.94e-02 | 2.36e-02 | 8 |
| hsa049788 | Stomach | SIM | Mineral absorption | 11/465 | 60/8465 | 3.61e-04 | 3.41e-03 | 2.74e-03 | 11 |
| hsa049789 | Stomach | SIM | Mineral absorption | 11/465 | 60/8465 | 3.61e-04 | 3.41e-03 | 2.74e-03 | 11 |
| Page: 1 |
Top |
Cell-cell communication analysis |
| Identification of potential cell-cell interactions between two cell types and their ligand-receptor pairs for different disease states |
| Ligand | Receptor | LRpair | Pathway | Tissue | Disease Stage |
| Page: 1 |
Top |
Single-cell gene regulatory network inference analysis |
| Find out the significant the regulons (TFs) and the target genes of each regulon across cell types for different disease states |
| TF | Cell Type | Tissue | Disease Stage | Target Gene | RSS | Regulon Activity |
| ∗The dot plots of a searched regulon are shown for all cell subpopulations in each disease state of each tissue based on the regulon specific score inferred using pySCENIC and by calculating the average expression. |
| Page: 1 |
Top |
Somatic mutation of malignant transformation related genes |
| Annotation of somatic variants for genes involved in malignant transformation |
| Hugo Symbol | Variant Class | Variant Classification | dbSNP RS | HGVSc | HGVSp | HGVSp Short | SWISSPROT | BIOTYPE | SIFT | PolyPhen | Tumor Sample Barcode | Tissue | Histology | Sex | Age | Stage | Therapy Types | Drugs | Outcome |
| MT1G | SNV | Missense_Mutation | c.185C>T | p.Ala62Val | p.A62V | P13640 | protein_coding | deleterious_low_confidence(0.02) | benign(0.399) | TCGA-AA-A01P-01 | Colorectum | colon adenocarcinoma | Female | >=65 | III/IV | Unknown | Unknown | PD | |
| MT1G | SNV | Missense_Mutation | novel | c.14N>A | p.Cys5Tyr | p.C5Y | P13640 | protein_coding | deleterious_low_confidence(0.01) | probably_damaging(0.99) | TCGA-A5-A0G2-01 | Endometrium | uterine corpus endometrioid carcinoma | Female | <65 | III/IV | Unknown | Unknown | SD |
| MT1G | SNV | Missense_Mutation | novel | c.137N>T | p.Ala46Val | p.A46V | P13640 | protein_coding | deleterious(0.04) | possibly_damaging(0.463) | TCGA-AX-A0J1-01 | Endometrium | uterine corpus endometrioid carcinoma | Female | >=65 | I/II | Unknown | Unknown | SD |
| MT1G | SNV | Missense_Mutation | c.49N>T | p.Ala17Ser | p.A17S | P13640 | protein_coding | tolerated_low_confidence(0.23) | benign(0.111) | TCGA-73-4670-01 | Lung | lung adenocarcinoma | Female | >=65 | III/IV | Chemotherapy | carboplatin | SD | |
| MT1G | SNV | Missense_Mutation | rs546669333 | c.164C>T | p.Ser55Leu | p.S55L | P13640 | protein_coding | tolerated(0.18) | benign(0.001) | TCGA-BR-8680-01 | Stomach | stomach adenocarcinoma | Male | <65 | III/IV | Chemotherapy | oxaliplatin | CR |
| MT1G | SNV | Missense_Mutation | rs370776559 | c.49N>A | p.Ala17Thr | p.A17T | P13640 | protein_coding | tolerated_low_confidence(0.2) | benign(0.003) | TCGA-VQ-A8P2-01 | Stomach | stomach adenocarcinoma | Male | >=65 | III/IV | Unspecific | Complete Response |
| Page: 1 |
Top |
Related drugs of malignant transformation related genes |
| Identification of chemicals and drugs interact with genes involved in malignant transfromation |
| (DGIdb 4.0) |
| Entrez ID | Symbol | Category | Interaction Types | Drug Claim Name | Drug Name | PMIDs |
| 4495 | MT1G | NA | BSO | 8966720 |
| Page: 1 |

Copyright 2023-Present -The University of Texas Health Science Center at Houston |