
|
|||||
|
 | |
| |
| |
| |
| |
| |
|
Gene: MT1F |
Gene summary for MT1F |
| Gene information | Species | Human | Gene symbol | MT1F | Gene ID | 4494 |
| Gene name | metallothionein 1F | |
| Gene Alias | MT1 | |
| Cytomap | 16q13 | |
| Gene Type | protein-coding | GO ID | GO:0006873 | UniProtAcc | H3BRY8 |
Top |
Malignant transformation analysis |
| Identification of the aberrant gene expression in precancerous and cancerous lesions by comparing the gene expression of stem-like cells in diseased tissues with normal stem cells |
| Entrez ID | Symbol | Replicates | Species | Organ | Tissue | Adj P-value | Log2FC | Malignancy |
| 4494 | MT1F | HTA11_2487_2000001011 | Human | Colorectum | SER | 1.16e-19 | 7.84e-01 | -0.1808 |
| 4494 | MT1F | HTA11_2951_2000001011 | Human | Colorectum | AD | 6.61e-04 | 4.87e-01 | 0.0216 |
| 4494 | MT1F | HTA11_347_2000001011 | Human | Colorectum | AD | 2.64e-18 | 5.74e-01 | -0.1954 |
| 4494 | MT1F | HTA11_3361_2000001011 | Human | Colorectum | AD | 1.86e-07 | 5.36e-01 | -0.1207 |
| 4494 | MT1F | HTA11_696_2000001011 | Human | Colorectum | AD | 5.76e-13 | 4.77e-01 | -0.1464 |
| 4494 | MT1F | HTA11_866_2000001011 | Human | Colorectum | AD | 1.21e-20 | 7.52e-01 | -0.1001 |
| 4494 | MT1F | HTA11_1391_2000001011 | Human | Colorectum | AD | 5.65e-07 | 5.16e-01 | -0.059 |
| 4494 | MT1F | HTA11_2992_2000001011 | Human | Colorectum | SER | 7.54e-11 | 8.52e-01 | -0.1706 |
| 4494 | MT1F | HTA11_5212_2000001011 | Human | Colorectum | AD | 1.08e-22 | 1.25e+00 | -0.2061 |
| 4494 | MT1F | HTA11_5216_2000001011 | Human | Colorectum | SER | 7.06e-09 | 5.80e-01 | -0.1462 |
| 4494 | MT1F | HTA11_546_2000001011 | Human | Colorectum | AD | 4.38e-09 | 7.41e-01 | -0.0842 |
| 4494 | MT1F | HTA11_866_3004761011 | Human | Colorectum | AD | 6.16e-09 | 3.37e-01 | 0.096 |
| 4494 | MT1F | HTA11_7663_2000001011 | Human | Colorectum | SER | 1.52e-02 | 4.71e-01 | 0.0131 |
| 4494 | MT1F | HTA11_10623_2000001011 | Human | Colorectum | AD | 2.42e-02 | 3.42e-01 | -0.0177 |
| 4494 | MT1F | HTA11_6818_2000001011 | Human | Colorectum | AD | 2.48e-06 | 5.06e-01 | 0.0112 |
| 4494 | MT1F | HTA11_7469_2000001011 | Human | Colorectum | AD | 4.33e-11 | 1.35e+00 | -0.0124 |
| 4494 | MT1F | LZE4T | Human | Esophagus | ESCC | 4.49e-03 | 2.01e-01 | 0.0811 |
| 4494 | MT1F | LZE7T | Human | Esophagus | ESCC | 1.19e-04 | 4.41e-01 | 0.0667 |
| 4494 | MT1F | LZE8T | Human | Esophagus | ESCC | 1.22e-10 | 3.83e-01 | 0.067 |
| 4494 | MT1F | LZE6T | Human | Esophagus | ESCC | 4.11e-08 | 4.14e-01 | 0.0845 |
| Page: 1 2 3 4 5 6 7 |
| Tissue | Expression Dynamics | Abbreviation |
| Colorectum (GSE201348) |  | FAP: Familial adenomatous polyposis |
| CRC: Colorectal cancer | ||
| Colorectum (HTA11) |  | AD: Adenomas |
| SER: Sessile serrated lesions | ||
| MSI-H: Microsatellite-high colorectal cancer | ||
| MSS: Microsatellite stable colorectal cancer | ||
| Esophagus |  | ESCC: Esophageal squamous cell carcinoma |
| HGIN: High-grade intraepithelial neoplasias | ||
| LGIN: Low-grade intraepithelial neoplasias | ||
| GC | 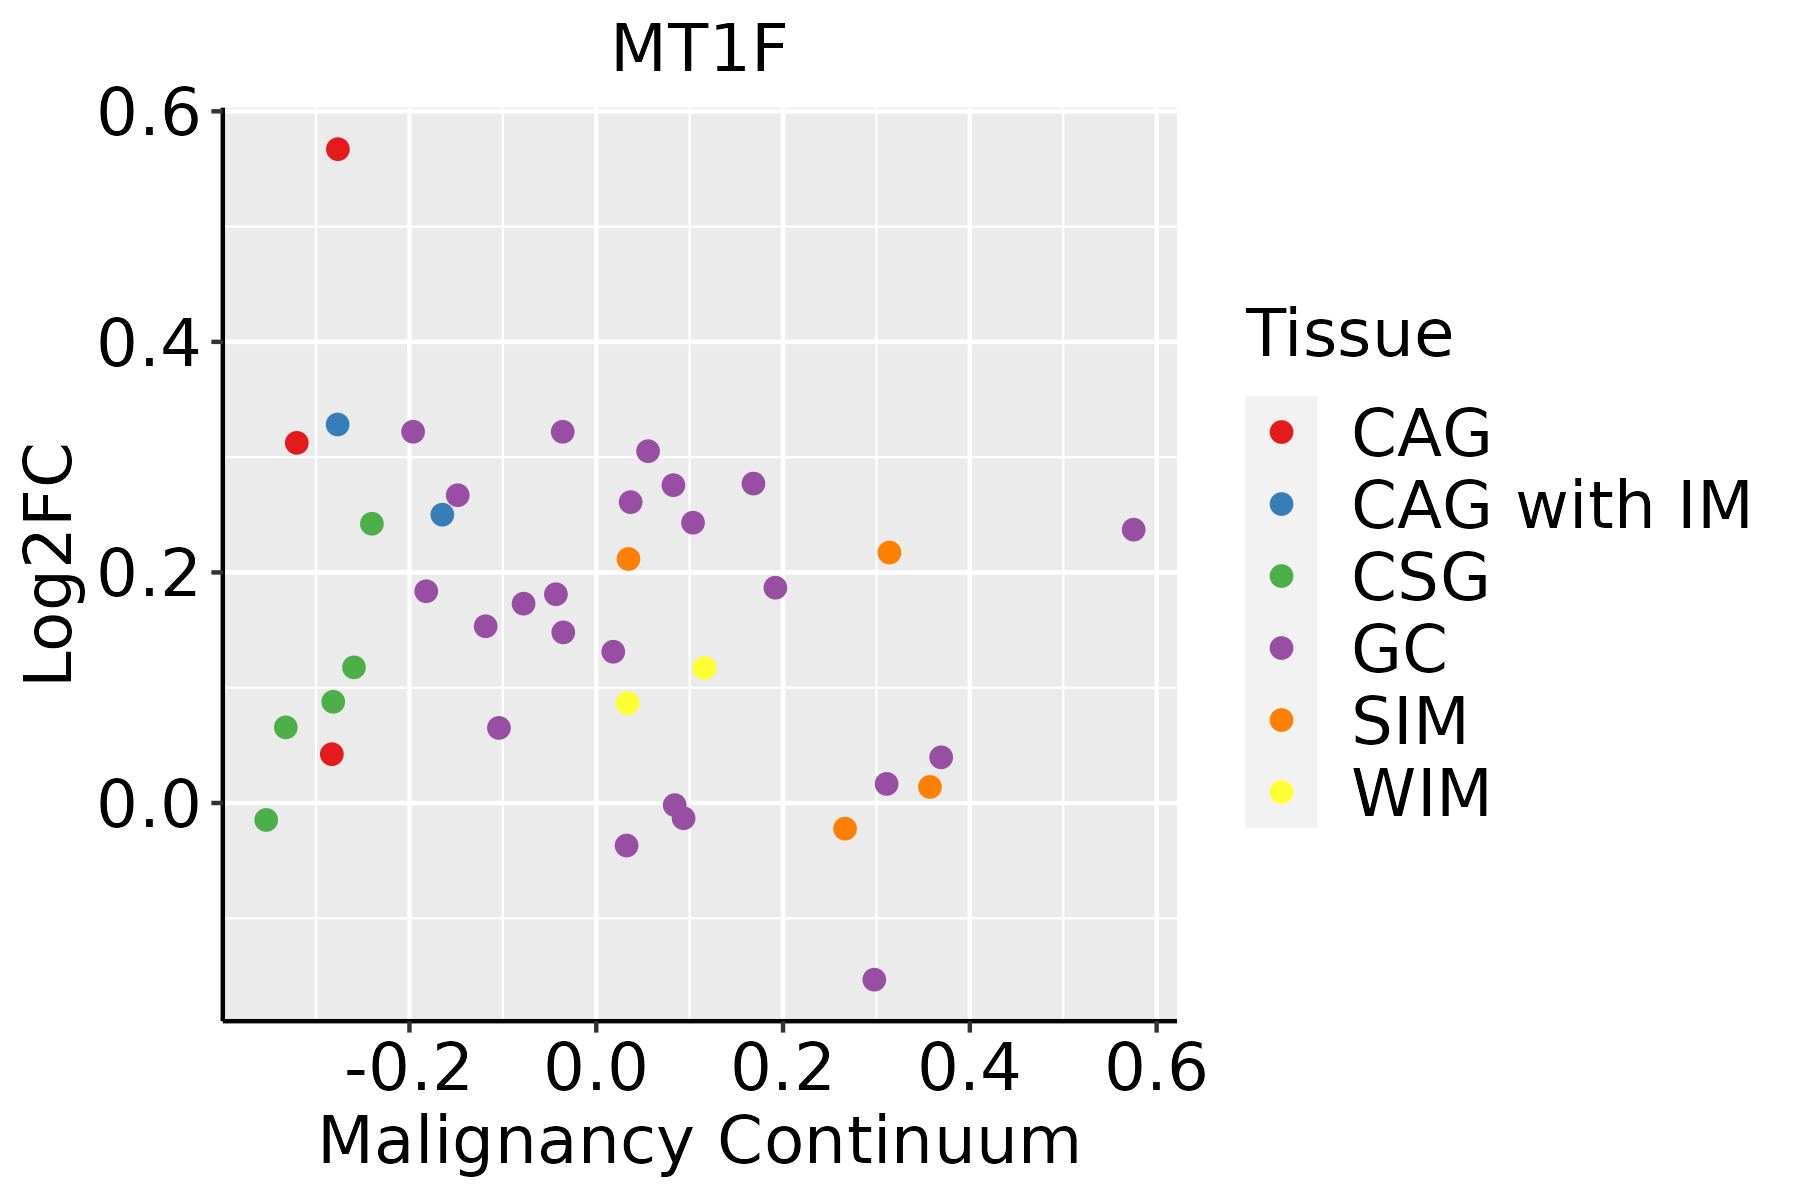 | CAG: Chronic atrophic gastritis |
| CAG with IM: Chronic atrophic gastritis with intestinal metaplasia | ||
| CSG: Chronic superficial gastritis | ||
| GC: Gastric cancer | ||
| SIM: Severe intestinal metaplasia | ||
| WIM: Wild intestinal metaplasia | ||
| Liver | 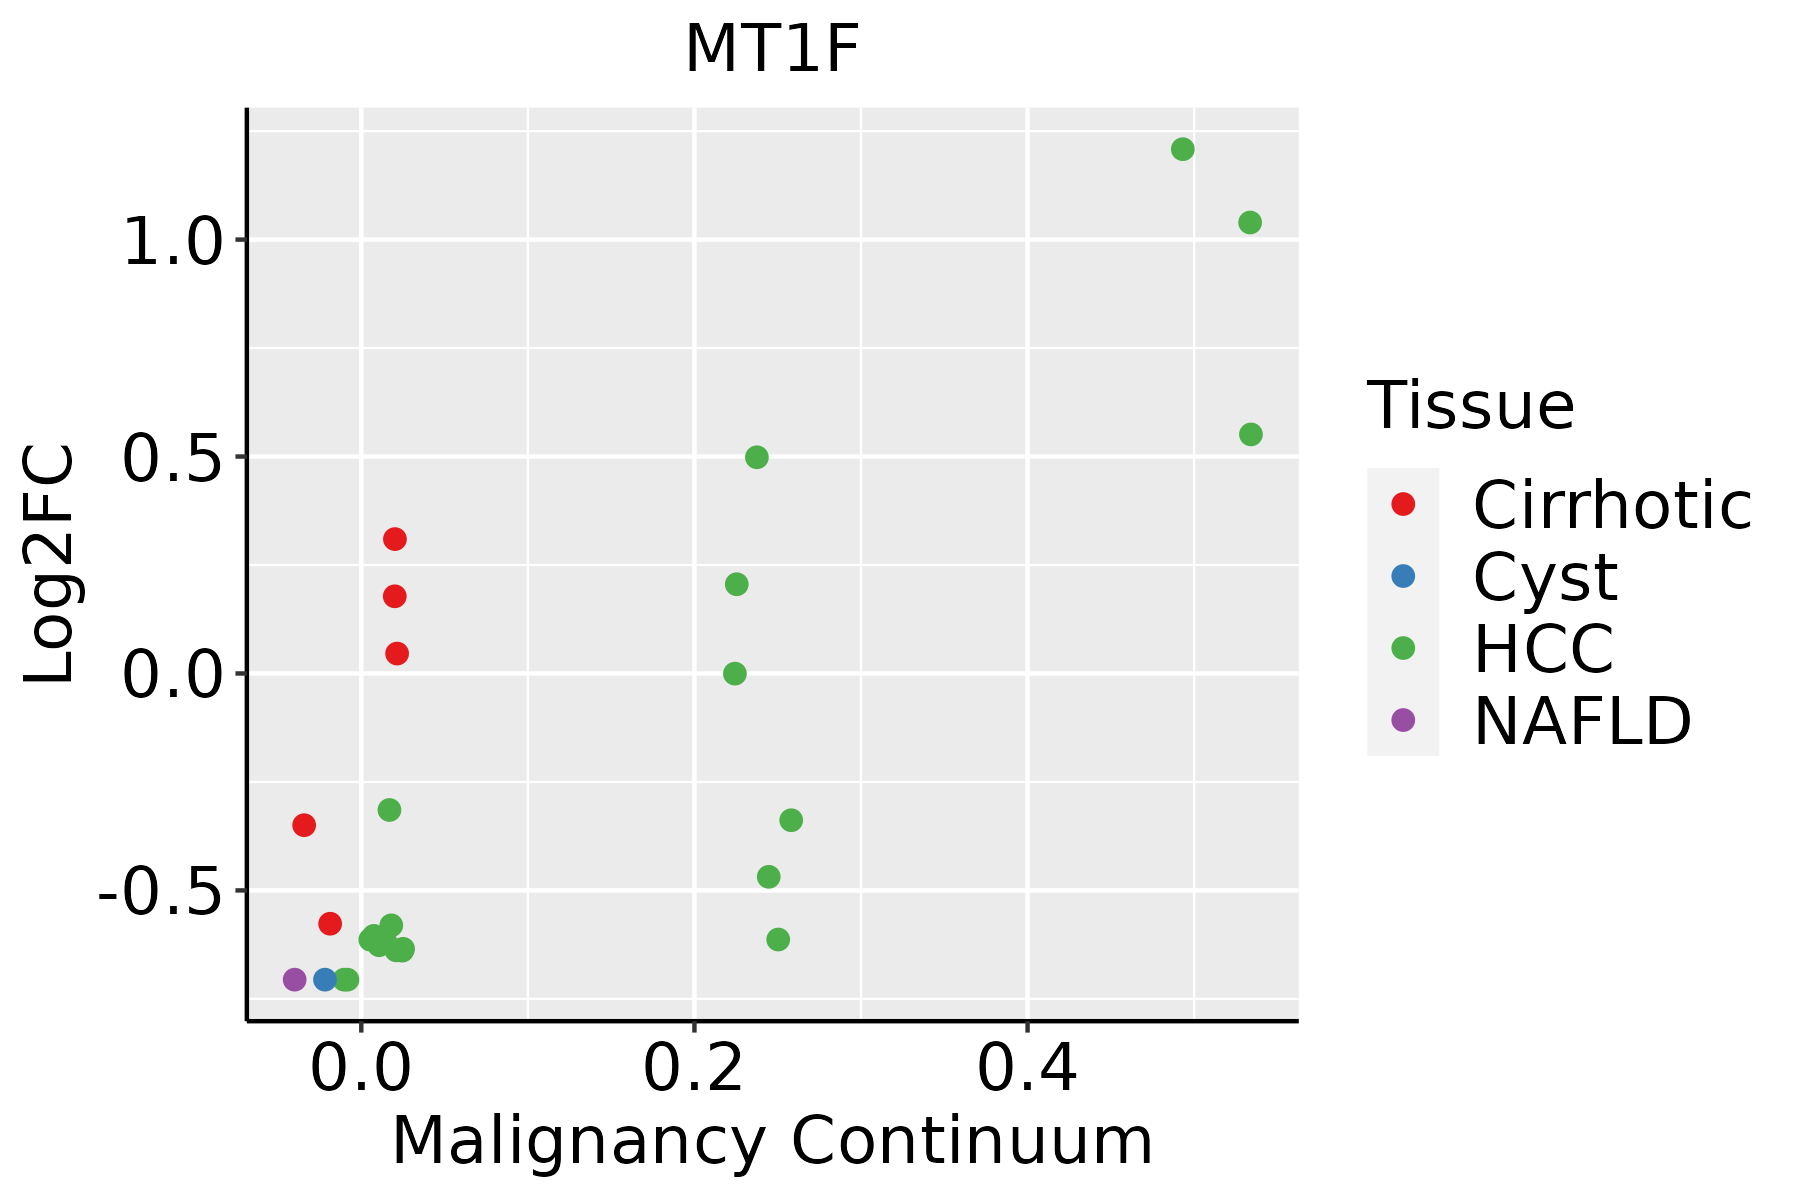 | HCC: Hepatocellular carcinoma |
| NAFLD: Non-alcoholic fatty liver disease | ||
| Oral Cavity | 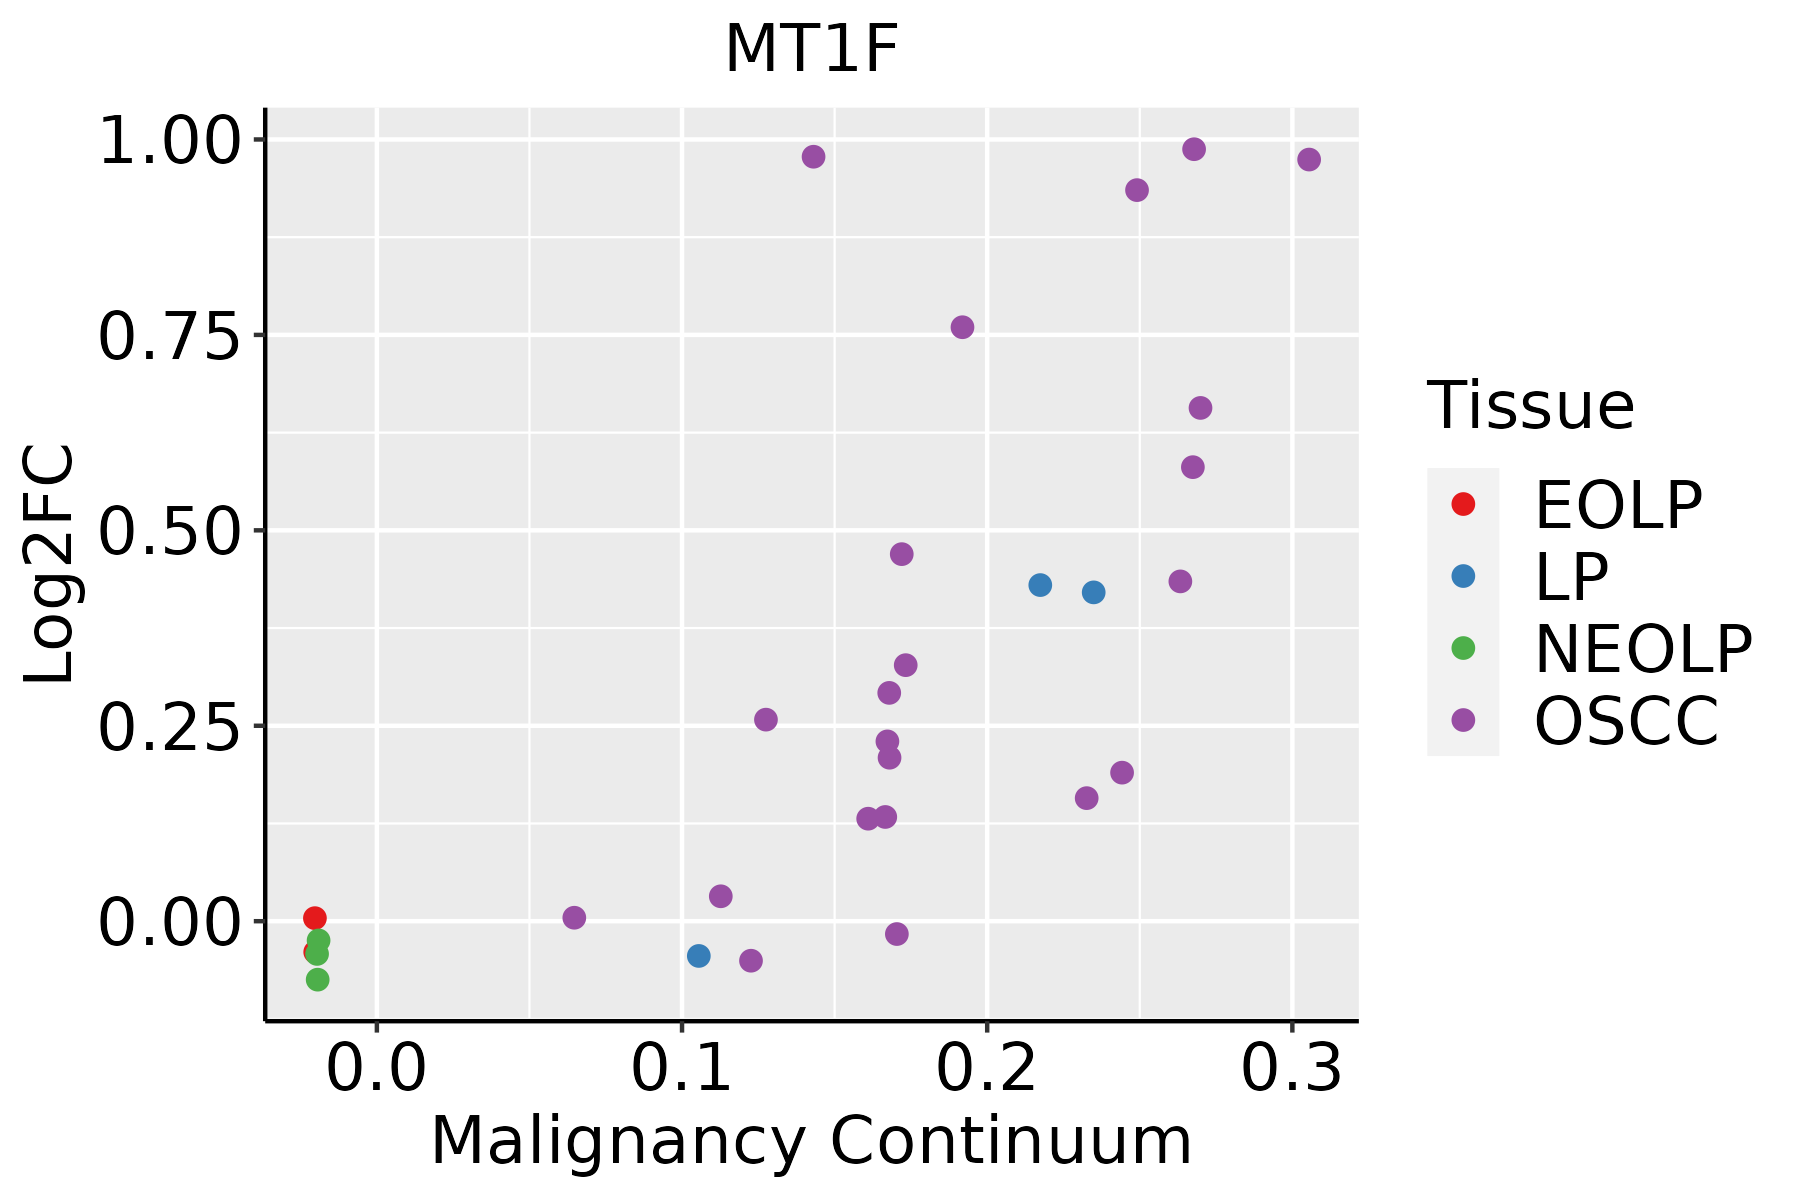 | EOLP: Erosive Oral lichen planus |
| LP: leukoplakia | ||
| NEOLP: Non-erosive oral lichen planus | ||
| OSCC: Oral squamous cell carcinoma | ||
| Thyroid | 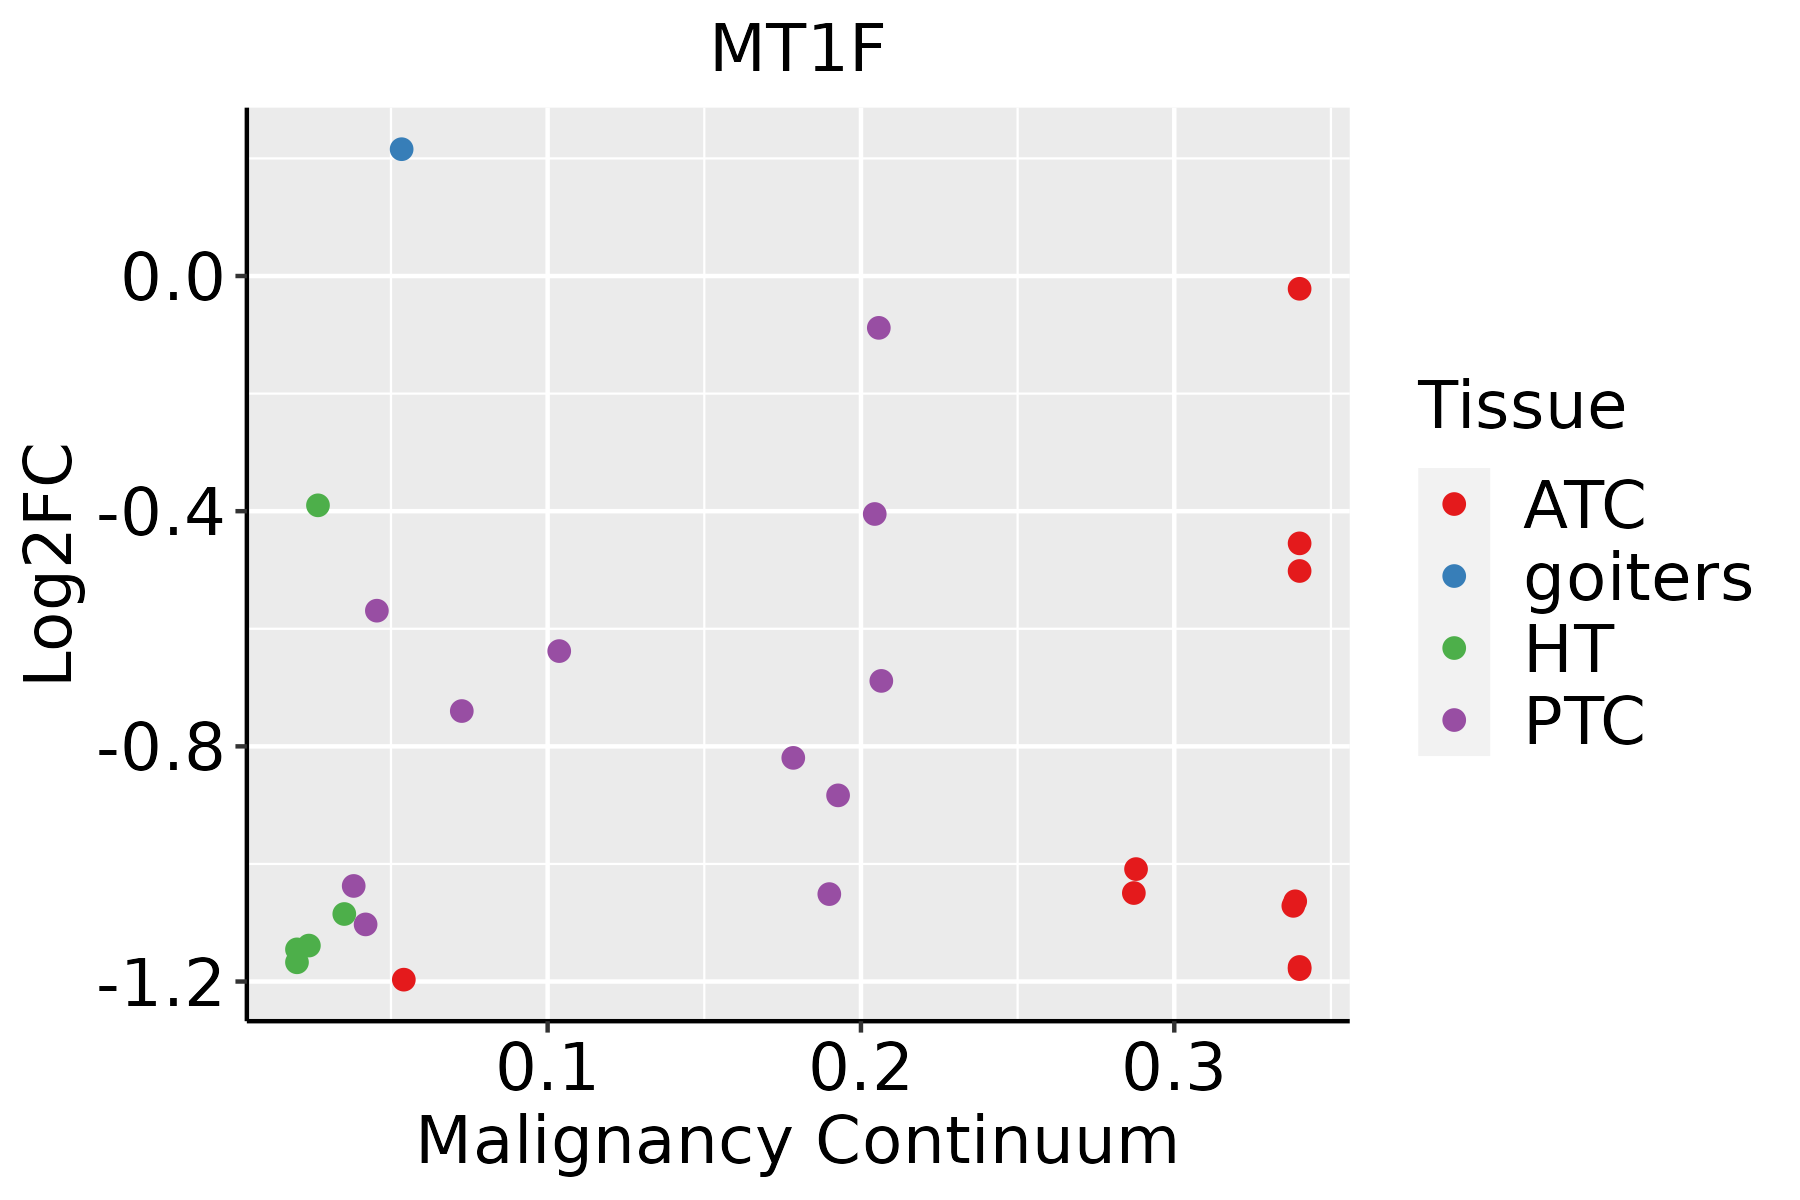 | ATC: Anaplastic thyroid cancer |
| HT: Hashimoto's thyroiditis | ||
| PTC: Papillary thyroid cancer |
| ∗log2FC in expression of this searched gene in stem-like cells from each diseased tissue sample relative to stem-like cells in normal samples in each tissue plotted against the malignancy continuum. Samples are colored based on if they are from different disease stage. |
Top |
Malignant transformation related pathway analysis |
| Find out the enriched GO biological processes and KEGG pathways involved in transition from healthy to precancer to cancer |
| Tissue | Disease Stage | Enriched GO biological Processes |
| Colorectum | AD |  |
| Colorectum | SER |  |
| Colorectum | MSS |  |
| Colorectum | MSI-H |  |
| Colorectum | FAP |  |
| ∗Top 15 enriched GO BP terms are showed in the bar plot of each disease state in each tissue. Each row represents a significant GO biological process which is colored according to the -log10(p.adjust). |
| Page: 1 2 3 4 5 6 7 8 9 |
| GO ID | Tissue | Disease Stage | Description | Gene Ratio | Bg Ratio | pvalue | p.adjust | Count |
| GO:0009636 | Colorectum | AD | response to toxic substance | 88/3918 | 262/18723 | 1.12e-06 | 3.72e-05 | 88 |
| GO:0055076 | Colorectum | AD | transition metal ion homeostasis | 53/3918 | 138/18723 | 1.89e-06 | 5.65e-05 | 53 |
| GO:0046916 | Colorectum | AD | cellular transition metal ion homeostasis | 43/3918 | 115/18723 | 3.62e-05 | 6.56e-04 | 43 |
| GO:0098754 | Colorectum | AD | detoxification | 53/3918 | 152/18723 | 4.63e-05 | 7.98e-04 | 53 |
| GO:0046686 | Colorectum | AD | response to cadmium ion | 27/3918 | 68/18723 | 3.19e-04 | 3.80e-03 | 27 |
| GO:0010038 | Colorectum | AD | response to metal ion | 106/3918 | 373/18723 | 3.22e-04 | 3.83e-03 | 106 |
| GO:0055069 | Colorectum | AD | zinc ion homeostasis | 18/3918 | 40/18723 | 5.36e-04 | 5.74e-03 | 18 |
| GO:0071276 | Colorectum | AD | cellular response to cadmium ion | 18/3918 | 40/18723 | 5.36e-04 | 5.74e-03 | 18 |
| GO:0071248 | Colorectum | AD | cellular response to metal ion | 61/3918 | 197/18723 | 5.74e-04 | 6.09e-03 | 61 |
| GO:0071241 | Colorectum | AD | cellular response to inorganic substance | 68/3918 | 226/18723 | 6.98e-04 | 7.10e-03 | 68 |
| GO:0006882 | Colorectum | AD | cellular zinc ion homeostasis | 17/3918 | 38/18723 | 8.26e-04 | 8.13e-03 | 17 |
| GO:0097501 | Colorectum | AD | stress response to metal ion | 10/3918 | 19/18723 | 2.25e-03 | 1.77e-02 | 10 |
| GO:0045926 | Colorectum | AD | negative regulation of growth | 70/3918 | 249/18723 | 4.07e-03 | 2.83e-02 | 70 |
| GO:0071294 | Colorectum | AD | cellular response to zinc ion | 11/3918 | 24/18723 | 5.43e-03 | 3.55e-02 | 11 |
| GO:0010273 | Colorectum | AD | detoxification of copper ion | 8/3918 | 15/18723 | 5.67e-03 | 3.64e-02 | 8 |
| GO:1990169 | Colorectum | AD | stress response to copper ion | 8/3918 | 15/18723 | 5.67e-03 | 3.64e-02 | 8 |
| GO:0071280 | Colorectum | AD | cellular response to copper ion | 12/3918 | 28/18723 | 7.21e-03 | 4.39e-02 | 12 |
| GO:0046688 | Colorectum | AD | response to copper ion | 16/3918 | 42/18723 | 8.10e-03 | 4.76e-02 | 16 |
| GO:00096361 | Colorectum | SER | response to toxic substance | 71/2897 | 262/18723 | 8.63e-07 | 4.07e-05 | 71 |
| GO:00987541 | Colorectum | SER | detoxification | 46/2897 | 152/18723 | 3.02e-06 | 1.20e-04 | 46 |
| Page: 1 2 3 4 5 6 7 8 9 10 |
| Pathway ID | Tissue | Disease Stage | Description | Gene Ratio | Bg Ratio | pvalue | p.adjust | qvalue | Count |
| hsa0497810 | Liver | Cyst | Mineral absorption | 8/339 | 60/8465 | 2.53e-03 | 2.08e-02 | 1.72e-02 | 8 |
| hsa0497811 | Liver | Cyst | Mineral absorption | 8/339 | 60/8465 | 2.53e-03 | 2.08e-02 | 1.72e-02 | 8 |
| hsa04978 | Stomach | GC | Mineral absorption | 15/708 | 60/8465 | 8.88e-05 | 9.80e-04 | 6.90e-04 | 15 |
| hsa049781 | Stomach | GC | Mineral absorption | 15/708 | 60/8465 | 8.88e-05 | 9.80e-04 | 6.90e-04 | 15 |
| hsa049782 | Stomach | CAG with IM | Mineral absorption | 12/640 | 60/8465 | 1.52e-03 | 1.01e-02 | 7.10e-03 | 12 |
| hsa049783 | Stomach | CAG with IM | Mineral absorption | 12/640 | 60/8465 | 1.52e-03 | 1.01e-02 | 7.10e-03 | 12 |
| hsa049784 | Stomach | CSG | Mineral absorption | 11/633 | 60/8465 | 4.40e-03 | 2.53e-02 | 1.82e-02 | 11 |
| hsa049785 | Stomach | CSG | Mineral absorption | 11/633 | 60/8465 | 4.40e-03 | 2.53e-02 | 1.82e-02 | 11 |
| hsa049786 | Stomach | CAG | Mineral absorption | 8/368 | 60/8465 | 4.18e-03 | 2.94e-02 | 2.36e-02 | 8 |
| hsa049787 | Stomach | CAG | Mineral absorption | 8/368 | 60/8465 | 4.18e-03 | 2.94e-02 | 2.36e-02 | 8 |
| Page: 1 |
Top |
Cell-cell communication analysis |
| Identification of potential cell-cell interactions between two cell types and their ligand-receptor pairs for different disease states |
| Ligand | Receptor | LRpair | Pathway | Tissue | Disease Stage |
| Page: 1 |
Top |
Single-cell gene regulatory network inference analysis |
| Find out the significant the regulons (TFs) and the target genes of each regulon across cell types for different disease states |
| TF | Cell Type | Tissue | Disease Stage | Target Gene | RSS | Regulon Activity |
| ∗The dot plots of a searched regulon are shown for all cell subpopulations in each disease state of each tissue based on the regulon specific score inferred using pySCENIC and by calculating the average expression. |
| Page: 1 |
Top |
Somatic mutation of malignant transformation related genes |
| Annotation of somatic variants for genes involved in malignant transformation |
| Hugo Symbol | Variant Class | Variant Classification | dbSNP RS | HGVSc | HGVSp | HGVSp Short | SWISSPROT | BIOTYPE | SIFT | PolyPhen | Tumor Sample Barcode | Tissue | Histology | Sex | Age | Stage | Therapy Types | Drugs | Outcome |
| MT1F | SNV | Missense_Mutation | rs139420918 | c.158C>T | p.Ala53Val | p.A53V | P04733 | protein_coding | deleterious(0.04) | benign(0.251) | TCGA-AP-A051-01 | Endometrium | uterine corpus endometrioid carcinoma | Female | >=65 | I/II | Unknown | Unknown | SD |
| Page: 1 |
Top |
Related drugs of malignant transformation related genes |
| Identification of chemicals and drugs interact with genes involved in malignant transfromation |
| (DGIdb 4.0) |
| Entrez ID | Symbol | Category | Interaction Types | Drug Claim Name | Drug Name | PMIDs |
| 4494 | MT1F | NA | DEXAMETHASONE | DEXAMETHASONE | 3342021 | |
| 4494 | MT1F | NA | CISPLATIN | CISPLATIN | 12520915 |
| Page: 1 |

Copyright 2023-Present -The University of Texas Health Science Center at Houston |