
|
|||||
|
 | |
| |
| |
| |
| |
| |
|
Gene: MT-CO2 |
Gene summary for MT-CO2 |
| Gene information | Species | Human | Gene symbol | MT-CO2 | Gene ID | 107075310 |
| Gene name | MT-CO2 pseudogene 12 | |
| Gene Alias | COII | |
| Cytomap | 1p36.33 | |
| Gene Type | pseudo | GO ID | GO:0006091 | UniProtAcc | NA |
Top |
Malignant transformation analysis |
| Identification of the aberrant gene expression in precancerous and cancerous lesions by comparing the gene expression of stem-like cells in diseased tissues with normal stem cells |
| Entrez ID | Symbol | Replicates | Species | Organ | Tissue | Adj P-value | Log2FC | Malignancy |
| 107075310 | MT-CO2 | GSM4909281 | Human | Breast | IDC | 4.12e-05 | 1.77e-01 | 0.21 |
| 107075310 | MT-CO2 | GSM4909282 | Human | Breast | IDC | 2.36e-19 | 2.35e-01 | -0.0288 |
| 107075310 | MT-CO2 | GSM4909285 | Human | Breast | IDC | 4.05e-20 | -3.13e-01 | 0.21 |
| 107075310 | MT-CO2 | GSM4909286 | Human | Breast | IDC | 7.22e-59 | 4.08e-01 | 0.1081 |
| 107075310 | MT-CO2 | GSM4909287 | Human | Breast | IDC | 4.14e-78 | 5.24e-01 | 0.2057 |
| 107075310 | MT-CO2 | GSM4909288 | Human | Breast | IDC | 8.17e-04 | 2.33e-01 | 0.0988 |
| 107075310 | MT-CO2 | GSM4909290 | Human | Breast | IDC | 1.20e-15 | 2.49e-01 | 0.2096 |
| 107075310 | MT-CO2 | GSM4909291 | Human | Breast | IDC | 1.56e-22 | 3.51e-01 | 0.1753 |
| 107075310 | MT-CO2 | GSM4909293 | Human | Breast | IDC | 2.67e-90 | 4.79e-01 | 0.1581 |
| 107075310 | MT-CO2 | GSM4909294 | Human | Breast | IDC | 9.99e-09 | 2.11e-01 | 0.2022 |
| 107075310 | MT-CO2 | GSM4909295 | Human | Breast | IDC | 7.54e-03 | 3.74e-02 | 0.0898 |
| 107075310 | MT-CO2 | GSM4909296 | Human | Breast | IDC | 1.30e-06 | 1.87e-01 | 0.1524 |
| 107075310 | MT-CO2 | GSM4909298 | Human | Breast | IDC | 1.74e-61 | 4.21e-01 | 0.1551 |
| 107075310 | MT-CO2 | GSM4909300 | Human | Breast | IDC | 5.50e-12 | 3.21e-01 | 0.0334 |
| 107075310 | MT-CO2 | GSM4909301 | Human | Breast | IDC | 1.93e-46 | 3.70e-01 | 0.1577 |
| 107075310 | MT-CO2 | GSM4909302 | Human | Breast | IDC | 1.35e-15 | 2.63e-01 | 0.1545 |
| 107075310 | MT-CO2 | GSM4909303 | Human | Breast | IDC | 1.99e-09 | 3.31e-01 | 0.0438 |
| 107075310 | MT-CO2 | GSM4909304 | Human | Breast | IDC | 5.97e-108 | 5.67e-01 | 0.1636 |
| 107075310 | MT-CO2 | GSM4909305 | Human | Breast | IDC | 4.13e-11 | 2.53e-01 | 0.0436 |
| 107075310 | MT-CO2 | GSM4909306 | Human | Breast | IDC | 1.19e-43 | 3.57e-01 | 0.1564 |
| Page: 1 2 3 4 5 6 7 8 9 10 11 12 13 14 15 16 17 18 19 20 21 22 23 |
| Tissue | Expression Dynamics | Abbreviation |
| Breast | 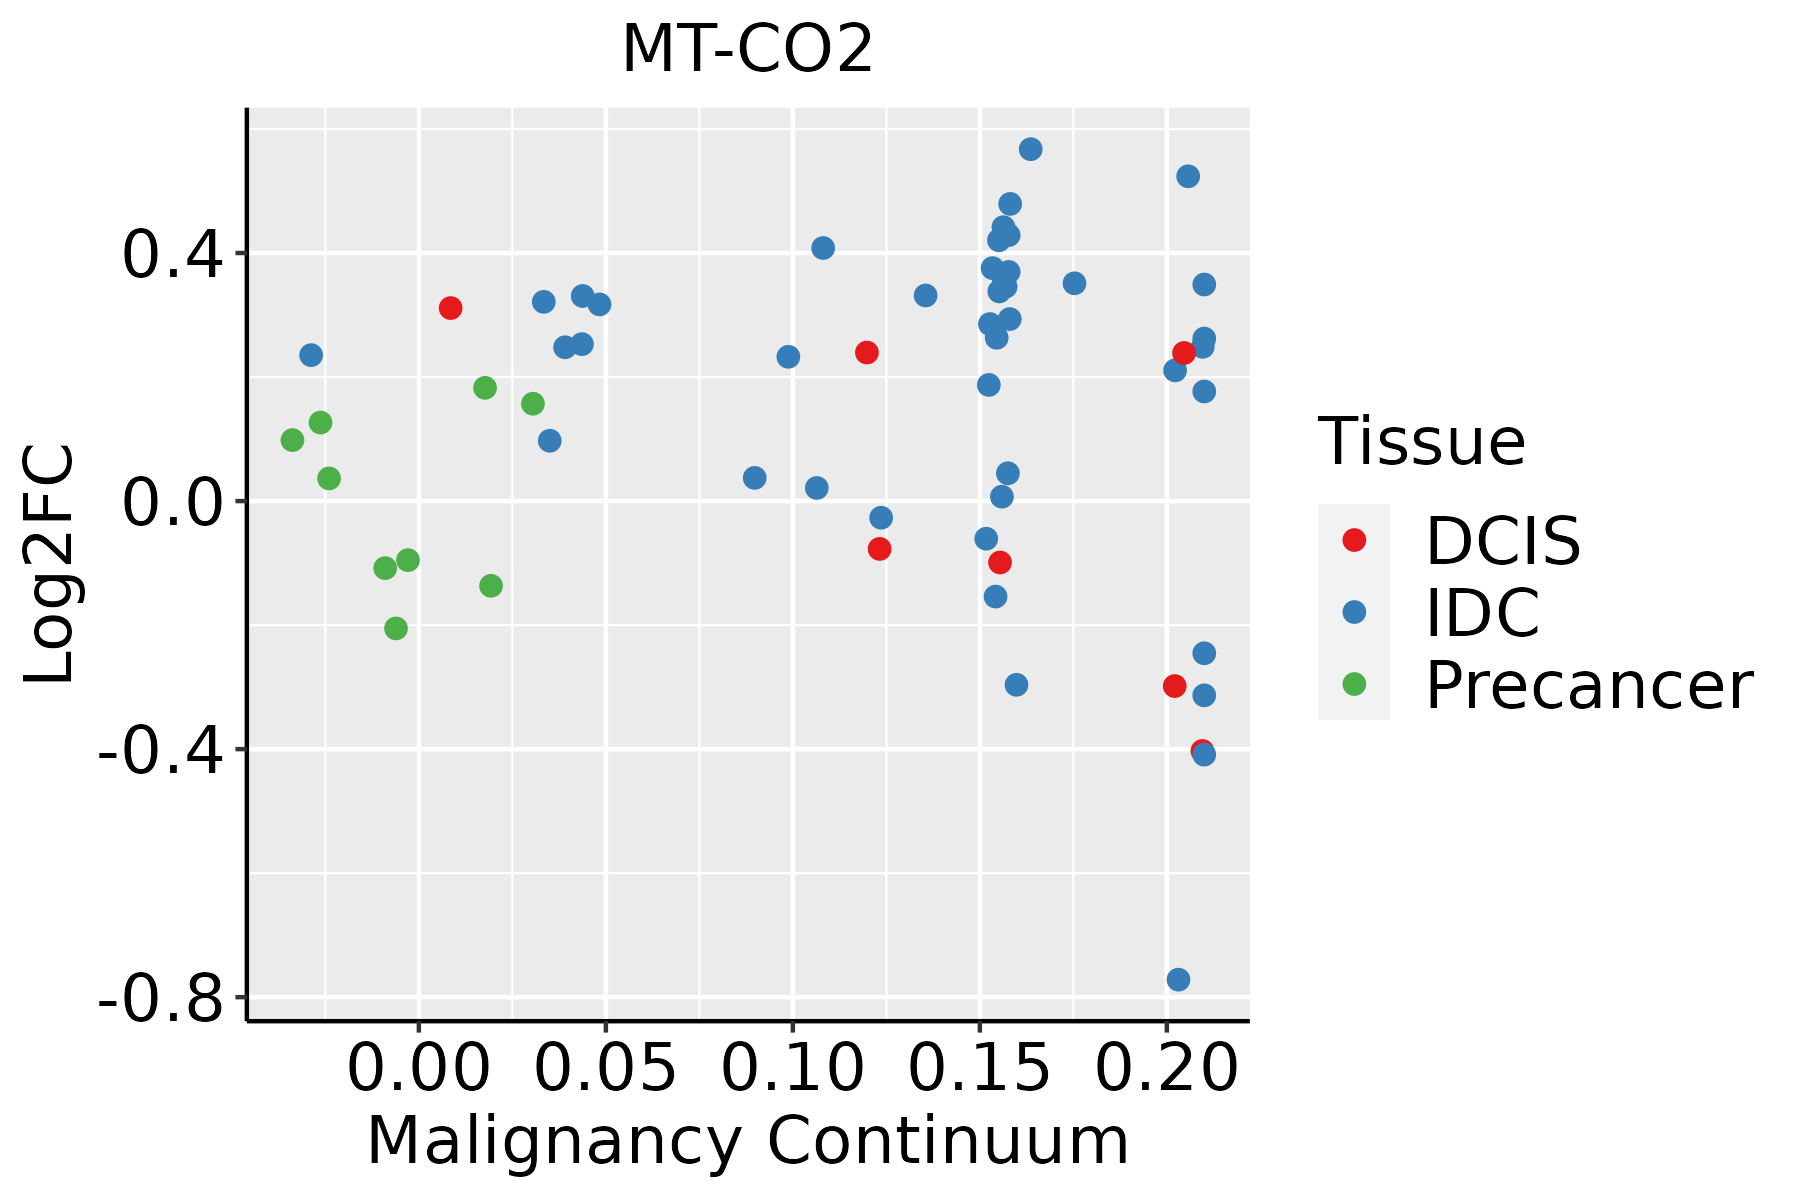 | IDC: Invasive ductal carcinoma |
| DCIS: Ductal carcinoma in situ | ||
| Precancer(BRCA1-mut): Precancerous lesion from BRCA1 mutation carriers | ||
| Cervix | 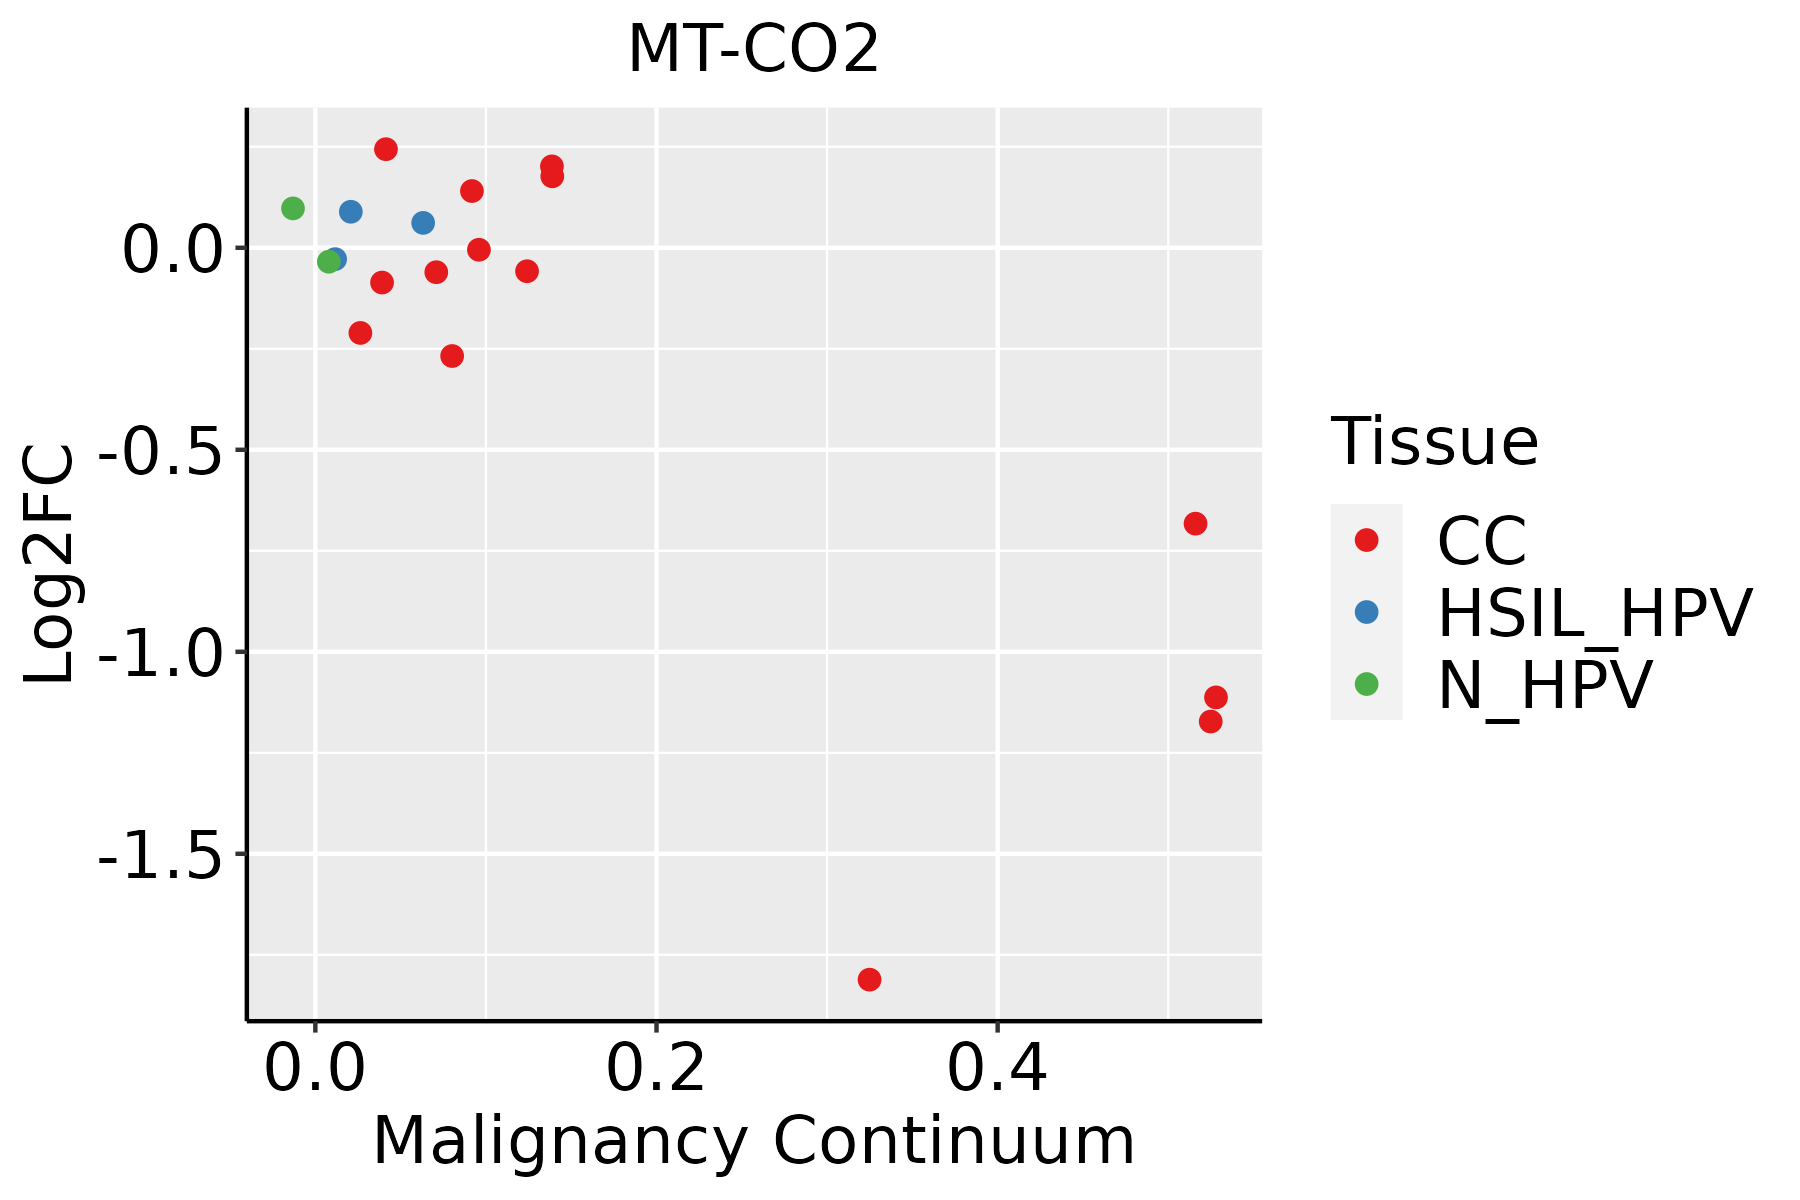 | CC: Cervix cancer |
| HSIL_HPV: HPV-infected high-grade squamous intraepithelial lesions | ||
| N_HPV: HPV-infected normal cervix | ||
| Colorectum (GSE201348) | 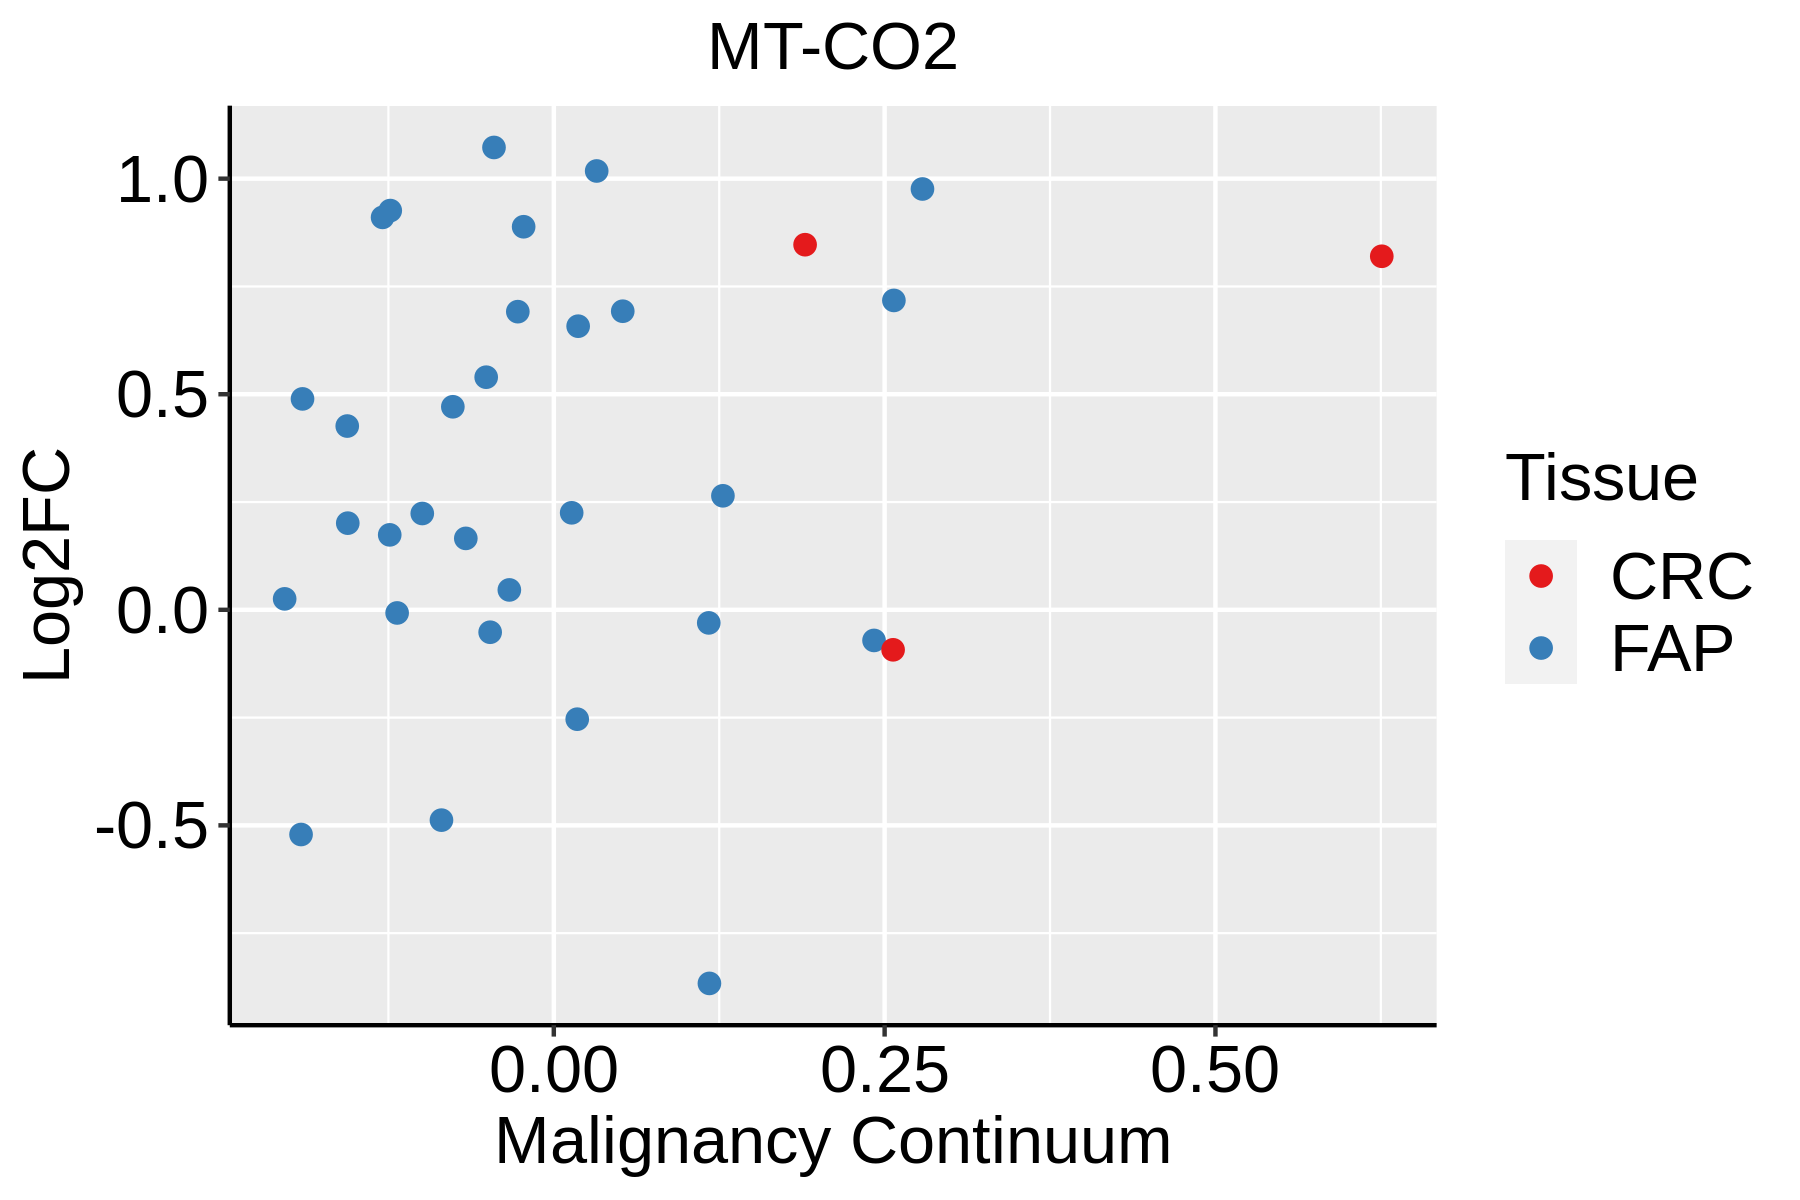 | FAP: Familial adenomatous polyposis |
| CRC: Colorectal cancer | ||
| Colorectum (HTA11) |  | AD: Adenomas |
| SER: Sessile serrated lesions | ||
| MSI-H: Microsatellite-high colorectal cancer | ||
| MSS: Microsatellite stable colorectal cancer | ||
| Endometrium | 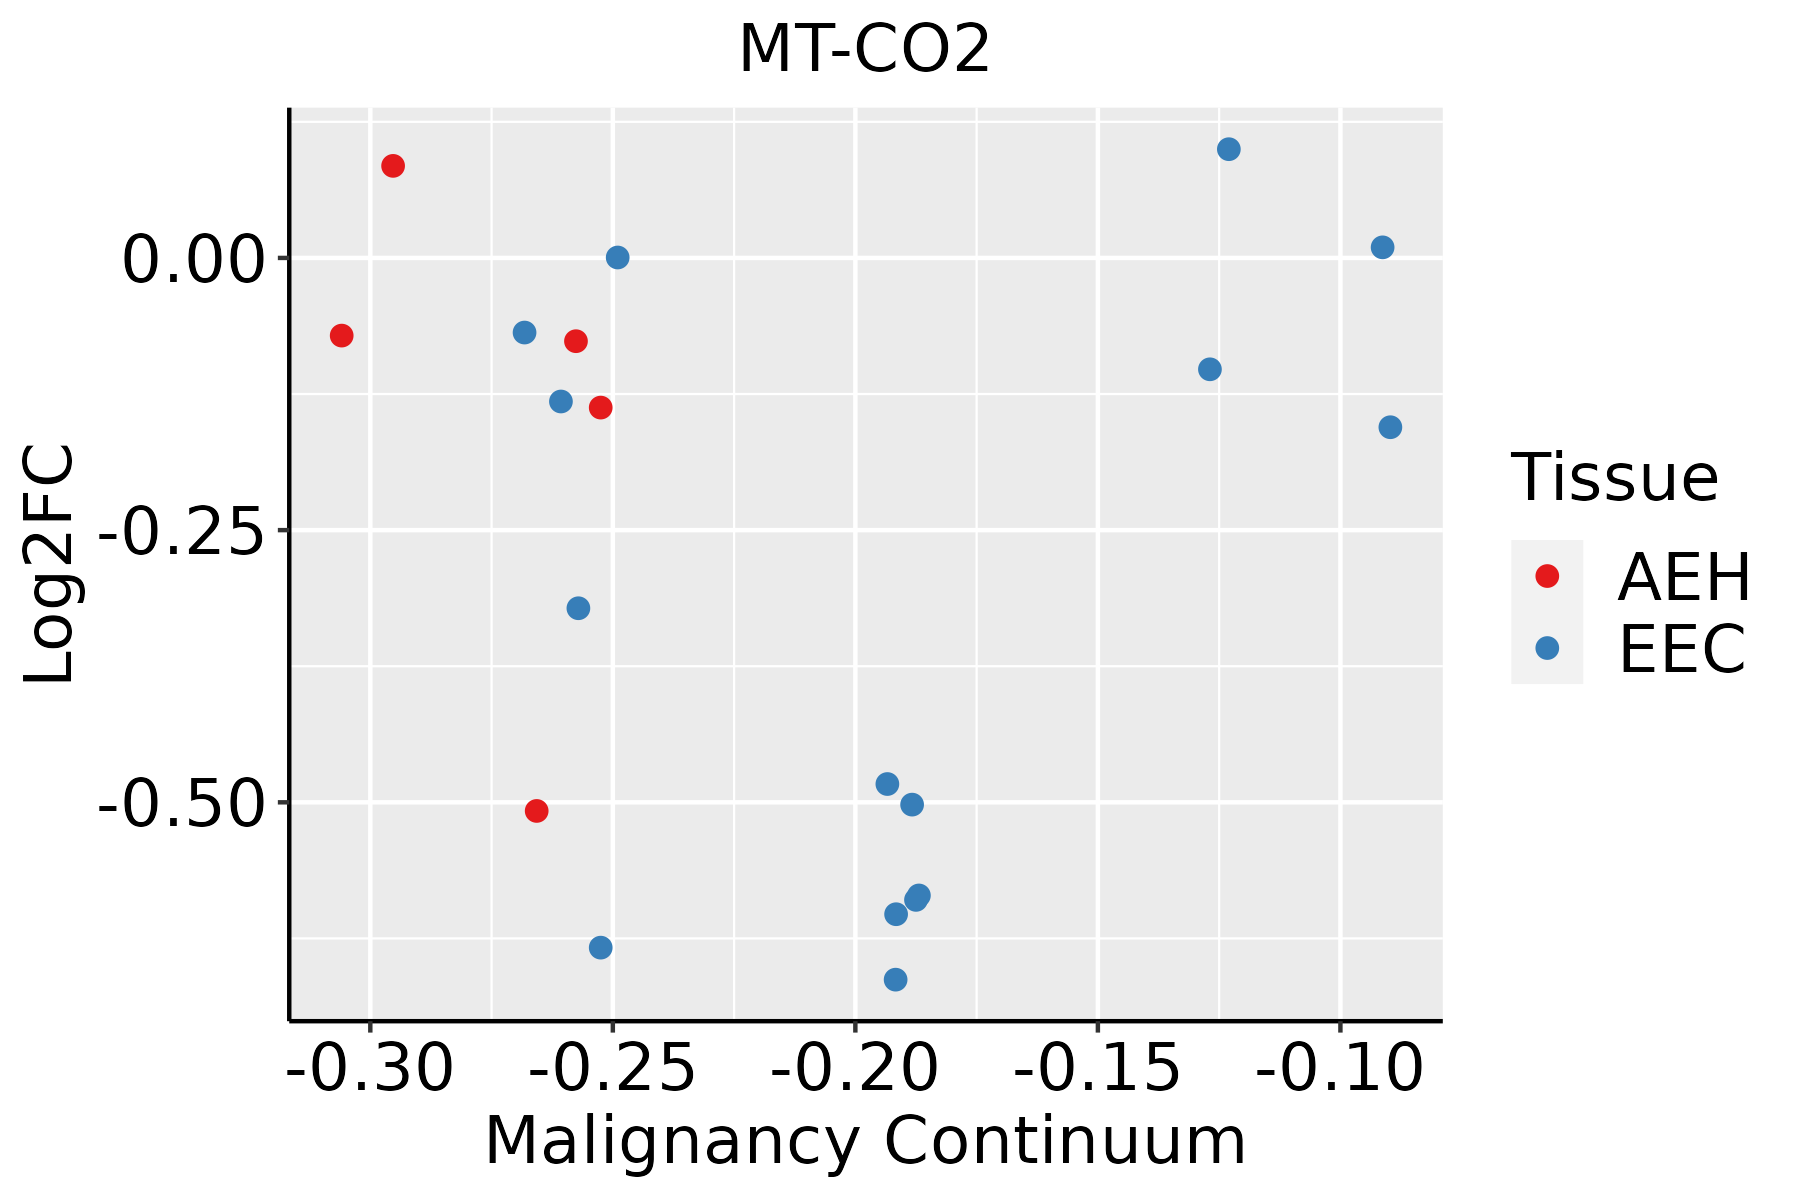 | AEH: Atypical endometrial hyperplasia |
| EEC: Endometrioid Cancer | ||
| Esophagus |  | ESCC: Esophageal squamous cell carcinoma |
| HGIN: High-grade intraepithelial neoplasias | ||
| LGIN: Low-grade intraepithelial neoplasias | ||
| GC | 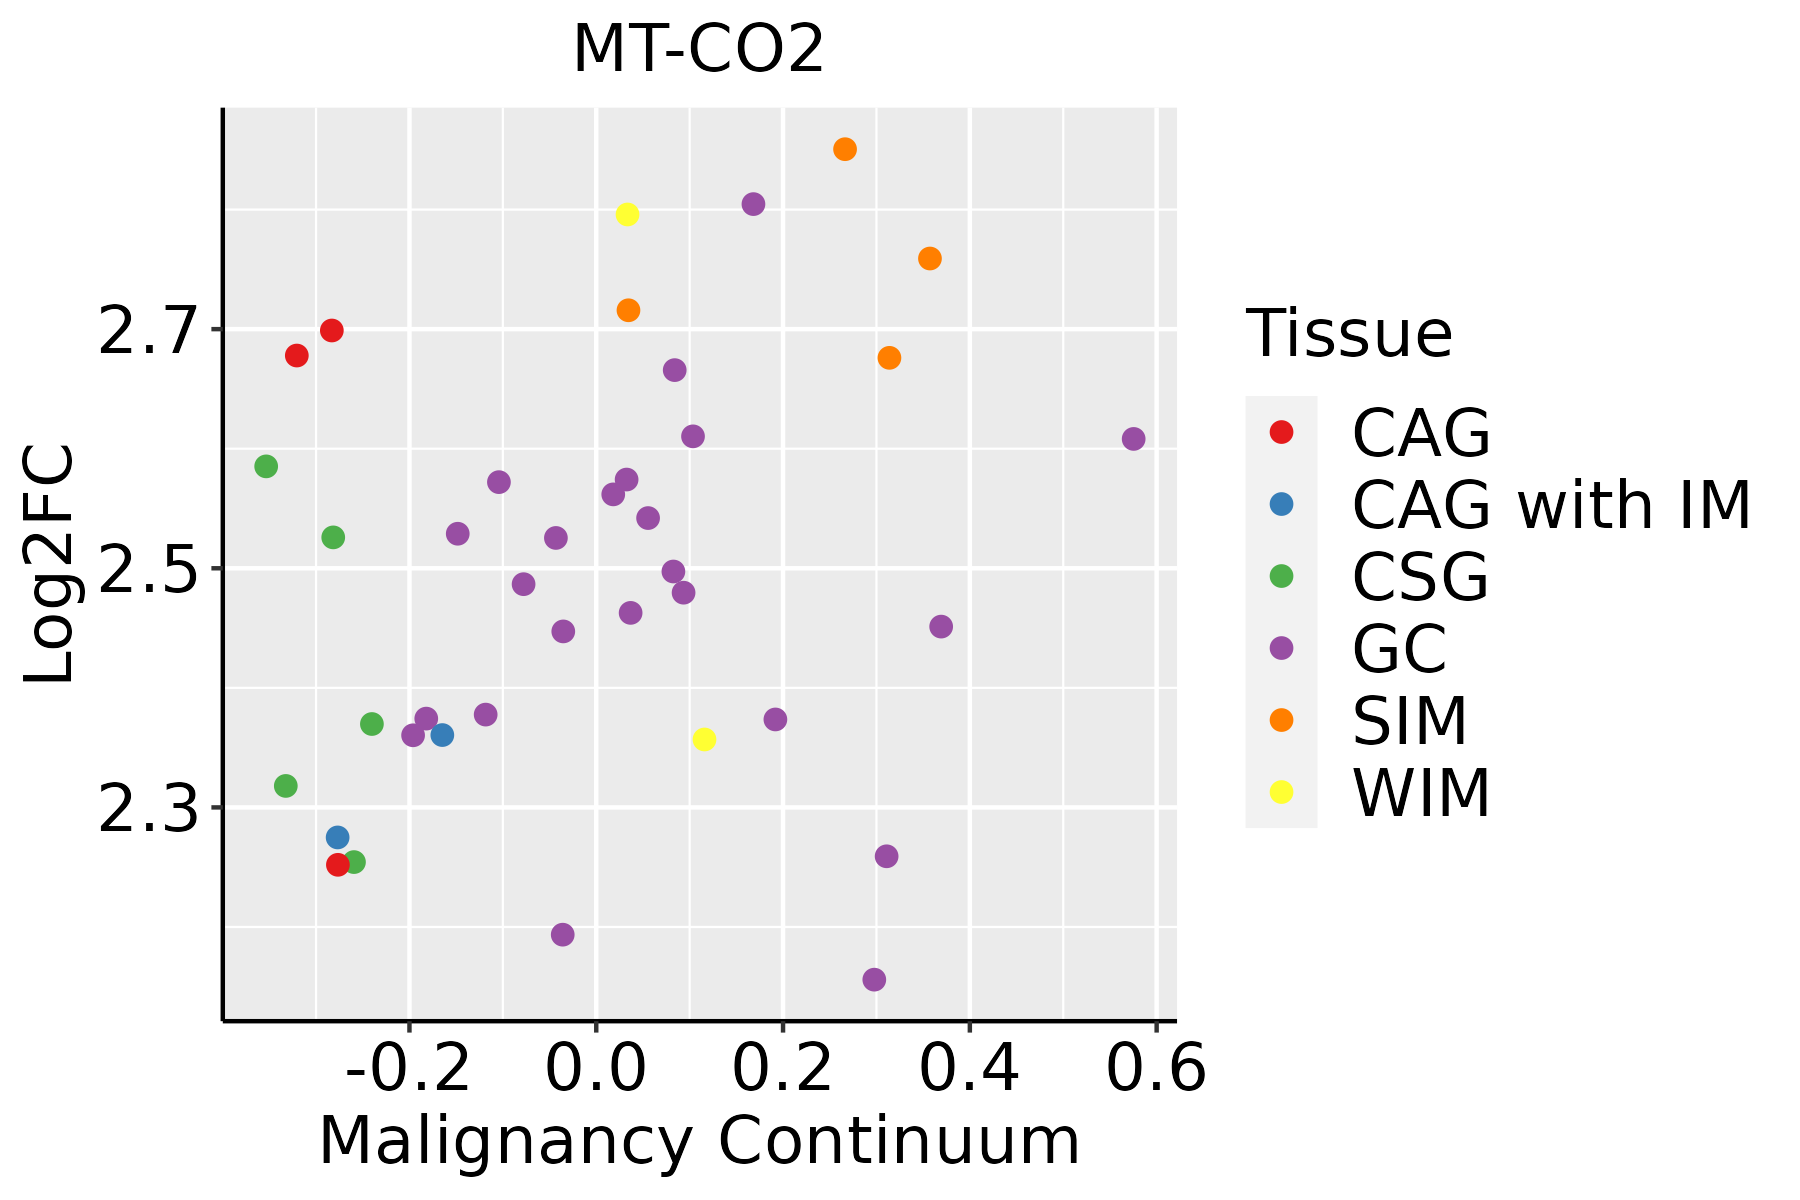 | CAG: Chronic atrophic gastritis |
| CAG with IM: Chronic atrophic gastritis with intestinal metaplasia | ||
| CSG: Chronic superficial gastritis | ||
| GC: Gastric cancer | ||
| SIM: Severe intestinal metaplasia | ||
| WIM: Wild intestinal metaplasia | ||
| Liver |  | HCC: Hepatocellular carcinoma |
| NAFLD: Non-alcoholic fatty liver disease | ||
| Lung | 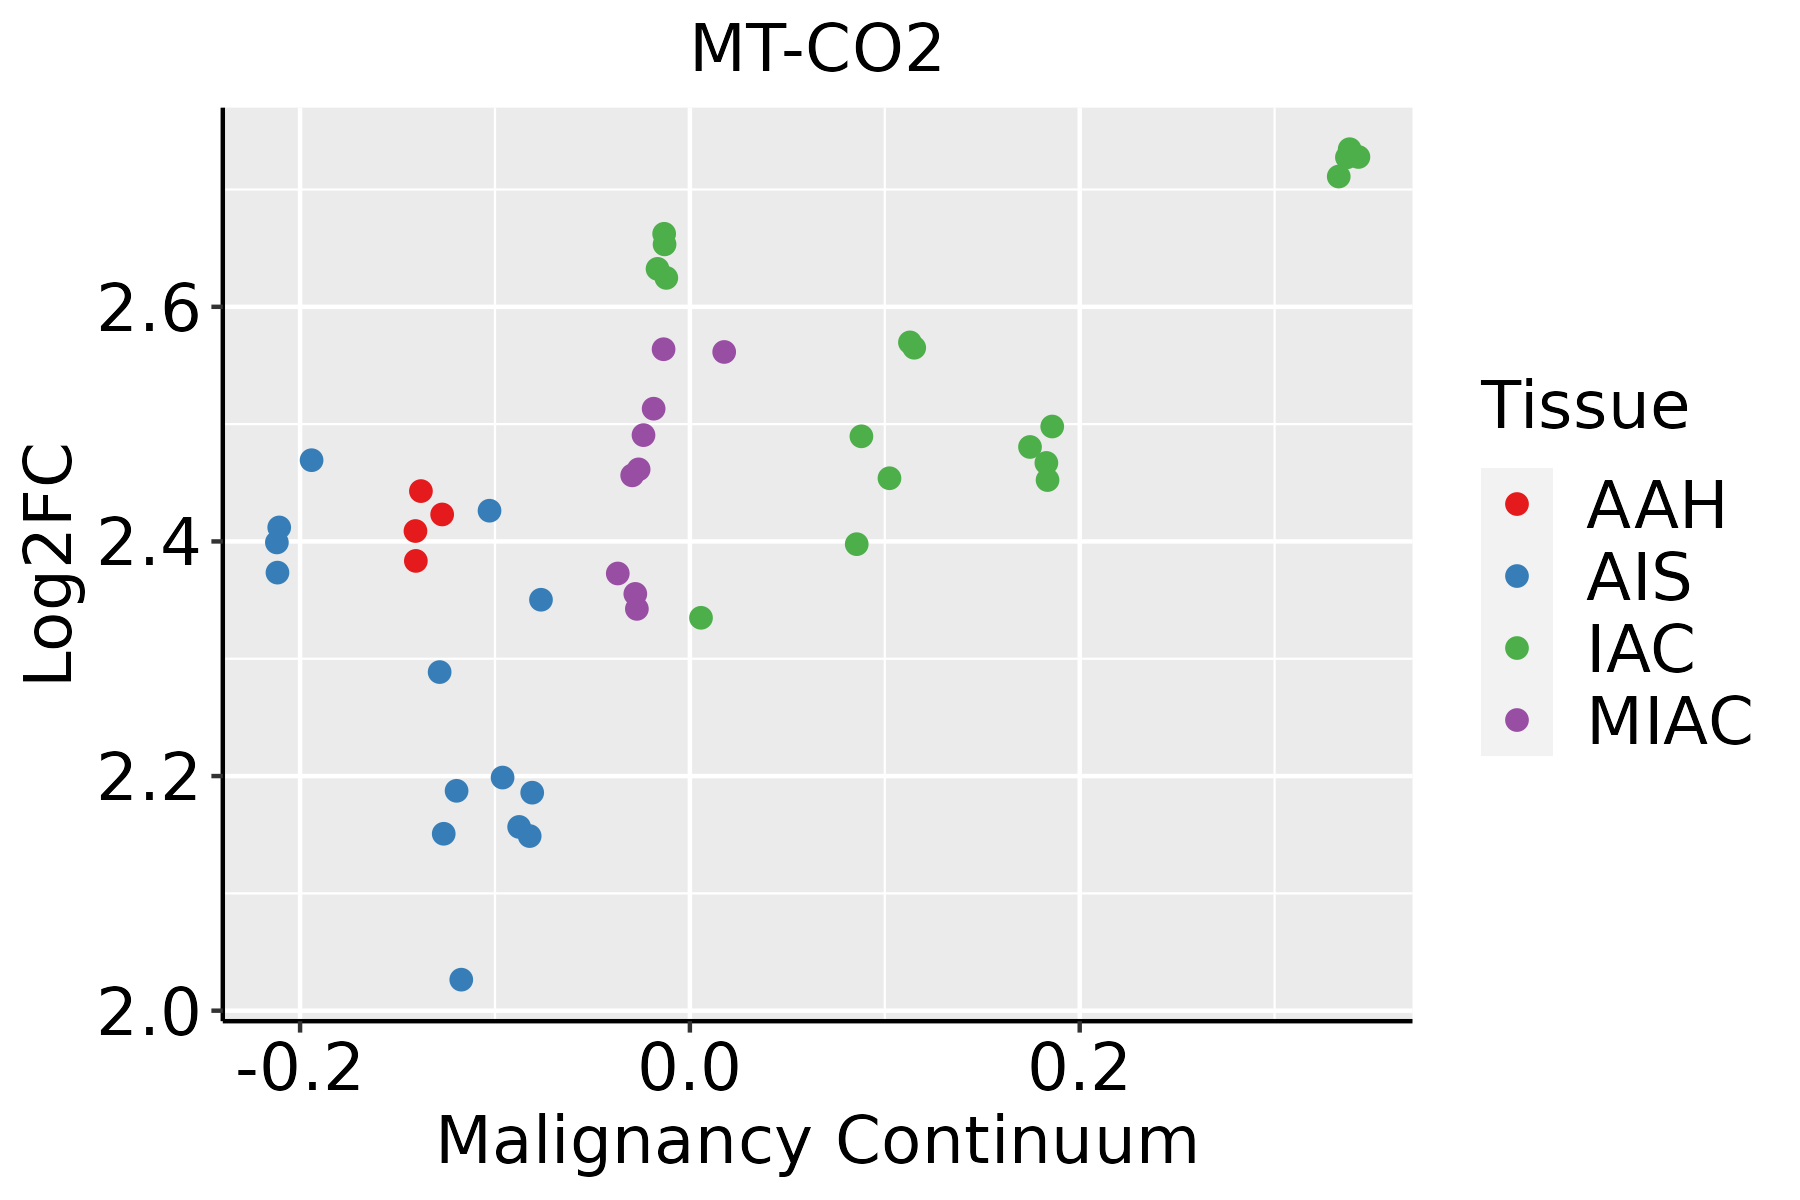 | AAH: Atypical adenomatous hyperplasia |
| AIS: Adenocarcinoma in situ | ||
| IAC: Invasive lung adenocarcinoma | ||
| MIA: Minimally invasive adenocarcinoma | ||
| Oral Cavity | 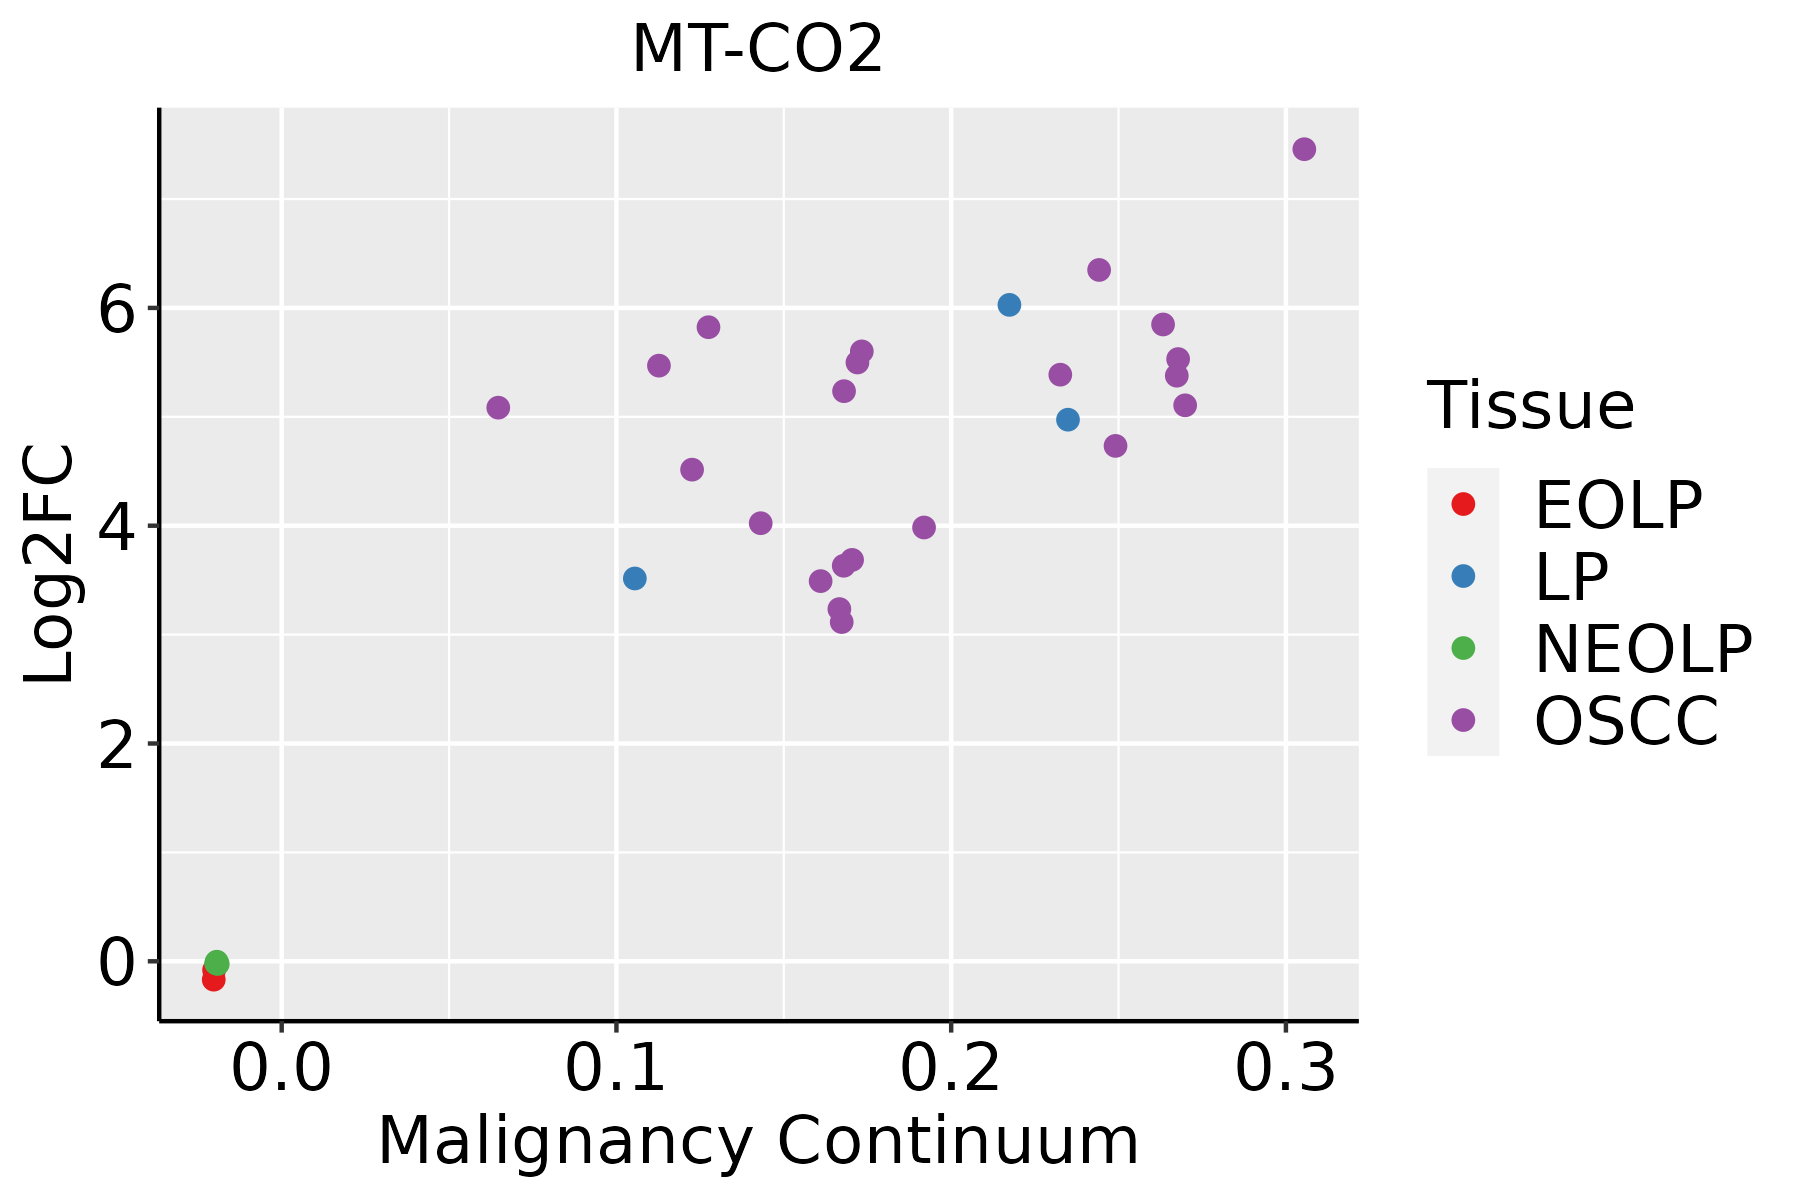 | EOLP: Erosive Oral lichen planus |
| LP: leukoplakia | ||
| NEOLP: Non-erosive oral lichen planus | ||
| OSCC: Oral squamous cell carcinoma | ||
| Prostate | 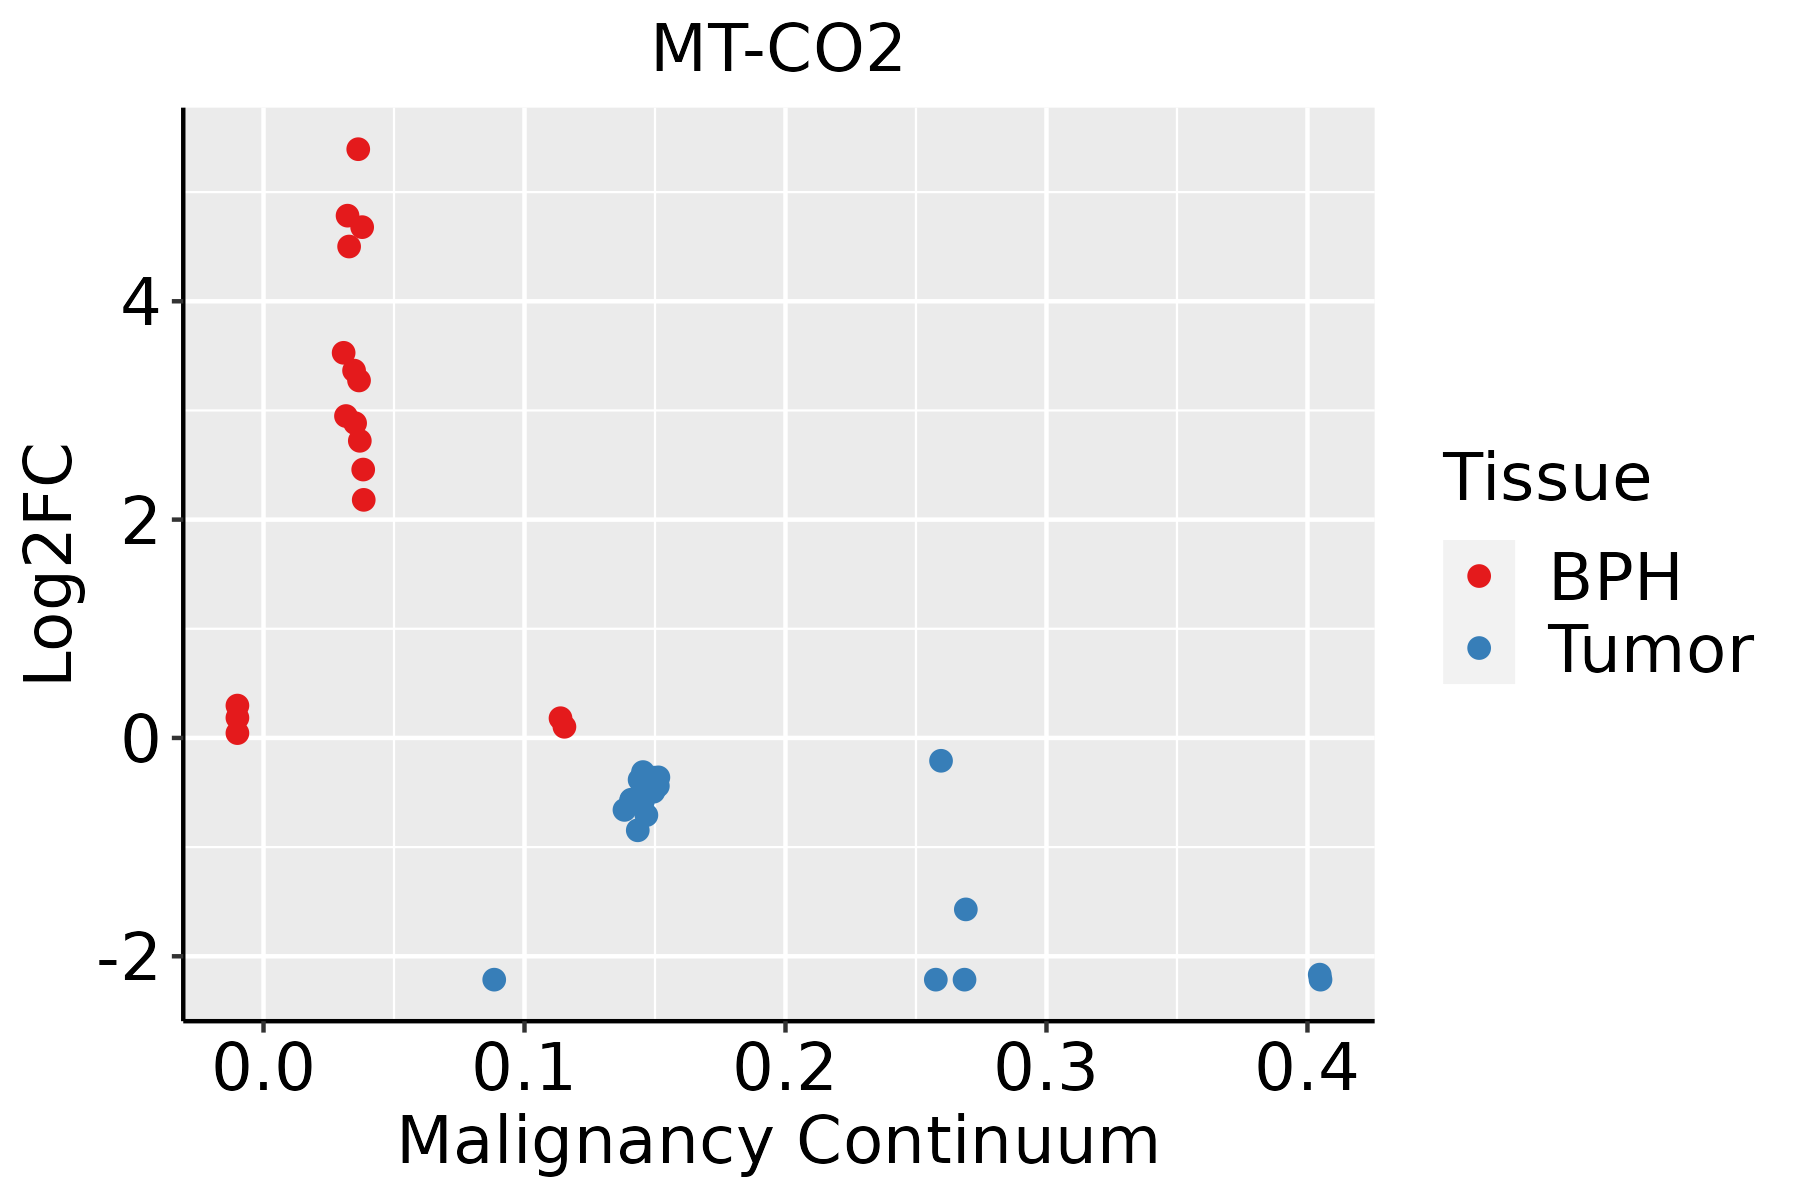 | BPH: Benign Prostatic Hyperplasia |
| Skin | 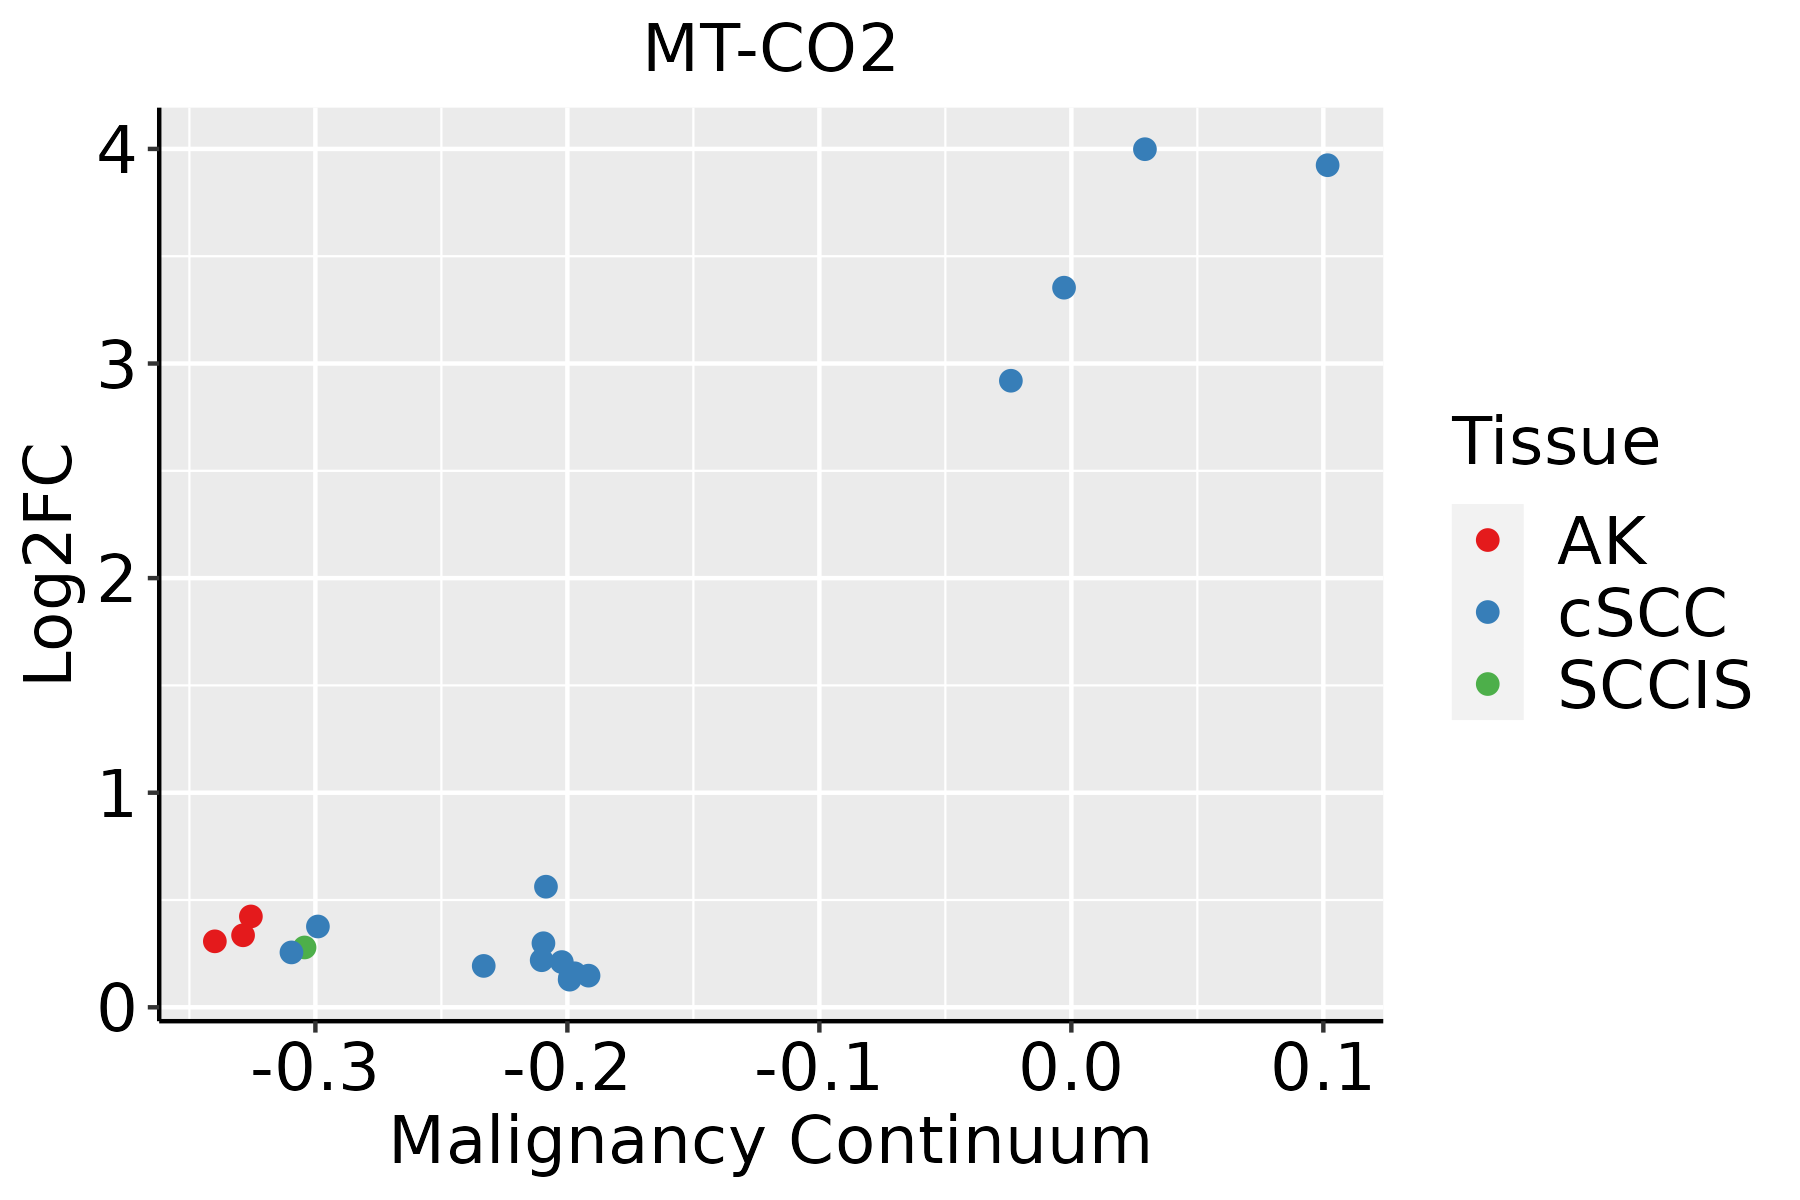 | AK: Actinic keratosis |
| cSCC: Cutaneous squamous cell carcinoma | ||
| SCCIS:squamous cell carcinoma in situ | ||
| Thyroid | 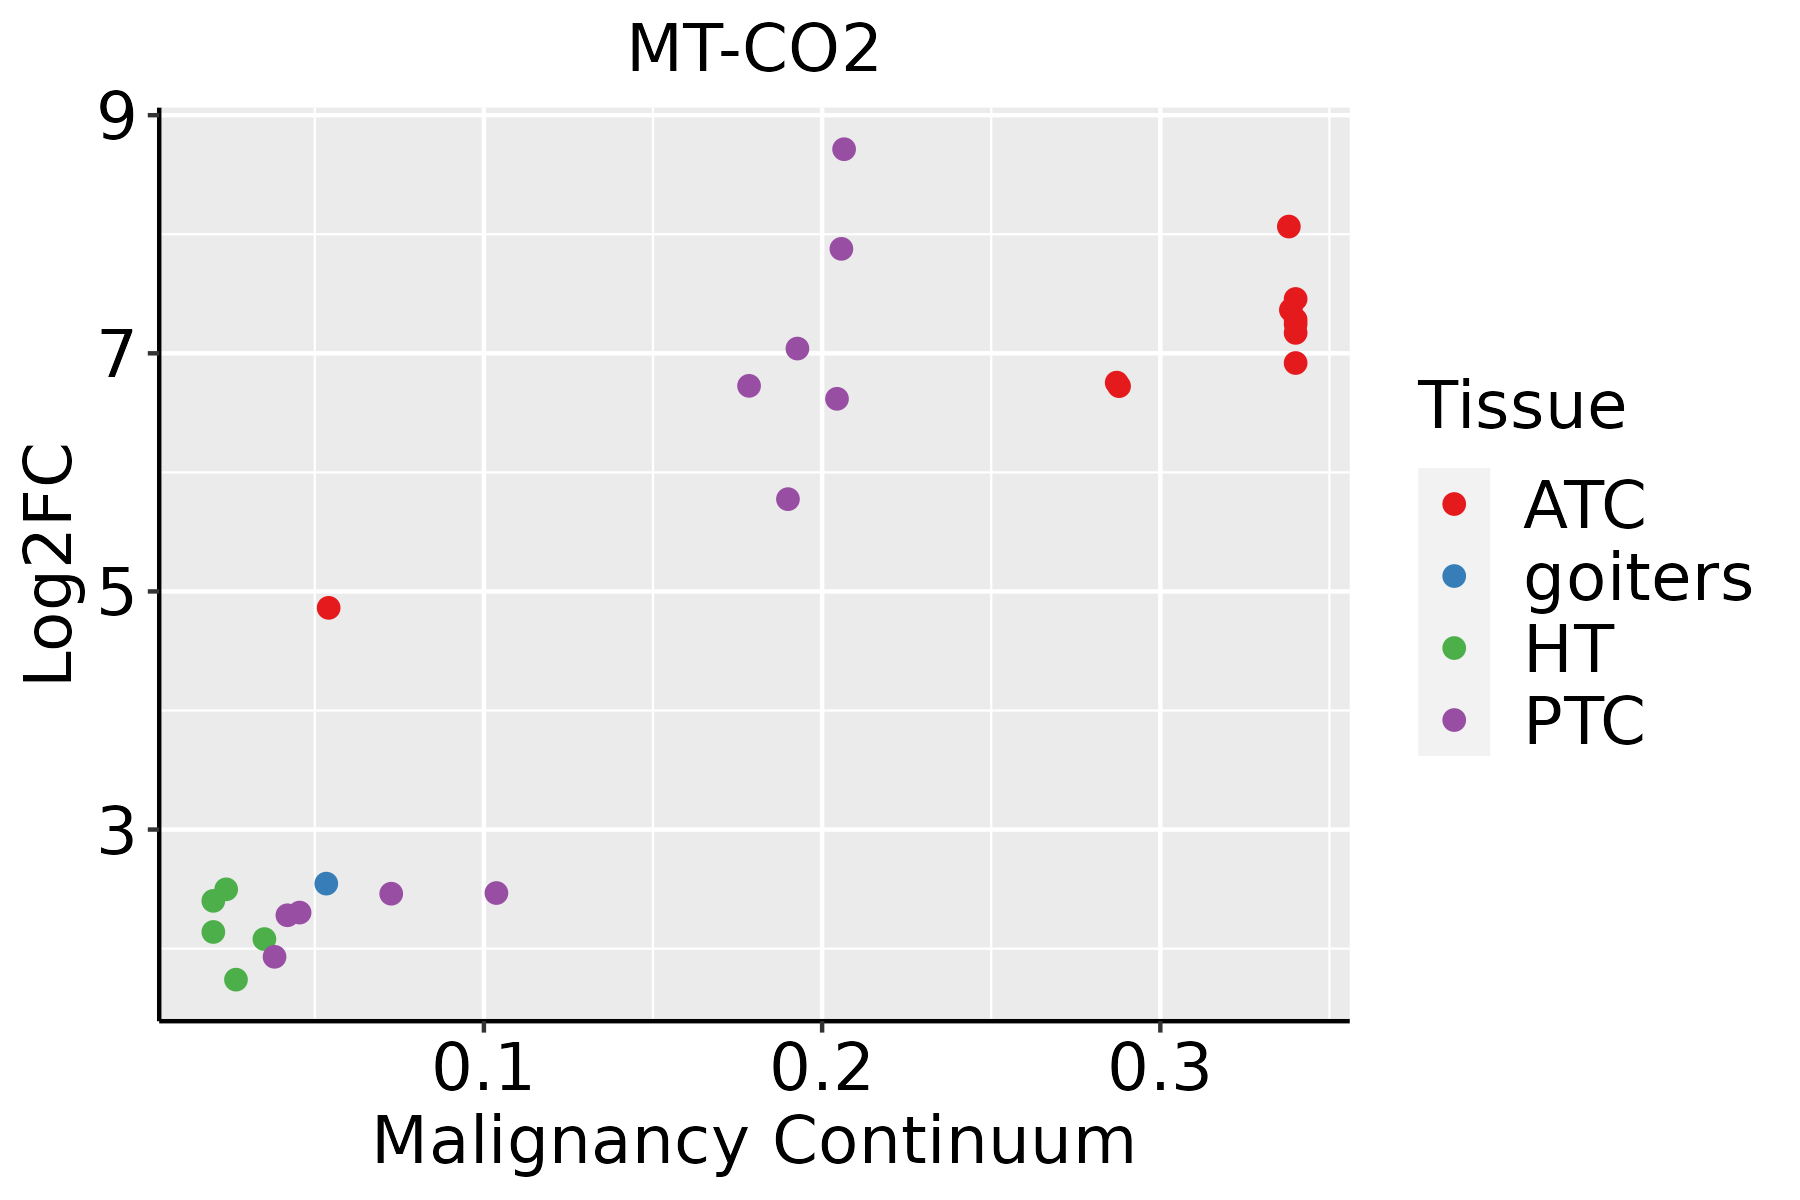 | ATC: Anaplastic thyroid cancer |
| HT: Hashimoto's thyroiditis | ||
| PTC: Papillary thyroid cancer |
| ∗log2FC in expression of this searched gene in stem-like cells from each diseased tissue sample relative to stem-like cells in normal samples in each tissue plotted against the malignancy continuum. Samples are colored based on if they are from different disease stage. |
Top |
Malignant transformation related pathway analysis |
| Find out the enriched GO biological processes and KEGG pathways involved in transition from healthy to precancer to cancer |
| Tissue | Disease Stage | Enriched GO biological Processes |
| Colorectum | AD |  |
| Colorectum | SER |  |
| Colorectum | MSS |  |
| Colorectum | MSI-H |  |
| Colorectum | FAP |  |
| ∗Top 15 enriched GO BP terms are showed in the bar plot of each disease state in each tissue. Each row represents a significant GO biological process which is colored according to the -log10(p.adjust). |
| Page: 1 2 3 4 5 6 7 8 9 |
| GO ID | Tissue | Disease Stage | Description | Gene Ratio | Bg Ratio | pvalue | p.adjust | Count |
| Page: 1 |
| Pathway ID | Tissue | Disease Stage | Description | Gene Ratio | Bg Ratio | pvalue | p.adjust | qvalue | Count |
| Page: 1 |
Top |
Cell-cell communication analysis |
| Identification of potential cell-cell interactions between two cell types and their ligand-receptor pairs for different disease states |
| Ligand | Receptor | LRpair | Pathway | Tissue | Disease Stage |
| Page: 1 |
Top |
Single-cell gene regulatory network inference analysis |
| Find out the significant the regulons (TFs) and the target genes of each regulon across cell types for different disease states |
| TF | Cell Type | Tissue | Disease Stage | Target Gene | RSS | Regulon Activity |
| ∗The dot plots of a searched regulon are shown for all cell subpopulations in each disease state of each tissue based on the regulon specific score inferred using pySCENIC and by calculating the average expression. |
| Page: 1 |
Top |
Somatic mutation of malignant transformation related genes |
| Annotation of somatic variants for genes involved in malignant transformation |
| Hugo Symbol | Variant Class | Variant Classification | dbSNP RS | HGVSc | HGVSp | HGVSp Short | SWISSPROT | BIOTYPE | SIFT | PolyPhen | Tumor Sample Barcode | Tissue | Histology | Sex | Age | Stage | Therapy Types | Drugs | Outcome |
| MT-CO2 | SNV | Missense_Mutation | novel | c.392G>A | p.Gly131Asp | p.G131D | P00403 | protein_coding | deleterious_low_confidence(0) | probably_damaging(1) | TCGA-A2-A259-01 | Breast | breast invasive carcinoma | Female | >=65 | I/II | Hormone Therapy | arimidex | SD |
| MT-CO2 | SNV | Missense_Mutation | novel | c.506G>A | p.Gly169Asp | p.G169D | P00403 | protein_coding | deleterious_low_confidence(0) | benign(0.045) | TCGA-A2-A25F-01 | Breast | breast invasive carcinoma | Female | >=65 | I/II | Chemotherapy | taxotere | SD |
| MT-CO2 | SNV | Missense_Mutation | novel | c.506G>A | p.Gly169Asp | p.G169D | P00403 | protein_coding | deleterious_low_confidence(0) | benign(0.045) | TCGA-A2-A4RX-01 | Breast | breast invasive carcinoma | Female | >=65 | I/II | Unknown | Unknown | SD |
| MT-CO2 | SNV | Missense_Mutation | novel | c.587N>A | p.Cys196Tyr | p.C196Y | P00403 | protein_coding | deleterious_low_confidence(0) | probably_damaging(0.999) | TCGA-A7-A26H-01 | Breast | breast invasive carcinoma | Female | >=65 | I/II | Hormone Therapy | anastrozole | PD |
| MT-CO2 | SNV | Missense_Mutation | novel | c.394N>A | p.Asp132Asn | p.D132N | P00403 | protein_coding | deleterious_low_confidence(0.01) | probably_damaging(0.998) | TCGA-A7-A26J-01 | Breast | breast invasive carcinoma | Female | <65 | I/II | Hormone Therapy | tamoxiphen | SD |
| MT-CO2 | SNV | Missense_Mutation | novel | c.110N>C | p.Leu37Pro | p.L37P | P00403 | protein_coding | deleterious_low_confidence(0) | probably_damaging(0.999) | TCGA-A7-A426-01 | Breast | breast invasive carcinoma | Female | <65 | III/IV | Chemotherapy | adriamycin | SD |
| MT-CO2 | SNV | Missense_Mutation | novel | c.439N>A | p.Glu147Lys | p.E147K | P00403 | protein_coding | deleterious_low_confidence(0.02) | benign(0.006) | TCGA-A7-A6VW-01 | Breast | breast invasive carcinoma | Female | <65 | I/II | Chemotherapy | doxorubicin | CR |
| MT-CO2 | SNV | Missense_Mutation | novel | c.475G>A | p.Val159Ile | p.V159I | P00403 | protein_coding | deleterious_low_confidence(0) | probably_damaging(0.975) | TCGA-A8-A081-01 | Breast | breast invasive carcinoma | Female | >=65 | I/II | Unknown | Unknown | SD |
| MT-CO2 | SNV | Missense_Mutation | novel | c.662N>C | p.Met221Thr | p.M221T | P00403 | protein_coding | tolerated_low_confidence(0.87) | possibly_damaging(0.882) | TCGA-AC-A5EH-01 | Breast | breast invasive carcinoma | Female | >=65 | I/II | Unknown | Unknown | SD |
| MT-CO2 | SNV | Missense_Mutation | novel | c.110N>C | p.Leu37Pro | p.L37P | P00403 | protein_coding | deleterious_low_confidence(0) | probably_damaging(0.999) | TCGA-AO-A1KR-01 | Breast | breast invasive carcinoma | Female | <65 | I/II | Chemotherapy | cyclophosphamide | SD |
| Page: 1 2 3 4 5 6 7 8 9 10 11 |
Top |
Related drugs of malignant transformation related genes |
| Identification of chemicals and drugs interact with genes involved in malignant transfromation |
| (DGIdb 4.0) |
| Entrez ID | Symbol | Category | Interaction Types | Drug Claim Name | Drug Name | PMIDs |
| Page: 1 |

Copyright 2023-Present -The University of Texas Health Science Center at Houston |