
|
|||||
|
 | |
| |
| |
| |
| |
| |
|
Gene: MSTO1 |
Gene summary for MSTO1 |
| Gene information | Species | Human | Gene symbol | MSTO1 | Gene ID | 55154 |
| Gene name | misato mitochondrial distribution and morphology regulator 1 | |
| Gene Alias | LST005 | |
| Cytomap | 1q22 | |
| Gene Type | protein-coding | GO ID | GO:0006996 | UniProtAcc | Q9BUK6 |
Top |
Malignant transformation analysis |
| Identification of the aberrant gene expression in precancerous and cancerous lesions by comparing the gene expression of stem-like cells in diseased tissues with normal stem cells |
| Entrez ID | Symbol | Replicates | Species | Organ | Tissue | Adj P-value | Log2FC | Malignancy |
| 55154 | MSTO1 | LZE2T | Human | Esophagus | ESCC | 1.14e-02 | 4.48e-01 | 0.082 |
| 55154 | MSTO1 | LZE7T | Human | Esophagus | ESCC | 2.40e-07 | 3.33e-01 | 0.0667 |
| 55154 | MSTO1 | LZE22T | Human | Esophagus | ESCC | 3.60e-02 | 2.05e-01 | 0.068 |
| 55154 | MSTO1 | LZE24T | Human | Esophagus | ESCC | 2.04e-06 | 1.88e-01 | 0.0596 |
| 55154 | MSTO1 | P2T-E | Human | Esophagus | ESCC | 1.22e-19 | 3.33e-01 | 0.1177 |
| 55154 | MSTO1 | P4T-E | Human | Esophagus | ESCC | 8.02e-08 | 2.37e-01 | 0.1323 |
| 55154 | MSTO1 | P5T-E | Human | Esophagus | ESCC | 3.31e-13 | 3.36e-01 | 0.1327 |
| 55154 | MSTO1 | P8T-E | Human | Esophagus | ESCC | 2.91e-05 | 1.20e-01 | 0.0889 |
| 55154 | MSTO1 | P9T-E | Human | Esophagus | ESCC | 1.11e-04 | 1.58e-01 | 0.1131 |
| 55154 | MSTO1 | P10T-E | Human | Esophagus | ESCC | 9.04e-12 | 2.93e-01 | 0.116 |
| 55154 | MSTO1 | P11T-E | Human | Esophagus | ESCC | 6.40e-09 | 2.63e-01 | 0.1426 |
| 55154 | MSTO1 | P12T-E | Human | Esophagus | ESCC | 3.64e-04 | 1.32e-01 | 0.1122 |
| 55154 | MSTO1 | P15T-E | Human | Esophagus | ESCC | 9.99e-09 | 2.24e-01 | 0.1149 |
| 55154 | MSTO1 | P16T-E | Human | Esophagus | ESCC | 3.06e-15 | 3.60e-01 | 0.1153 |
| 55154 | MSTO1 | P17T-E | Human | Esophagus | ESCC | 2.40e-04 | 2.67e-01 | 0.1278 |
| 55154 | MSTO1 | P20T-E | Human | Esophagus | ESCC | 9.92e-05 | 1.54e-01 | 0.1124 |
| 55154 | MSTO1 | P21T-E | Human | Esophagus | ESCC | 1.23e-22 | 4.44e-01 | 0.1617 |
| 55154 | MSTO1 | P22T-E | Human | Esophagus | ESCC | 1.63e-10 | 2.24e-01 | 0.1236 |
| 55154 | MSTO1 | P23T-E | Human | Esophagus | ESCC | 5.39e-09 | 2.86e-01 | 0.108 |
| 55154 | MSTO1 | P24T-E | Human | Esophagus | ESCC | 1.67e-10 | 2.85e-01 | 0.1287 |
| Page: 1 2 3 4 |
| Tissue | Expression Dynamics | Abbreviation |
| Esophagus |  | ESCC: Esophageal squamous cell carcinoma |
| HGIN: High-grade intraepithelial neoplasias | ||
| LGIN: Low-grade intraepithelial neoplasias | ||
| Liver | 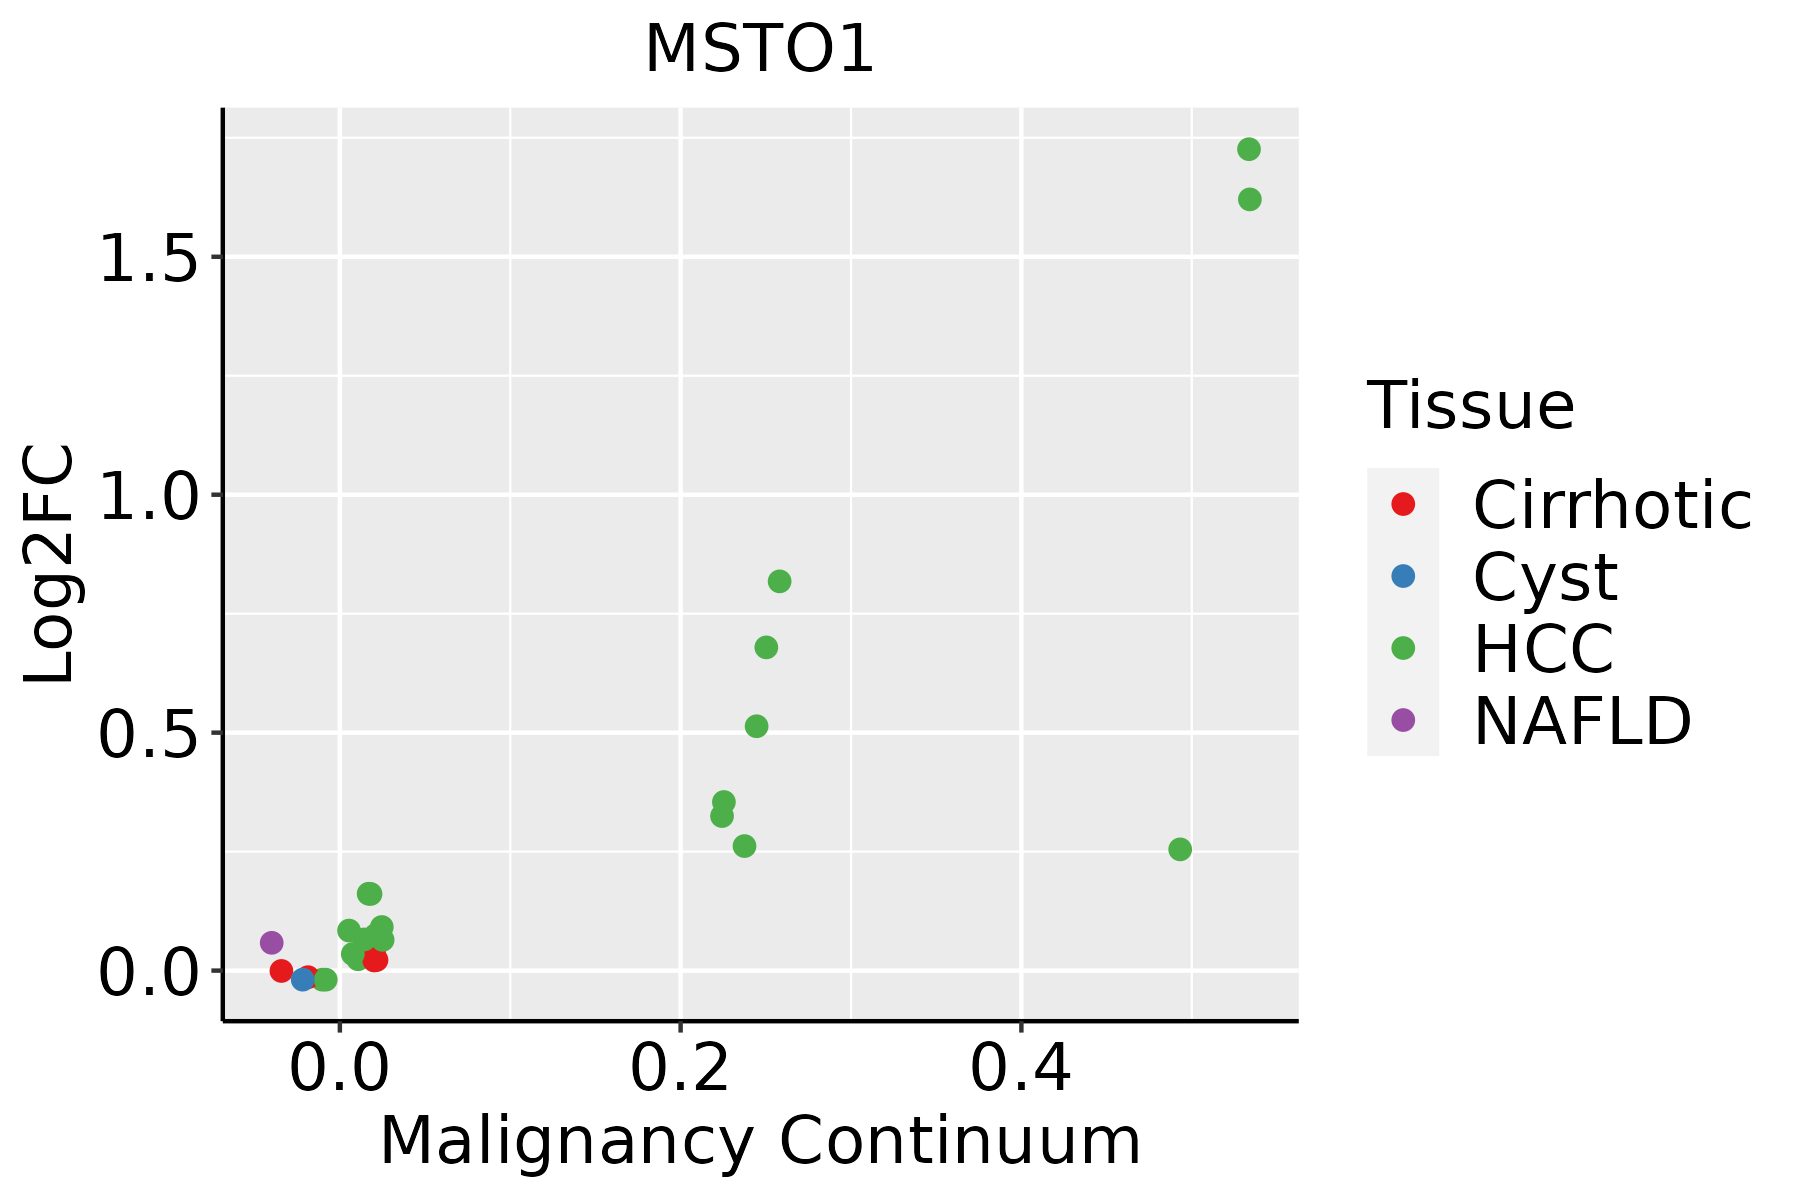 | HCC: Hepatocellular carcinoma |
| NAFLD: Non-alcoholic fatty liver disease | ||
| Oral Cavity | 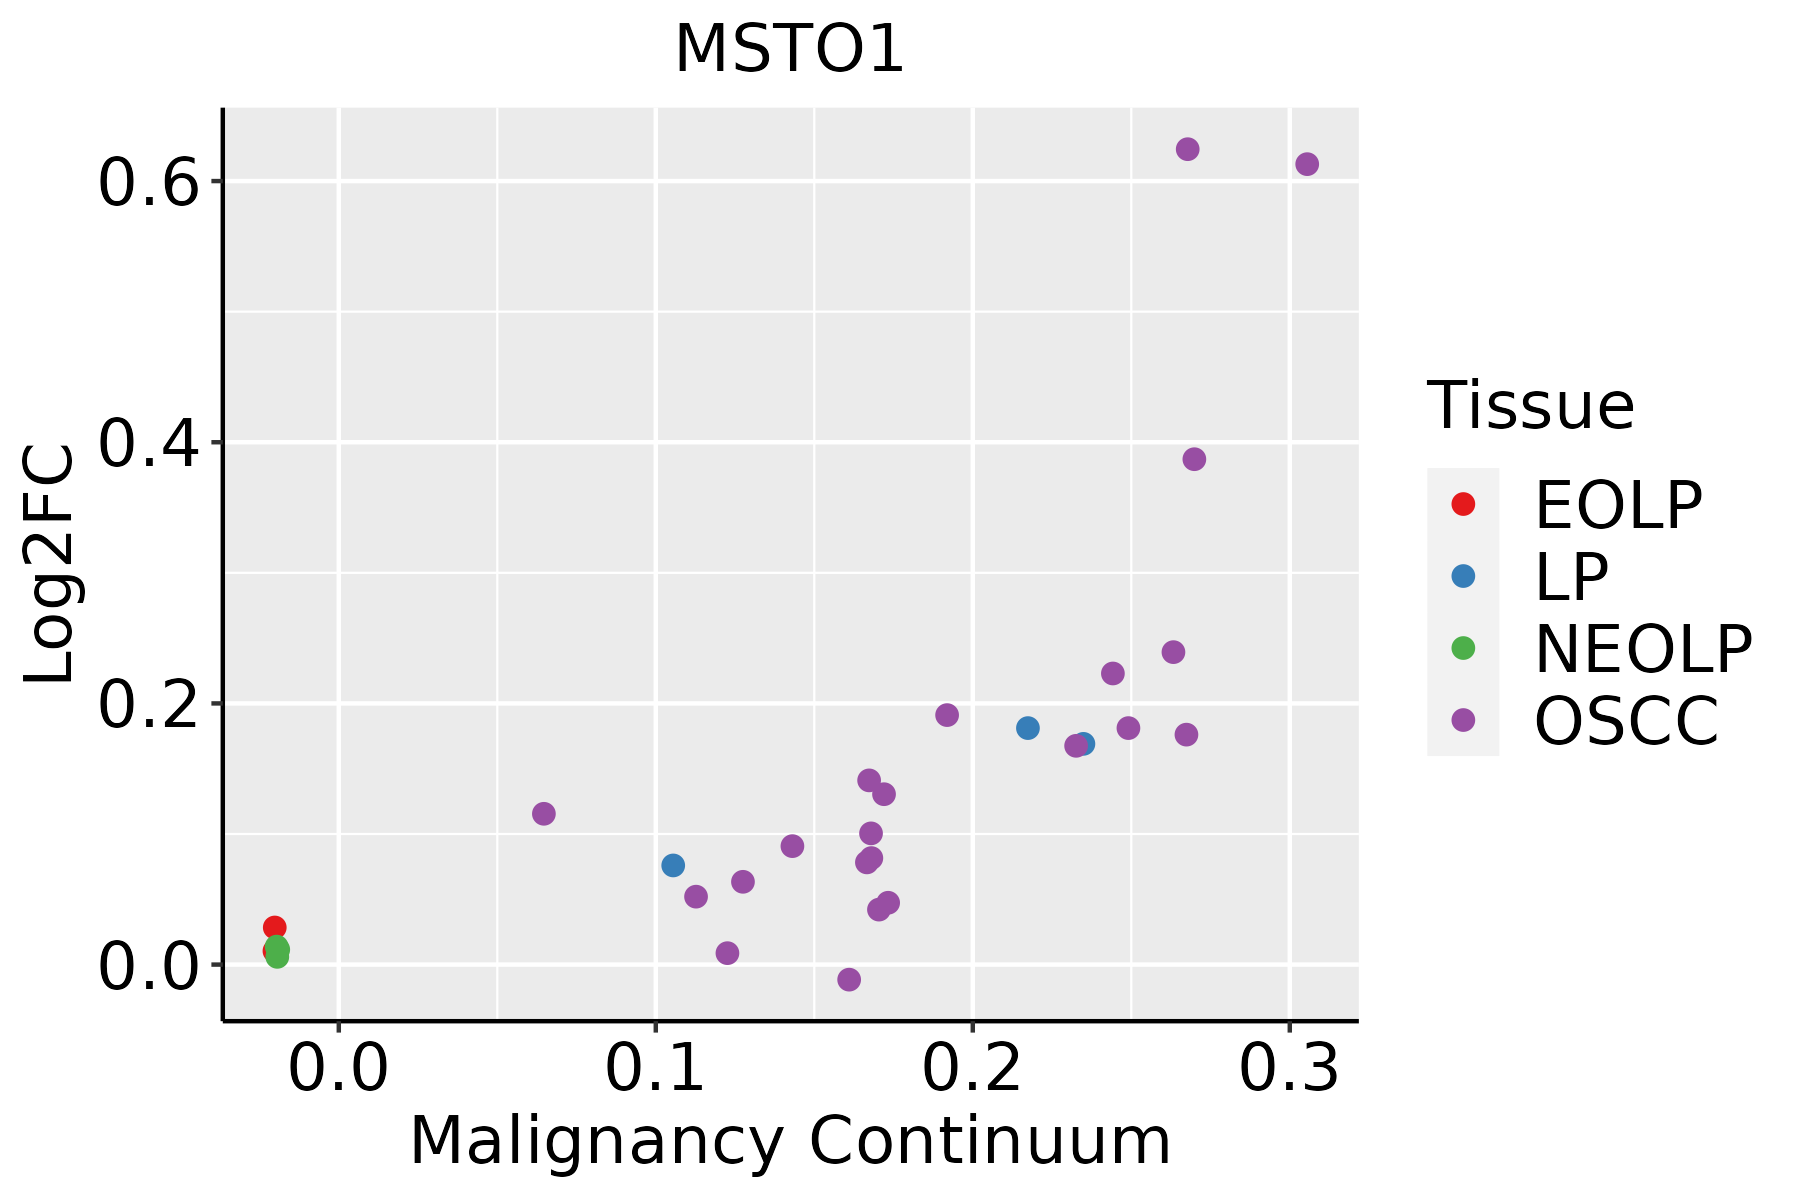 | EOLP: Erosive Oral lichen planus |
| LP: leukoplakia | ||
| NEOLP: Non-erosive oral lichen planus | ||
| OSCC: Oral squamous cell carcinoma |
| ∗log2FC in expression of this searched gene in stem-like cells from each diseased tissue sample relative to stem-like cells in normal samples in each tissue plotted against the malignancy continuum. Samples are colored based on if they are from different disease stage. |
Top |
Malignant transformation related pathway analysis |
| Find out the enriched GO biological processes and KEGG pathways involved in transition from healthy to precancer to cancer |
| Tissue | Disease Stage | Enriched GO biological Processes |
| Colorectum | AD |  |
| Colorectum | SER |  |
| Colorectum | MSS |  |
| Colorectum | MSI-H |  |
| Colorectum | FAP |  |
| ∗Top 15 enriched GO BP terms are showed in the bar plot of each disease state in each tissue. Each row represents a significant GO biological process which is colored according to the -log10(p.adjust). |
| Page: 1 2 3 4 5 6 7 8 9 |
| GO ID | Tissue | Disease Stage | Description | Gene Ratio | Bg Ratio | pvalue | p.adjust | Count |
| GO:00516463 | Esophagus | ESCC | mitochondrion localization | 35/8552 | 50/18723 | 4.33e-04 | 2.44e-03 | 35 |
| GO:0051646 | Liver | HCC | mitochondrion localization | 34/7958 | 50/18723 | 2.38e-04 | 1.79e-03 | 34 |
| GO:0048311 | Liver | HCC | mitochondrion distribution | 12/7958 | 16/18723 | 8.74e-03 | 3.40e-02 | 12 |
| GO:00516462 | Oral cavity | OSCC | mitochondrion localization | 28/7305 | 50/18723 | 1.10e-02 | 3.72e-02 | 28 |
| Page: 1 |
| Pathway ID | Tissue | Disease Stage | Description | Gene Ratio | Bg Ratio | pvalue | p.adjust | qvalue | Count |
| Page: 1 |
Top |
Cell-cell communication analysis |
| Identification of potential cell-cell interactions between two cell types and their ligand-receptor pairs for different disease states |
| Ligand | Receptor | LRpair | Pathway | Tissue | Disease Stage |
| Page: 1 |
Top |
Single-cell gene regulatory network inference analysis |
| Find out the significant the regulons (TFs) and the target genes of each regulon across cell types for different disease states |
| TF | Cell Type | Tissue | Disease Stage | Target Gene | RSS | Regulon Activity |
| ∗The dot plots of a searched regulon are shown for all cell subpopulations in each disease state of each tissue based on the regulon specific score inferred using pySCENIC and by calculating the average expression. |
| Page: 1 |
Top |
Somatic mutation of malignant transformation related genes |
| Annotation of somatic variants for genes involved in malignant transformation |
| Hugo Symbol | Variant Class | Variant Classification | dbSNP RS | HGVSc | HGVSp | HGVSp Short | SWISSPROT | BIOTYPE | SIFT | PolyPhen | Tumor Sample Barcode | Tissue | Histology | Sex | Age | Stage | Therapy Types | Drugs | Outcome |
| MSTO1 | SNV | Missense_Mutation | rs753488873 | c.706G>A | p.Asp236Asn | p.D236N | Q9BUK6 | protein_coding | tolerated(0.52) | benign(0.038) | TCGA-AC-A23H-01 | Breast | breast invasive carcinoma | Female | >=65 | I/II | Unknown | Unknown | PD |
| MSTO1 | SNV | Missense_Mutation | c.10N>A | p.Gly4Arg | p.G4R | Q9BUK6 | protein_coding | tolerated(0.58) | possibly_damaging(0.618) | TCGA-AR-A2LE-01 | Breast | breast invasive carcinoma | Female | >=65 | I/II | Hormone Therapy | tamoxiphen | PD | |
| MSTO1 | SNV | Missense_Mutation | novel | c.1617N>T | p.Met539Ile | p.M539I | Q9BUK6 | protein_coding | tolerated(0.05) | benign(0.005) | TCGA-B6-A0RM-01 | Breast | breast invasive carcinoma | Female | <65 | I/II | Unknown | Unknown | SD |
| MSTO1 | SNV | Missense_Mutation | novel | c.1618N>T | p.Asp540Tyr | p.D540Y | Q9BUK6 | protein_coding | deleterious(0.01) | benign(0.423) | TCGA-B6-A0RM-01 | Breast | breast invasive carcinoma | Female | <65 | I/II | Unknown | Unknown | SD |
| MSTO1 | insertion | Frame_Shift_Ins | novel | c.1002_1003insGC | p.Thr335AlafsTer27 | p.T335Afs*27 | Q9BUK6 | protein_coding | TCGA-BH-A0AY-01 | Breast | breast invasive carcinoma | Female | <65 | I/II | Chemotherapy | SD | |||
| MSTO1 | SNV | Missense_Mutation | rs150075701 | c.1034G>A | p.Arg345His | p.R345H | Q9BUK6 | protein_coding | deleterious(0) | probably_damaging(0.996) | TCGA-2W-A8YY-01 | Cervix | cervical & endocervical cancer | Female | <65 | I/II | Chemotherapy | cisplatin | CR |
| MSTO1 | SNV | Missense_Mutation | rs149058840 | c.931G>A | p.Glu311Lys | p.E311K | Q9BUK6 | protein_coding | tolerated(0.35) | benign(0) | TCGA-DG-A2KK-01 | Cervix | cervical & endocervical cancer | Female | <65 | III/IV | Chemotherapy | cisplatin | SD |
| MSTO1 | SNV | Missense_Mutation | c.364N>C | p.Glu122Gln | p.E122Q | Q9BUK6 | protein_coding | tolerated(0.22) | benign(0.041) | TCGA-JX-A3Q0-01 | Cervix | cervical & endocervical cancer | Female | <65 | III/IV | Unknown | Unknown | SD | |
| MSTO1 | SNV | Missense_Mutation | rs761740567 | c.835N>T | p.Arg279Cys | p.R279C | Q9BUK6 | protein_coding | deleterious(0) | possibly_damaging(0.494) | TCGA-F4-6570-01 | Colorectum | colon adenocarcinoma | Female | >=65 | I/II | Unknown | Unknown | SD |
| MSTO1 | SNV | Missense_Mutation | c.741N>T | p.Glu247Asp | p.E247D | Q9BUK6 | protein_coding | deleterious(0) | probably_damaging(0.944) | TCGA-QG-A5Z2-01 | Colorectum | colon adenocarcinoma | Male | <65 | I/II | Unknown | Unknown | SD |
| Page: 1 2 3 4 |
Top |
Related drugs of malignant transformation related genes |
| Identification of chemicals and drugs interact with genes involved in malignant transfromation |
| (DGIdb 4.0) |
| Entrez ID | Symbol | Category | Interaction Types | Drug Claim Name | Drug Name | PMIDs |
| Page: 1 |

Copyright 2023-Present -The University of Texas Health Science Center at Houston |