
|
|||||
|
 | |
| |
| |
| |
| |
| |
|
Gene: MST1 |
Gene summary for MST1 |
| Gene information | Species | Human | Gene symbol | MST1 | Gene ID | 4485 |
| Gene name | macrophage stimulating 1 | |
| Gene Alias | D3F15S2 | |
| Cytomap | 3p21.31 | |
| Gene Type | protein-coding | GO ID | GO:0001932 | UniProtAcc | G3XAK1 |
Top |
Malignant transformation analysis |
| Identification of the aberrant gene expression in precancerous and cancerous lesions by comparing the gene expression of stem-like cells in diseased tissues with normal stem cells |
| Entrez ID | Symbol | Replicates | Species | Organ | Tissue | Adj P-value | Log2FC | Malignancy |
| 4485 | MST1 | NAFLD1 | Human | Liver | NAFLD | 3.23e-03 | 3.54e-01 | -0.04 |
| 4485 | MST1 | S43 | Human | Liver | Cirrhotic | 1.01e-10 | -1.13e-01 | -0.0187 |
| 4485 | MST1 | HCC1_Meng | Human | Liver | HCC | 1.03e-70 | 3.16e-01 | 0.0246 |
| 4485 | MST1 | HCC2_Meng | Human | Liver | HCC | 5.26e-05 | -2.60e-01 | 0.0107 |
| 4485 | MST1 | cirrhotic1 | Human | Liver | Cirrhotic | 4.74e-04 | 2.24e-01 | 0.0202 |
| 4485 | MST1 | cirrhotic2 | Human | Liver | Cirrhotic | 8.25e-06 | 2.29e-01 | 0.0201 |
| 4485 | MST1 | HCC1 | Human | Liver | HCC | 5.08e-05 | 2.46e+00 | 0.5336 |
| 4485 | MST1 | HCC2 | Human | Liver | HCC | 1.56e-04 | 2.80e+00 | 0.5341 |
| 4485 | MST1 | Pt13.b | Human | Liver | HCC | 7.44e-03 | -5.18e-02 | 0.0251 |
| 4485 | MST1 | Pt14.a | Human | Liver | HCC | 2.59e-02 | 1.96e-01 | 0.0169 |
| 4485 | MST1 | S014 | Human | Liver | HCC | 1.18e-12 | 8.84e-01 | 0.2254 |
| 4485 | MST1 | S015 | Human | Liver | HCC | 1.06e-09 | 1.02e+00 | 0.2375 |
| 4485 | MST1 | S016 | Human | Liver | HCC | 8.47e-09 | 6.50e-01 | 0.2243 |
| 4485 | MST1 | S027 | Human | Liver | HCC | 2.15e-09 | 1.14e+00 | 0.2446 |
| 4485 | MST1 | S028 | Human | Liver | HCC | 1.09e-28 | 1.61e+00 | 0.2503 |
| 4485 | MST1 | S029 | Human | Liver | HCC | 3.44e-19 | 1.38e+00 | 0.2581 |
| Page: 1 |
| Tissue | Expression Dynamics | Abbreviation |
| Liver | 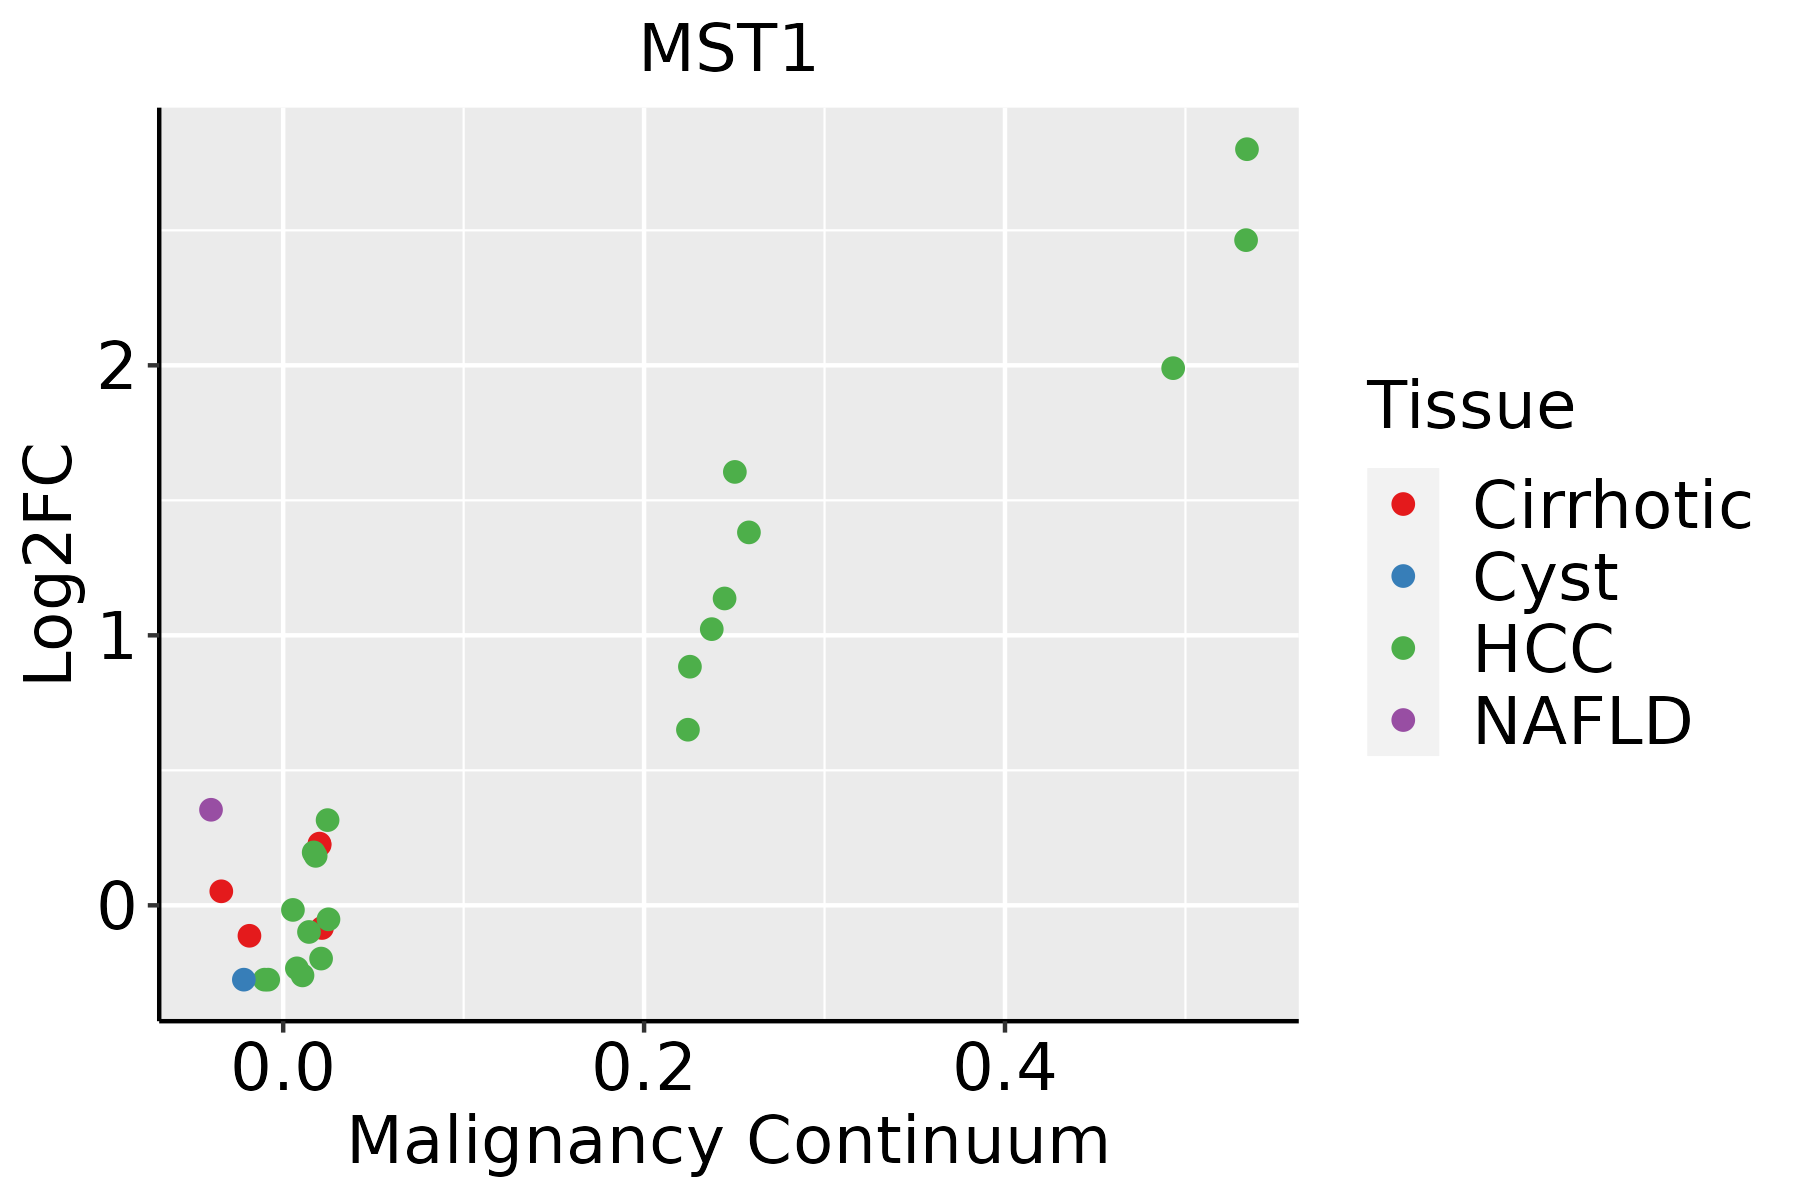 | HCC: Hepatocellular carcinoma |
| NAFLD: Non-alcoholic fatty liver disease |
| ∗log2FC in expression of this searched gene in stem-like cells from each diseased tissue sample relative to stem-like cells in normal samples in each tissue plotted against the malignancy continuum. Samples are colored based on if they are from different disease stage. |
Top |
Malignant transformation related pathway analysis |
| Find out the enriched GO biological processes and KEGG pathways involved in transition from healthy to precancer to cancer |
| Tissue | Disease Stage | Enriched GO biological Processes |
| Colorectum | AD |  |
| Colorectum | SER |  |
| Colorectum | MSS |  |
| Colorectum | MSI-H |  |
| Colorectum | FAP |  |
| ∗Top 15 enriched GO BP terms are showed in the bar plot of each disease state in each tissue. Each row represents a significant GO biological process which is colored according to the -log10(p.adjust). |
| Page: 1 2 3 4 5 6 7 8 9 |
| GO ID | Tissue | Disease Stage | Description | Gene Ratio | Bg Ratio | pvalue | p.adjust | Count |
| GO:00165703 | Liver | NAFLD | histone modification | 90/1882 | 463/18723 | 5.74e-10 | 1.28e-07 | 90 |
| GO:00181055 | Liver | NAFLD | peptidyl-serine phosphorylation | 63/1882 | 315/18723 | 7.45e-08 | 6.60e-06 | 63 |
| GO:00059965 | Liver | NAFLD | monosaccharide metabolic process | 53/1882 | 257/18723 | 2.89e-07 | 1.92e-05 | 53 |
| GO:00182094 | Liver | NAFLD | peptidyl-serine modification | 64/1882 | 338/18723 | 4.65e-07 | 2.89e-05 | 64 |
| GO:00620125 | Liver | NAFLD | regulation of small molecule metabolic process | 63/1882 | 334/18723 | 6.55e-07 | 3.79e-05 | 63 |
| GO:00193185 | Liver | NAFLD | hexose metabolic process | 49/1882 | 237/18723 | 7.41e-07 | 4.12e-05 | 49 |
| GO:00442623 | Liver | NAFLD | cellular carbohydrate metabolic process | 55/1882 | 283/18723 | 1.27e-06 | 6.01e-05 | 55 |
| GO:0016051 | Liver | NAFLD | carbohydrate biosynthetic process | 43/1882 | 202/18723 | 1.55e-06 | 6.96e-05 | 43 |
| GO:00060065 | Liver | NAFLD | glucose metabolic process | 42/1882 | 196/18723 | 1.70e-06 | 7.47e-05 | 42 |
| GO:00061093 | Liver | NAFLD | regulation of carbohydrate metabolic process | 38/1882 | 178/18723 | 5.71e-06 | 2.04e-04 | 38 |
| GO:0046364 | Liver | NAFLD | monosaccharide biosynthetic process | 22/1882 | 82/18723 | 1.31e-05 | 3.93e-04 | 22 |
| GO:0019319 | Liver | NAFLD | hexose biosynthetic process | 21/1882 | 78/18723 | 1.93e-05 | 5.52e-04 | 21 |
| GO:0006094 | Liver | NAFLD | gluconeogenesis | 20/1882 | 75/18723 | 3.52e-05 | 8.95e-04 | 20 |
| GO:00106753 | Liver | NAFLD | regulation of cellular carbohydrate metabolic process | 31/1882 | 146/18723 | 4.47e-05 | 1.08e-03 | 31 |
| GO:00109063 | Liver | NAFLD | regulation of glucose metabolic process | 26/1882 | 119/18723 | 1.09e-04 | 2.13e-03 | 26 |
| GO:0062014 | Liver | NAFLD | negative regulation of small molecule metabolic process | 21/1882 | 102/18723 | 1.09e-03 | 1.27e-02 | 21 |
| GO:0043255 | Liver | NAFLD | regulation of carbohydrate biosynthetic process | 20/1882 | 97/18723 | 1.39e-03 | 1.56e-02 | 20 |
| GO:0045912 | Liver | NAFLD | negative regulation of carbohydrate metabolic process | 12/1882 | 48/18723 | 2.30e-03 | 2.19e-02 | 12 |
| GO:0010677 | Liver | NAFLD | negative regulation of cellular carbohydrate metabolic process | 11/1882 | 42/18723 | 2.32e-03 | 2.19e-02 | 11 |
| GO:0006111 | Liver | NAFLD | regulation of gluconeogenesis | 11/1882 | 48/18723 | 7.00e-03 | 4.90e-02 | 11 |
| Page: 1 2 3 |
| Pathway ID | Tissue | Disease Stage | Description | Gene Ratio | Bg Ratio | pvalue | p.adjust | qvalue | Count |
| Page: 1 |
Top |
Cell-cell communication analysis |
| Identification of potential cell-cell interactions between two cell types and their ligand-receptor pairs for different disease states |
| Ligand | Receptor | LRpair | Pathway | Tissue | Disease Stage |
| Page: 1 |
Top |
Single-cell gene regulatory network inference analysis |
| Find out the significant the regulons (TFs) and the target genes of each regulon across cell types for different disease states |
| TF | Cell Type | Tissue | Disease Stage | Target Gene | RSS | Regulon Activity |
| ∗The dot plots of a searched regulon are shown for all cell subpopulations in each disease state of each tissue based on the regulon specific score inferred using pySCENIC and by calculating the average expression. |
| Page: 1 |
Top |
Somatic mutation of malignant transformation related genes |
| Annotation of somatic variants for genes involved in malignant transformation |
| Hugo Symbol | Variant Class | Variant Classification | dbSNP RS | HGVSc | HGVSp | HGVSp Short | SWISSPROT | BIOTYPE | SIFT | PolyPhen | Tumor Sample Barcode | Tissue | Histology | Sex | Age | Stage | Therapy Types | Drugs | Outcome |
| MST1 | SNV | Missense_Mutation | novel | c.1465N>A | p.Leu489Met | p.L489M | protein_coding | tolerated(0.21) | benign(0.255) | TCGA-B6-A0IB-01 | Breast | breast invasive carcinoma | Female | <65 | III/IV | Unknown | Unknown | PD | |
| MST1 | SNV | Missense_Mutation | novel | c.185N>G | p.Glu62Gly | p.E62G | protein_coding | tolerated(0.06) | possibly_damaging(0.479) | TCGA-C5-A901-01 | Cervix | cervical & endocervical cancer | Female | <65 | I/II | Unknown | Unknown | SD | |
| MST1 | insertion | Frame_Shift_Ins | novel | c.736_737insG | p.Asp246GlyfsTer13 | p.D246Gfs*13 | protein_coding | TCGA-JW-A5VL-01 | Cervix | cervical & endocervical cancer | Female | <65 | I/II | Unknown | Unknown | SD | |||
| MST1 | SNV | Missense_Mutation | c.721N>T | p.Pro241Ser | p.P241S | protein_coding | deleterious(0.02) | probably_damaging(1) | TCGA-A6-6780-01 | Colorectum | colon adenocarcinoma | Male | >=65 | I/II | Unknown | Unknown | SD | ||
| MST1 | SNV | Missense_Mutation | rs377644714 | c.320N>A | p.Arg107Gln | p.R107Q | protein_coding | tolerated(1) | benign(0) | TCGA-AA-3492-01 | Colorectum | colon adenocarcinoma | Female | >=65 | I/II | Unknown | Unknown | SD | |
| MST1 | SNV | Missense_Mutation | c.263N>A | p.Ser88Asn | p.S88N | protein_coding | tolerated(0.33) | benign(0.366) | TCGA-CA-6717-01 | Colorectum | colon adenocarcinoma | Male | <65 | I/II | Chemotherapy | oxaliplatin | CR | ||
| MST1 | SNV | Missense_Mutation | rs369252300 | c.1702C>T | p.Arg568Trp | p.R568W | protein_coding | deleterious(0.02) | possibly_damaging(0.475) | TCGA-CK-4951-01 | Colorectum | colon adenocarcinoma | Female | >=65 | I/II | Unknown | Unknown | PD | |
| MST1 | SNV | Missense_Mutation | c.1855N>A | p.Ala619Thr | p.A619T | protein_coding | tolerated(0.22) | benign(0.274) | TCGA-D5-6930-01 | Colorectum | colon adenocarcinoma | Male | >=65 | I/II | Unknown | Unknown | SD | ||
| MST1 | SNV | Missense_Mutation | novel | c.1723N>C | p.Val575Leu | p.V575L | protein_coding | tolerated(0.06) | benign(0.007) | TCGA-DM-A1HA-01 | Colorectum | colon adenocarcinoma | Male | >=65 | III/IV | Unknown | Unknown | SD | |
| MST1 | SNV | Missense_Mutation | c.465T>A | p.Asp155Glu | p.D155E | protein_coding | tolerated(0.6) | probably_damaging(1) | TCGA-G4-6302-01 | Colorectum | colon adenocarcinoma | Female | >=65 | I/II | Unknown | Unknown | SD |
| Page: 1 2 3 4 5 6 |
Top |
Related drugs of malignant transformation related genes |
| Identification of chemicals and drugs interact with genes involved in malignant transfromation |
| (DGIdb 4.0) |
| Entrez ID | Symbol | Category | Interaction Types | Drug Claim Name | Drug Name | PMIDs |
| 4485 | MST1 | PROTEASE, KINASE, DRUGGABLE GENOME | RETINOIC ACID | 9886825 |
| Page: 1 |

Copyright 2023-Present -The University of Texas Health Science Center at Houston |