
|
|||||
|
 | |
| |
| |
| |
| |
| |
|
Gene: MSRB3 |
Gene summary for MSRB3 |
| Gene information | Species | Human | Gene symbol | MSRB3 | Gene ID | 253827 |
| Gene name | methionine sulfoxide reductase B3 | |
| Gene Alias | DFNB74 | |
| Cytomap | 12q14.3 | |
| Gene Type | protein-coding | GO ID | GO:0006807 | UniProtAcc | Q8IXL7 |
Top |
Malignant transformation analysis |
| Identification of the aberrant gene expression in precancerous and cancerous lesions by comparing the gene expression of stem-like cells in diseased tissues with normal stem cells |
| Entrez ID | Symbol | Replicates | Species | Organ | Tissue | Adj P-value | Log2FC | Malignancy |
| 253827 | MSRB3 | LZE7T | Human | Esophagus | ESCC | 1.18e-06 | 2.80e-01 | 0.0667 |
| 253827 | MSRB3 | P2T-E | Human | Esophagus | ESCC | 1.63e-22 | 4.58e-01 | 0.1177 |
| 253827 | MSRB3 | P4T-E | Human | Esophagus | ESCC | 5.05e-06 | 2.33e-01 | 0.1323 |
| 253827 | MSRB3 | P5T-E | Human | Esophagus | ESCC | 7.03e-03 | 1.67e-01 | 0.1327 |
| 253827 | MSRB3 | P8T-E | Human | Esophagus | ESCC | 7.30e-10 | 2.96e-01 | 0.0889 |
| 253827 | MSRB3 | P9T-E | Human | Esophagus | ESCC | 4.07e-08 | 2.94e-01 | 0.1131 |
| 253827 | MSRB3 | P10T-E | Human | Esophagus | ESCC | 7.31e-19 | 3.59e-01 | 0.116 |
| 253827 | MSRB3 | P12T-E | Human | Esophagus | ESCC | 4.12e-06 | 2.04e-01 | 0.1122 |
| 253827 | MSRB3 | P15T-E | Human | Esophagus | ESCC | 3.32e-13 | 3.60e-01 | 0.1149 |
| 253827 | MSRB3 | P16T-E | Human | Esophagus | ESCC | 5.19e-04 | 1.59e-01 | 0.1153 |
| 253827 | MSRB3 | P19T-E | Human | Esophagus | ESCC | 4.38e-04 | 6.28e-01 | 0.1662 |
| 253827 | MSRB3 | P22T-E | Human | Esophagus | ESCC | 9.93e-07 | 1.77e-01 | 0.1236 |
| 253827 | MSRB3 | P23T-E | Human | Esophagus | ESCC | 4.68e-10 | 3.16e-01 | 0.108 |
| 253827 | MSRB3 | P24T-E | Human | Esophagus | ESCC | 1.13e-07 | 2.34e-01 | 0.1287 |
| 253827 | MSRB3 | P26T-E | Human | Esophagus | ESCC | 1.37e-32 | 6.12e-01 | 0.1276 |
| 253827 | MSRB3 | P27T-E | Human | Esophagus | ESCC | 4.03e-04 | 1.16e-01 | 0.1055 |
| 253827 | MSRB3 | P30T-E | Human | Esophagus | ESCC | 2.38e-02 | 1.95e-01 | 0.137 |
| 253827 | MSRB3 | P32T-E | Human | Esophagus | ESCC | 1.32e-32 | 6.27e-01 | 0.1666 |
| 253827 | MSRB3 | P36T-E | Human | Esophagus | ESCC | 3.38e-08 | 1.87e-01 | 0.1187 |
| 253827 | MSRB3 | P37T-E | Human | Esophagus | ESCC | 6.69e-21 | 5.13e-01 | 0.1371 |
| Page: 1 2 3 |
| Tissue | Expression Dynamics | Abbreviation |
| Esophagus |  | ESCC: Esophageal squamous cell carcinoma |
| HGIN: High-grade intraepithelial neoplasias | ||
| LGIN: Low-grade intraepithelial neoplasias | ||
| Liver |  | HCC: Hepatocellular carcinoma |
| NAFLD: Non-alcoholic fatty liver disease | ||
| Prostate | 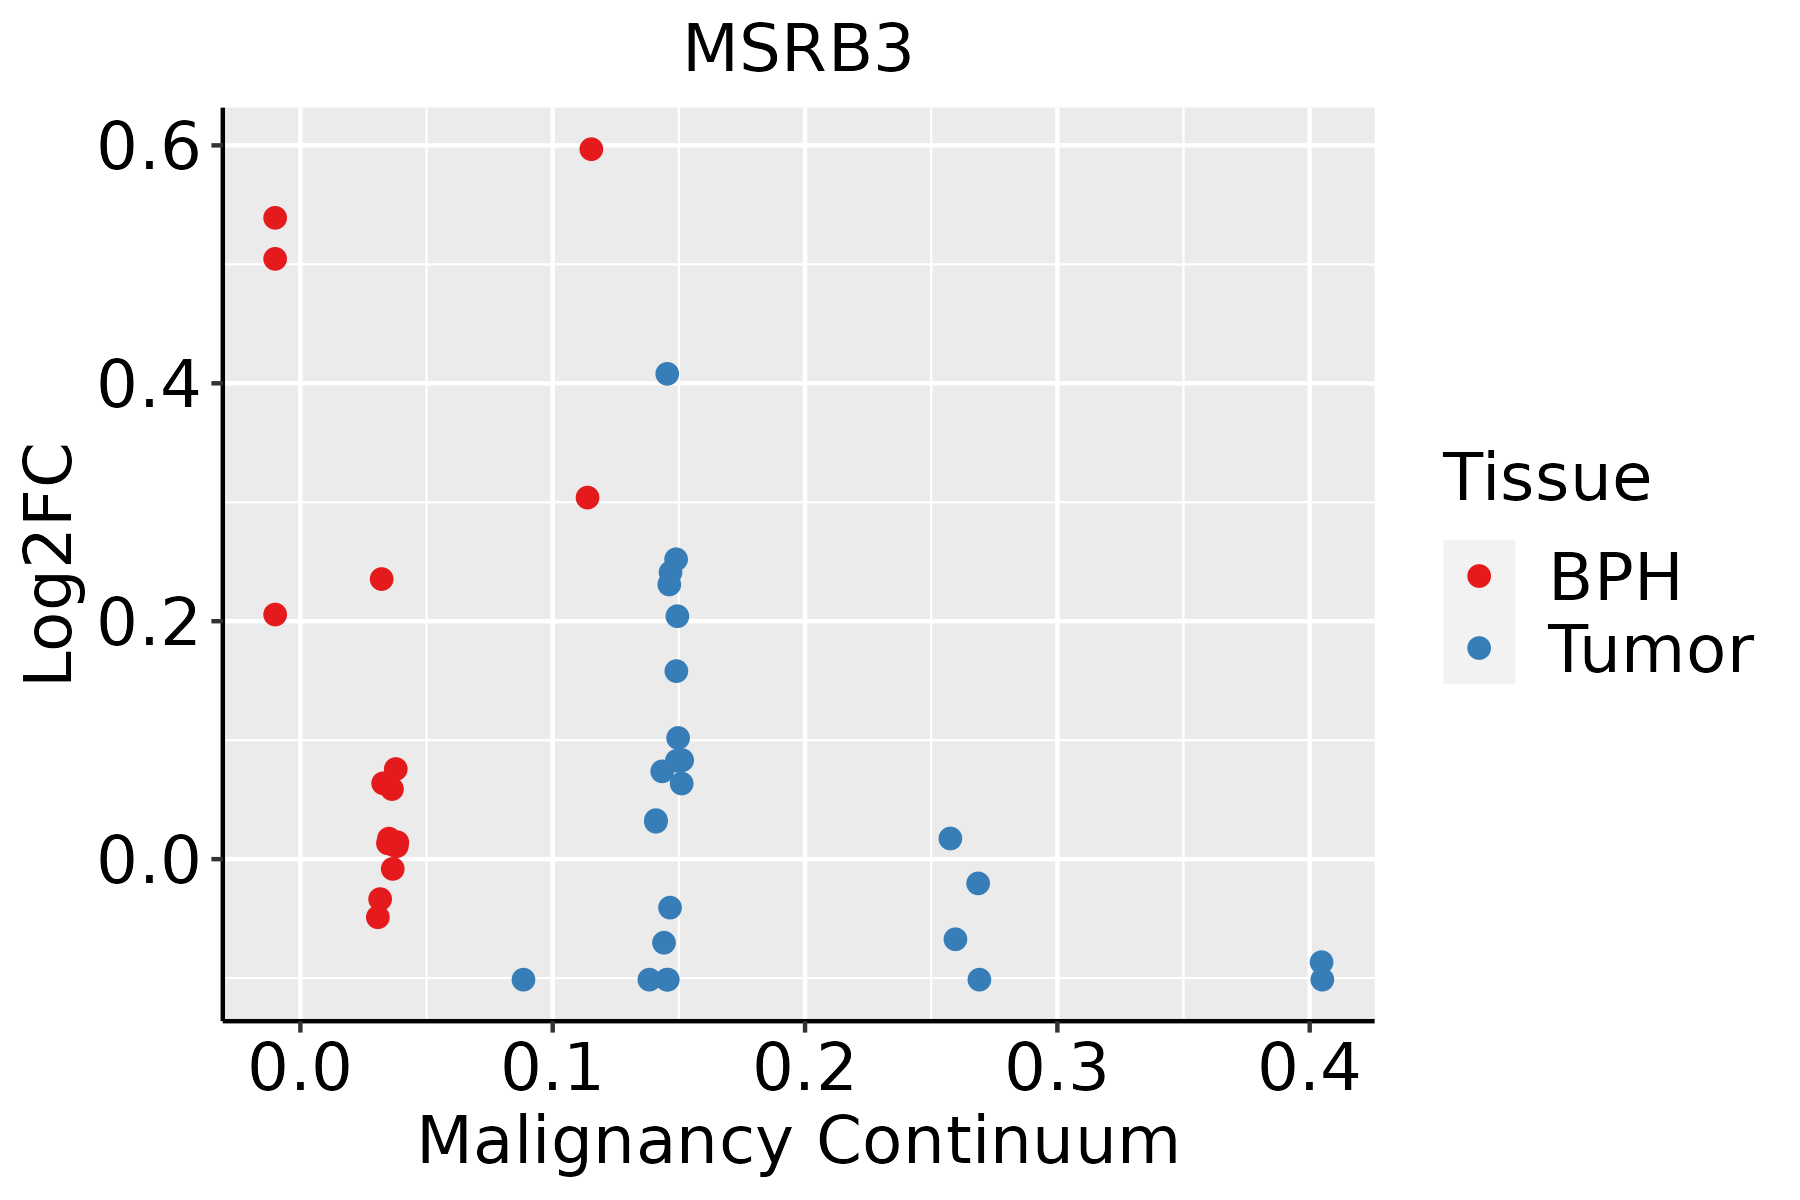 | BPH: Benign Prostatic Hyperplasia |
| Thyroid | 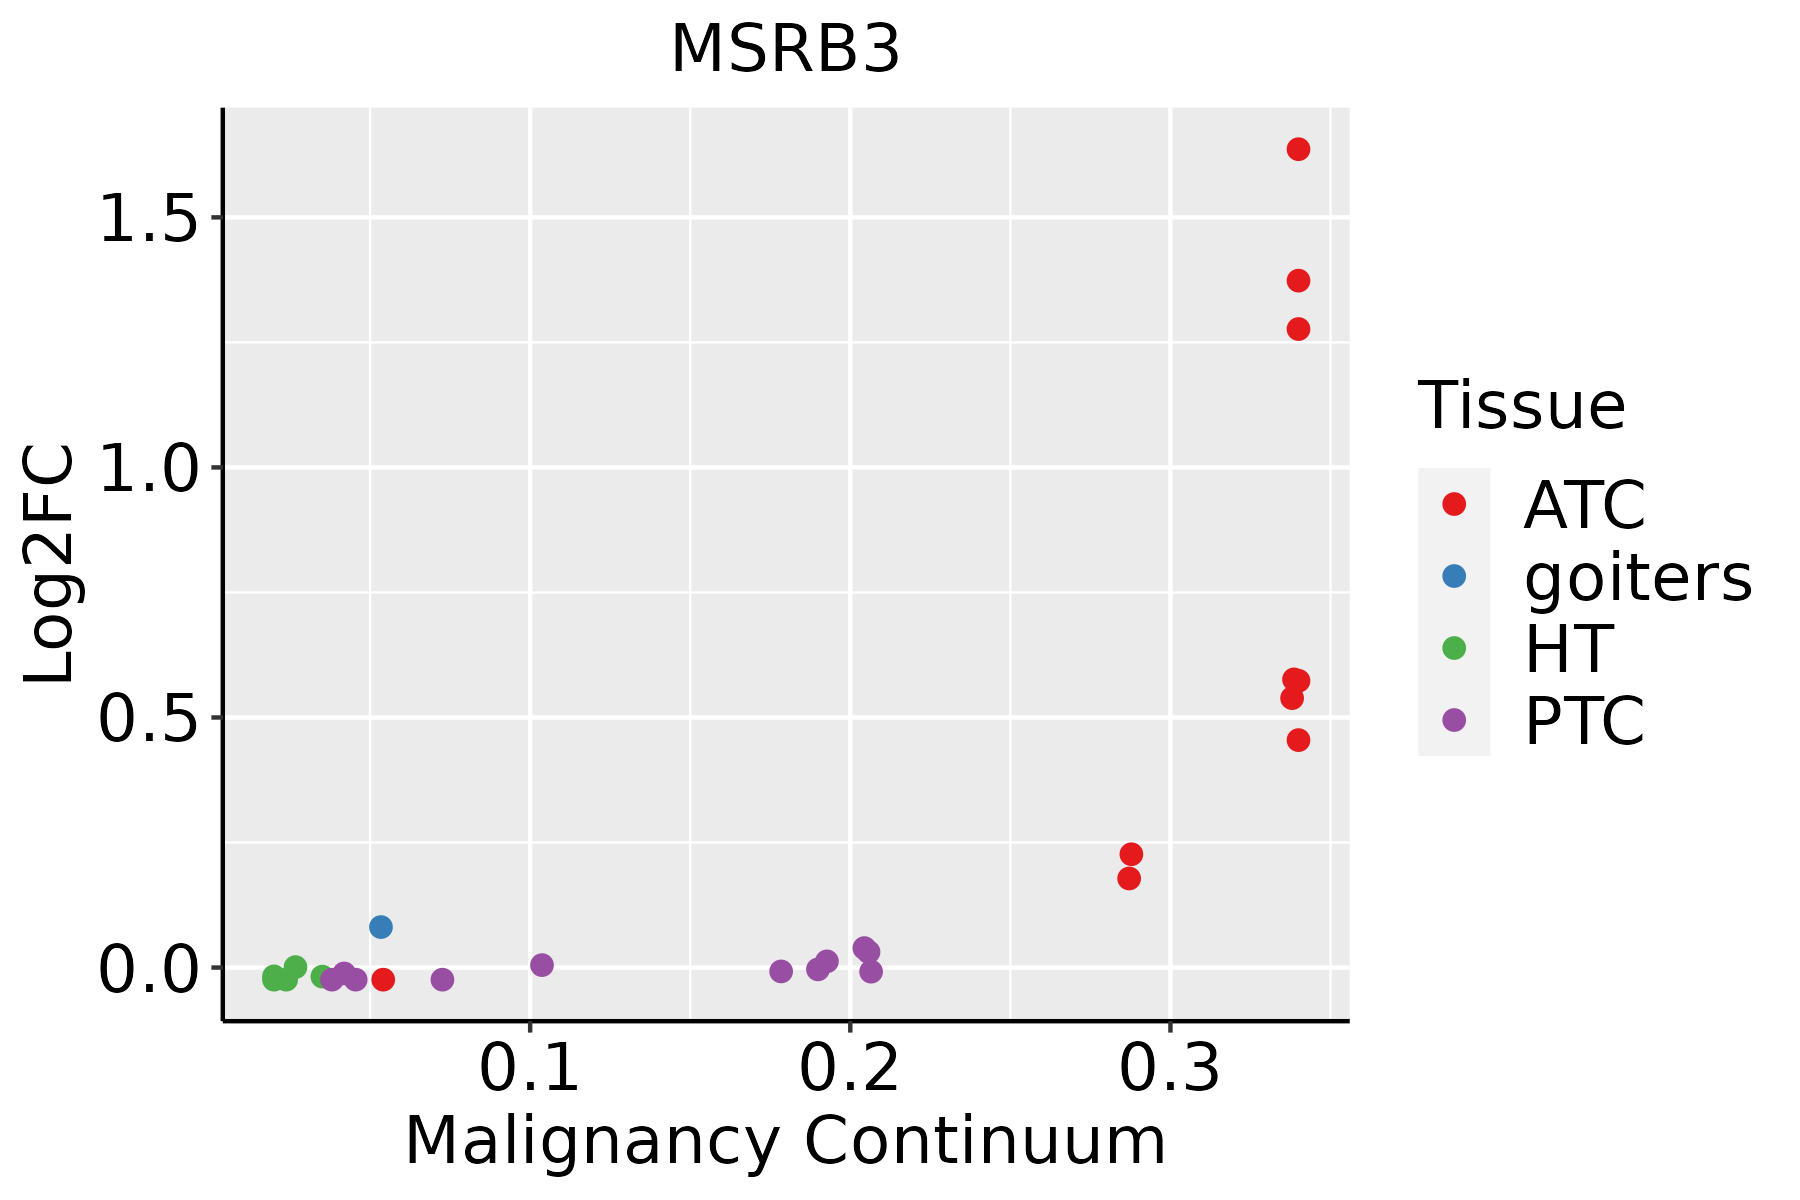 | ATC: Anaplastic thyroid cancer |
| HT: Hashimoto's thyroiditis | ||
| PTC: Papillary thyroid cancer |
| ∗log2FC in expression of this searched gene in stem-like cells from each diseased tissue sample relative to stem-like cells in normal samples in each tissue plotted against the malignancy continuum. Samples are colored based on if they are from different disease stage. |
Top |
Malignant transformation related pathway analysis |
| Find out the enriched GO biological processes and KEGG pathways involved in transition from healthy to precancer to cancer |
| Tissue | Disease Stage | Enriched GO biological Processes |
| Colorectum | AD |  |
| Colorectum | SER |  |
| Colorectum | MSS |  |
| Colorectum | MSI-H |  |
| Colorectum | FAP |  |
| ∗Top 15 enriched GO BP terms are showed in the bar plot of each disease state in each tissue. Each row represents a significant GO biological process which is colored according to the -log10(p.adjust). |
| Page: 1 2 3 4 5 6 7 8 9 |
| GO ID | Tissue | Disease Stage | Description | Gene Ratio | Bg Ratio | pvalue | p.adjust | Count |
| GO:0006979111 | Esophagus | ESCC | response to oxidative stress | 303/8552 | 446/18723 | 7.15e-22 | 1.30e-19 | 303 |
| GO:000697922 | Liver | HCC | response to oxidative stress | 281/7958 | 446/18723 | 9.75e-19 | 1.24e-16 | 281 |
| GO:000697918 | Prostate | BPH | response to oxidative stress | 142/3107 | 446/18723 | 8.11e-16 | 1.36e-13 | 142 |
| GO:000697934 | Thyroid | ATC | response to oxidative stress | 246/6293 | 446/18723 | 2.98e-21 | 6.09e-19 | 246 |
| Page: 1 |
| Pathway ID | Tissue | Disease Stage | Description | Gene Ratio | Bg Ratio | pvalue | p.adjust | qvalue | Count |
| Page: 1 |
Top |
Cell-cell communication analysis |
| Identification of potential cell-cell interactions between two cell types and their ligand-receptor pairs for different disease states |
| Ligand | Receptor | LRpair | Pathway | Tissue | Disease Stage |
| Page: 1 |
Top |
Single-cell gene regulatory network inference analysis |
| Find out the significant the regulons (TFs) and the target genes of each regulon across cell types for different disease states |
| TF | Cell Type | Tissue | Disease Stage | Target Gene | RSS | Regulon Activity |
| ∗The dot plots of a searched regulon are shown for all cell subpopulations in each disease state of each tissue based on the regulon specific score inferred using pySCENIC and by calculating the average expression. |
| Page: 1 |
Top |
Somatic mutation of malignant transformation related genes |
| Annotation of somatic variants for genes involved in malignant transformation |
| Hugo Symbol | Variant Class | Variant Classification | dbSNP RS | HGVSc | HGVSp | HGVSp Short | SWISSPROT | BIOTYPE | SIFT | PolyPhen | Tumor Sample Barcode | Tissue | Histology | Sex | Age | Stage | Therapy Types | Drugs | Outcome |
| MSRB3 | SNV | Missense_Mutation | c.139N>A | p.Gln47Lys | p.Q47K | Q8IXL7 | protein_coding | tolerated(0.54) | benign(0.042) | TCGA-A8-A07R-01 | Breast | breast invasive carcinoma | Female | >=65 | III/IV | Ancillary | zoledronic | SD | |
| MSRB3 | SNV | Missense_Mutation | c.142C>G | p.Gln48Glu | p.Q48E | Q8IXL7 | protein_coding | tolerated(1) | benign(0.001) | TCGA-GI-A2C8-01 | Breast | breast invasive carcinoma | Female | <65 | III/IV | Unspecific | Adriamycin | SD | |
| MSRB3 | insertion | In_Frame_Ins | novel | c.335_336insTTTCCAAAACAC | p.Val112_Ile113insPheGlnAsnThr | p.V112_I113insFQNT | Q8IXL7 | protein_coding | TCGA-AR-A0U0-01 | Breast | breast invasive carcinoma | Female | >=65 | I/II | Unknown | Unknown | SD | ||
| MSRB3 | SNV | Missense_Mutation | novel | c.224N>G | p.Tyr75Cys | p.Y75C | Q8IXL7 | protein_coding | deleterious(0) | probably_damaging(0.989) | TCGA-DS-A1OA-01 | Cervix | cervical & endocervical cancer | Female | >=65 | I/II | Chemotherapy | carboplatin | PD |
| MSRB3 | SNV | Missense_Mutation | c.526G>A | p.Glu176Lys | p.E176K | Q8IXL7 | protein_coding | tolerated(0.38) | benign(0) | TCGA-FU-A3NI-01 | Cervix | cervical & endocervical cancer | Female | <65 | I/II | Unknown | Unknown | SD | |
| MSRB3 | SNV | Missense_Mutation | novel | c.43C>A | p.Leu15Ile | p.L15I | Q8IXL7 | protein_coding | tolerated_low_confidence(0.37) | benign(0.364) | TCGA-VS-A94Z-01 | Cervix | cervical & endocervical cancer | Female | <65 | I/II | Chemotherapy | cisplatin | CR |
| MSRB3 | SNV | Missense_Mutation | rs267603630 | c.482C>T | p.Ser161Leu | p.S161L | Q8IXL7 | protein_coding | deleterious(0) | probably_damaging(0.998) | TCGA-A6-2675-01 | Colorectum | colon adenocarcinoma | Male | >=65 | I/II | Unknown | Unknown | SD |
| MSRB3 | SNV | Missense_Mutation | rs267603630 | c.482N>T | p.Ser161Leu | p.S161L | Q8IXL7 | protein_coding | deleterious(0) | probably_damaging(0.998) | TCGA-AA-A00N-01 | Colorectum | colon adenocarcinoma | Male | >=65 | I/II | Unknown | Unknown | PD |
| MSRB3 | SNV | Missense_Mutation | novel | c.123N>G | p.Cys41Trp | p.C41W | Q8IXL7 | protein_coding | tolerated(0.46) | benign(0.003) | TCGA-CA-6717-01 | Colorectum | colon adenocarcinoma | Male | <65 | I/II | Chemotherapy | oxaliplatin | CR |
| MSRB3 | SNV | Missense_Mutation | novel | c.360N>A | p.Phe120Leu | p.F120L | Q8IXL7 | protein_coding | tolerated(1) | benign(0.001) | TCGA-CA-6717-01 | Colorectum | colon adenocarcinoma | Male | <65 | I/II | Chemotherapy | oxaliplatin | CR |
| Page: 1 2 3 4 5 |
Top |
Related drugs of malignant transformation related genes |
| Identification of chemicals and drugs interact with genes involved in malignant transfromation |
| (DGIdb 4.0) |
| Entrez ID | Symbol | Category | Interaction Types | Drug Claim Name | Drug Name | PMIDs |
| Page: 1 |

Copyright 2023-Present -The University of Texas Health Science Center at Houston |