Schematic overview of the cellular and molecular mechanisms involved in the cancer progression, including the proposed cellular and molecular mechanisms in cancer cells trajectory. AT1: alveolar type 1 cells; AT2: alveolar type 2 cells; AAH: atypical adenomatous hyperplasia; AIS: adenocarcinoma in situ; MIA: minimally invasive adenocarcinoma; IA: invasive adenocarcinoma; EMT: epithelial-mesenchymal transition

Home

Download

Statistics

Help

Contact

Center for Computational Systems Medicine
leaf

Gene summary

leaf

Malignant transformation analysis

leaf

Malignant transformation related pathway analysis

leaf

Cell-cell communication analysis

leaf

Single-cell gene regulatory network inference analysis

leaf

Somatic mutation of malignant transformation related genes

leaf

Related drugs of malignant transformation related genes

Gene: MSRB1

Gene summary for MSRB1

check button Gene summary.

Gene informationSpeciesHuman
Gene symbol

MSRB1

Gene ID

51734

Gene namemethionine sulfoxide reductase B1
Gene AliasHSPC270
Cytomap16p13.3
Gene Typeprotein-coding
GO ID

GO:0002376

UniProtAcc

Q9NZV6


Top

Malignant transformation analysis

check button Identification of the aberrant gene expression in precancerous and cancerous lesions by comparing the gene expression of stem-like cells in diseased tissues with normal stem cells
check button Malignant transformation involving gene list.
Entrez IDSymbolReplicatesSpeciesOrganTissueAdj P-valueLog2FCMalignancy
51734MSRB1LZE2THumanEsophagusESCC3.97e-076.49e-010.082
51734MSRB1LZE4THumanEsophagusESCC1.35e-073.16e-010.0811
51734MSRB1LZE7THumanEsophagusESCC9.24e-095.04e-010.0667
51734MSRB1LZE8THumanEsophagusESCC3.26e-052.40e-010.067
51734MSRB1LZE20THumanEsophagusESCC6.46e-051.40e-010.0662
51734MSRB1LZE22THumanEsophagusESCC6.49e-043.69e-010.068
51734MSRB1LZE24THumanEsophagusESCC1.86e-194.15e-010.0596
51734MSRB1LZE6THumanEsophagusESCC1.58e-021.10e-010.0845
51734MSRB1P1T-EHumanEsophagusESCC4.81e-043.19e-010.0875
51734MSRB1P2T-EHumanEsophagusESCC1.91e-274.62e-010.1177
51734MSRB1P4T-EHumanEsophagusESCC7.16e-337.74e-010.1323
51734MSRB1P5T-EHumanEsophagusESCC6.39e-314.84e-010.1327
51734MSRB1P8T-EHumanEsophagusESCC5.28e-154.41e-010.0889
51734MSRB1P9T-EHumanEsophagusESCC1.22e-204.38e-010.1131
51734MSRB1P10T-EHumanEsophagusESCC2.05e-121.03e-010.116
51734MSRB1P11T-EHumanEsophagusESCC2.02e-137.11e-010.1426
51734MSRB1P12T-EHumanEsophagusESCC1.56e-254.85e-010.1122
51734MSRB1P15T-EHumanEsophagusESCC4.93e-378.09e-010.1149
51734MSRB1P16T-EHumanEsophagusESCC2.59e-081.24e-010.1153
51734MSRB1P17T-EHumanEsophagusESCC9.94e-154.89e-010.1278
Page: 1 2 3 4 5 6 

check button Transcriptomic changes along malignancy continuum.
TissueExpression DynamicsAbbreviation
EsophagusThe image shows the transcriptomic changes along malignancy continuum.log2FC in expression of this searched gene in stem-like cells from each diseased tissue sample relative to stem-like cells in normal samples in each tissue plotted against the malignancy continuum. Samples are colored based on if they are from different disease stage.
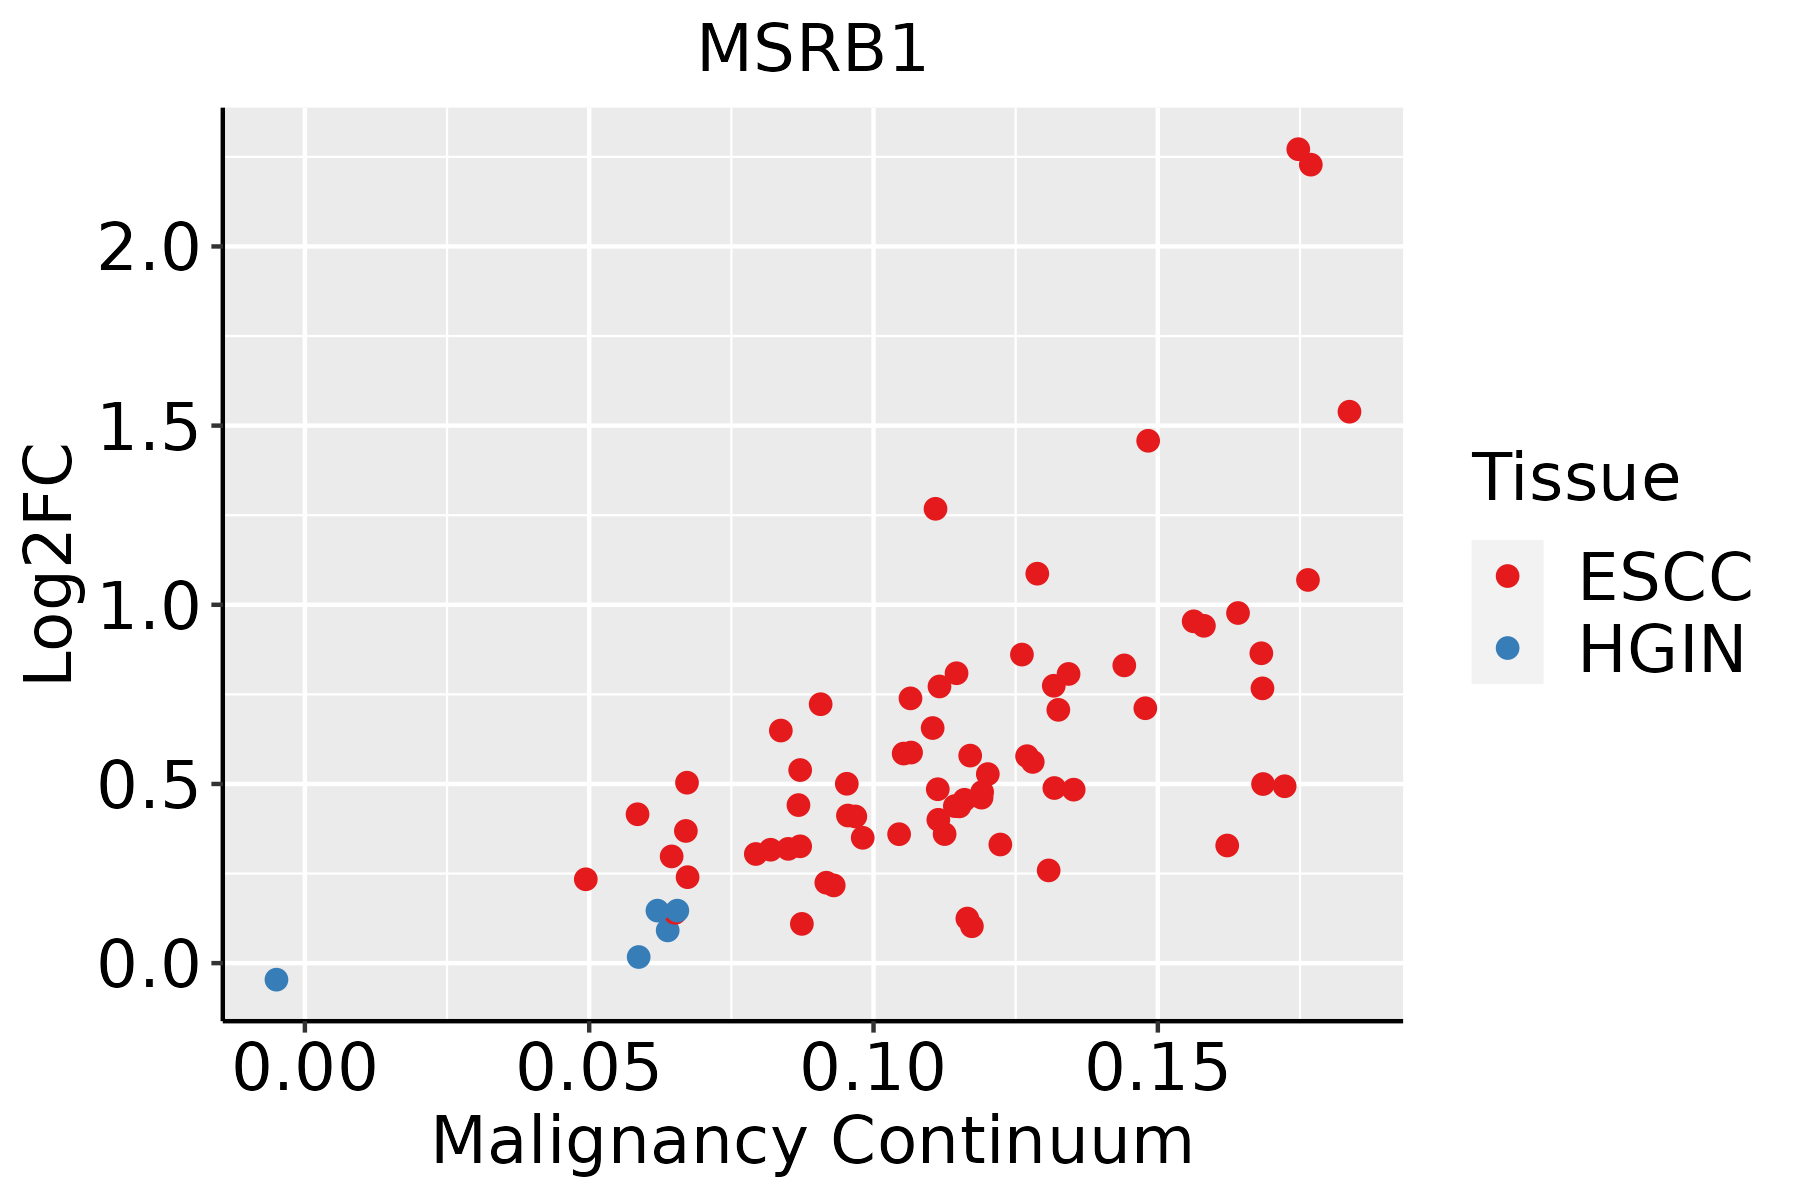
ESCC: Esophageal squamous cell carcinoma
HGIN: High-grade intraepithelial neoplasias
LGIN: Low-grade intraepithelial neoplasias
LiverThe image shows the transcriptomic changes along malignancy continuum.log2FC in expression of this searched gene in stem-like cells from each diseased tissue sample relative to stem-like cells in normal samples in each tissue plotted against the malignancy continuum. Samples are colored based on if they are from different disease stage.HCC: Hepatocellular carcinoma
NAFLD: Non-alcoholic fatty liver disease
Oral CavityThe image shows the transcriptomic changes along malignancy continuum.log2FC in expression of this searched gene in stem-like cells from each diseased tissue sample relative to stem-like cells in normal samples in each tissue plotted against the malignancy continuum. Samples are colored based on if they are from different disease stage.
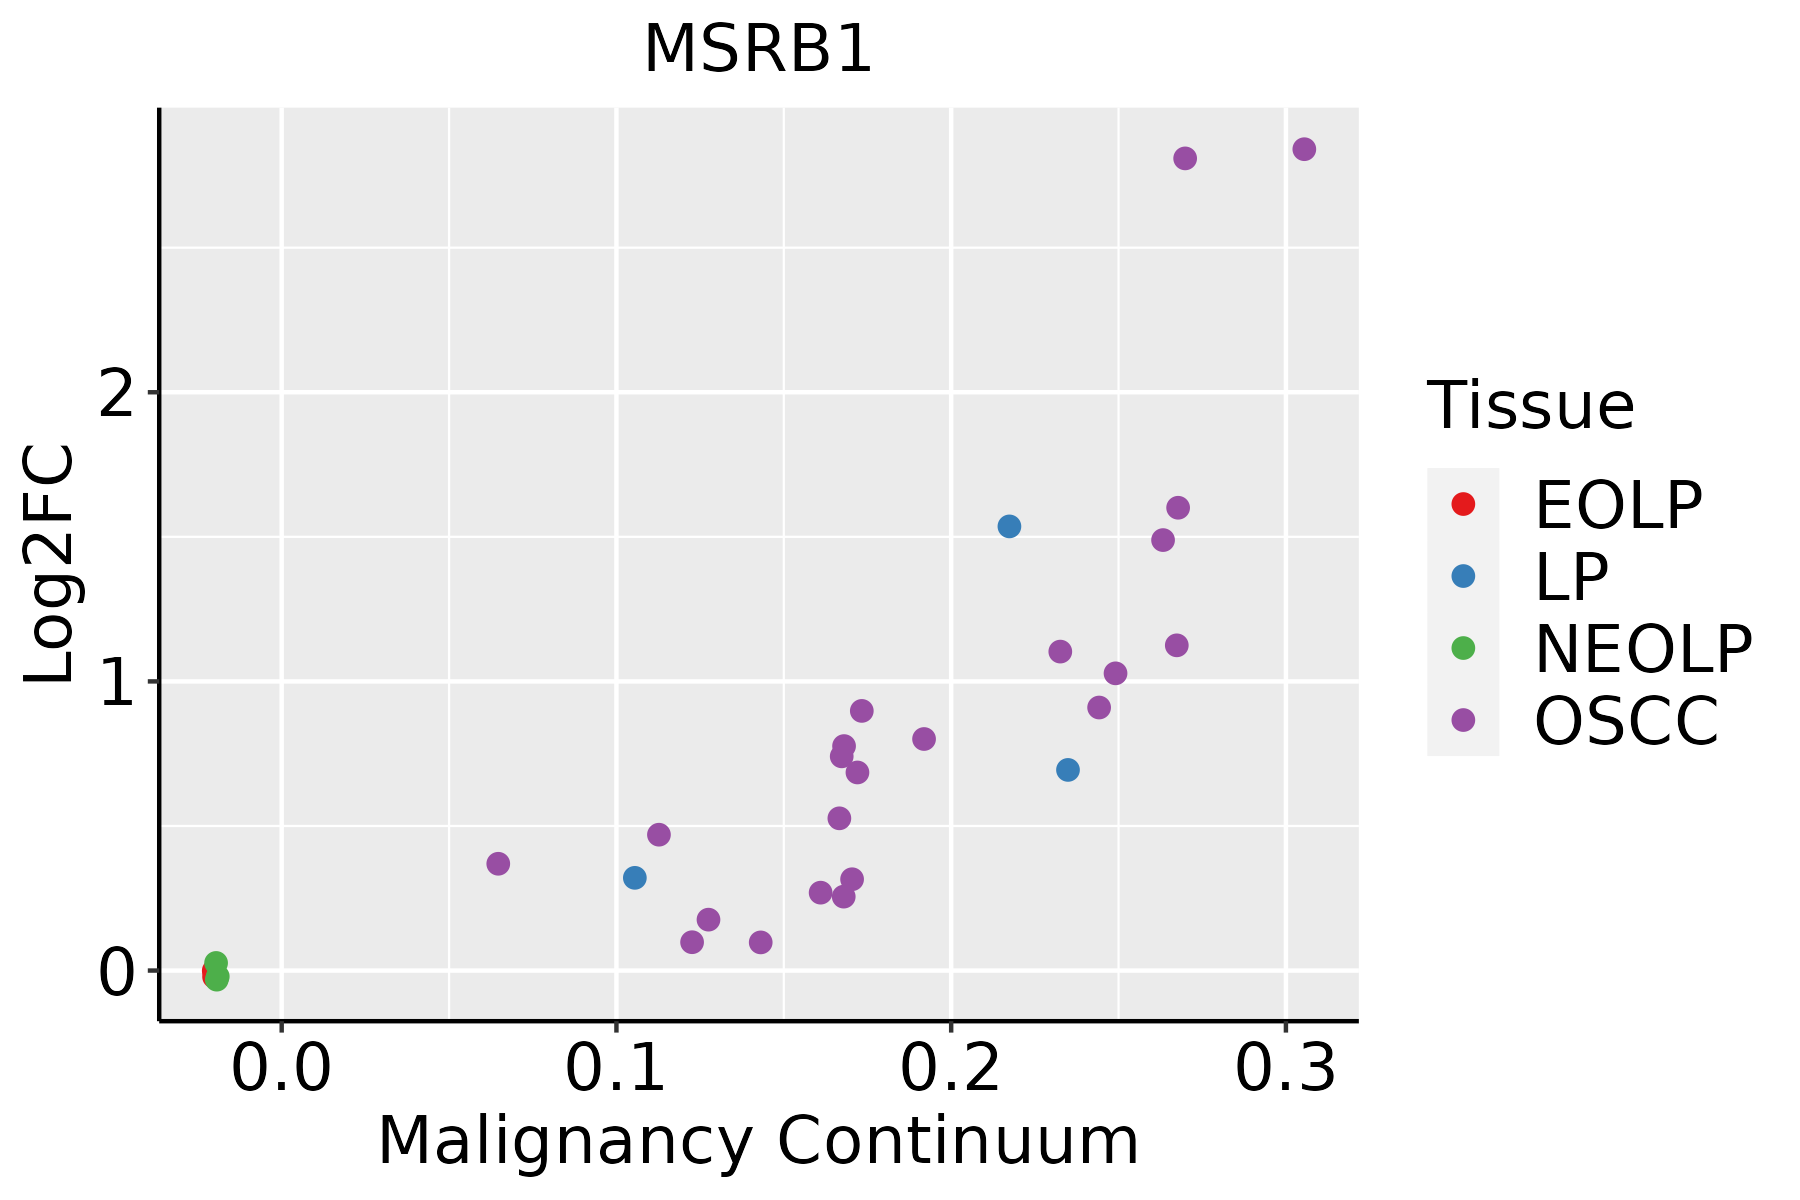
EOLP: Erosive Oral lichen planus
LP: leukoplakia
NEOLP: Non-erosive oral lichen planus
OSCC: Oral squamous cell carcinoma
SkinThe image shows the transcriptomic changes along malignancy continuum.log2FC in expression of this searched gene in stem-like cells from each diseased tissue sample relative to stem-like cells in normal samples in each tissue plotted against the malignancy continuum. Samples are colored based on if they are from different disease stage.AK: Actinic keratosis
cSCC: Cutaneous squamous cell carcinoma
SCCIS:squamous cell carcinoma in situ
∗log2FC in expression of this searched gene in stem-like cells from each diseased tissue sample relative to stem-like cells in normal samples in each tissue plotted against the malignancy continuum. Samples are colored based on if they are from different disease stage.

Top

Malignant transformation related pathway analysis

check buttonFind out the enriched GO biological processes and KEGG pathways involved in transition from healthy to precancer to cancer
check button Figure of enriched GO biological processes.
TissueDisease StageEnriched GO biological Processes
ColorectumADGO analysis - Figure of enriched GO biological processes: Top 15 enriched GO BP terms are showed in the bar plot of each disease state in each tissue. Each row represents a significant GO biological process which is colored according to the -log10(p.adjust).
ColorectumSERGO analysis - Figure of enriched GO biological processes: Top 15 enriched GO BP terms are showed in the bar plot of each disease state in each tissue. Each row represents a significant GO biological process which is colored according to the -log10(p.adjust).
ColorectumMSSGO analysis - Figure of enriched GO biological processes: Top 15 enriched GO BP terms are showed in the bar plot of each disease state in each tissue. Each row represents a significant GO biological process which is colored according to the -log10(p.adjust).
ColorectumMSI-HGO analysis - Figure of enriched GO biological processes: Top 15 enriched GO BP terms are showed in the bar plot of each disease state in each tissue. Each row represents a significant GO biological process which is colored according to the -log10(p.adjust).
ColorectumFAPGO analysis - Figure of enriched GO biological processes: Top 15 enriched GO BP terms are showed in the bar plot of each disease state in each tissue. Each row represents a significant GO biological process which is colored according to the -log10(p.adjust).
∗Top 15 enriched GO BP terms are showed in the bar plot of each disease state in each tissue. Each row represents a significant GO biological process which is colored according to the -log10(p.adjust).
Page: 1 2 3 4 5 6 7 8 9 

check button Enriched GO biological processes.
GO IDTissueDisease StageDescriptionGene RatioBg Ratiopvaluep.adjustCount
GO:0051258111EsophagusESCCprotein polymerization183/8552297/187231.94e-083.75e-07183
GO:000701527EsophagusESCCactin filament organization259/8552442/187232.37e-084.50e-07259
GO:000815420EsophagusESCCactin polymerization or depolymerization130/8552218/187232.19e-051.88e-04130
GO:0030041110EsophagusESCCactin filament polymerization114/8552191/187236.46e-054.92e-04114
GO:000701512LiverCirrhoticactin filament organization171/4634442/187233.93e-112.30e-09171
GO:005125812LiverCirrhoticprotein polymerization116/4634297/187232.87e-089.78e-07116
GO:000815412LiverCirrhoticactin polymerization or depolymerization86/4634218/187231.04e-062.13e-0586
GO:003004112LiverCirrhoticactin filament polymerization77/4634191/187231.41e-062.79e-0577
GO:005125822LiverHCCprotein polymerization182/7958297/187234.17e-111.58e-09182
GO:000701522LiverHCCactin filament organization252/7958442/187233.83e-101.25e-08252
GO:000815422LiverHCCactin polymerization or depolymerization130/7958218/187232.31e-074.14e-06130
GO:003004122LiverHCCactin filament polymerization116/7958191/187232.66e-074.68e-06116
GO:005125820Oral cavityOSCCprotein polymerization169/7305297/187232.57e-107.17e-09169
GO:000701520Oral cavityOSCCactin filament organization230/7305442/187231.37e-082.77e-07230
GO:000815418Oral cavityOSCCactin polymerization or depolymerization117/7305218/187237.38e-068.04e-05117
GO:003004118Oral cavityOSCCactin filament polymerization103/7305191/187231.94e-051.87e-04103
GO:0051258110Oral cavityLPprotein polymerization113/4623297/187231.90e-075.92e-06113
GO:0007015110Oral cavityLPactin filament organization143/4623442/187231.44e-041.65e-03143
GO:003004119Oral cavityLPactin filament polymerization69/4623191/187232.65e-042.75e-0369
GO:000815419Oral cavityLPactin polymerization or depolymerization76/4623218/187234.67e-044.42e-0376
Page: 1 2 

check button Enriched KEGG pathways.
Pathway IDTissueDisease StageDescriptionGene RatioBg Ratiopvaluep.adjustqvalueCount
Page: 1 

Top

Cell-cell communication analysis

check buttonIdentification of potential cell-cell interactions between two cell types and their ligand-receptor pairs for different disease states
LigandReceptorLRpairPathwayTissueDisease Stage
Page: 1 

Top

Single-cell gene regulatory network inference analysis

check buttonFind out the significant the regulons (TFs) and the target genes of each regulon across cell types for different disease states
TFCell TypeTissueDisease StageTarget GeneRSSRegulon Activity
∗The dot plots of a searched regulon are shown for all cell subpopulations in each disease state of each tissue based on the regulon specific score inferred using pySCENIC and by calculating the average expression.
Page: 1 

Top

Somatic mutation of malignant transformation related genes

check buttonAnnotation of somatic variants for genes involved in malignant transformation
Hugo SymbolVariant ClassVariant ClassificationdbSNP RSHGVScHGVSpHGVSp ShortSWISSPROTBIOTYPESIFTPolyPhenTumor Sample BarcodeTissueHistologySexAgeStageTherapy TypesDrugsOutcome
MSRB1insertionFrame_Shift_Insnovelc.294_295insTGTCTCAACCTCCCAAAGTGCCGGGATTATAGGCGTGp.Ser99CysfsTer?p.S99Cfs*?Q9NZV6protein_codingTCGA-A8-A07R-01Breastbreast invasive carcinomaFemale>=65III/IVAncillaryzoledronicSD
MSRB1SNVMissense_Mutationrs748260206c.278N>Ap.Arg93Glnp.R93QQ9NZV6protein_codingdeleterious(0)possibly_damaging(0.801)TCGA-D5-6540-01Colorectumcolon adenocarcinomaMale>=65I/IIUnknownUnknownSD
MSRB1SNVMissense_Mutationrs760850788c.173N>Ap.Arg58Hisp.R58HQ9NZV6protein_codingtolerated(0.6)benign(0)TCGA-EI-6882-01Colorectumrectum adenocarcinomaMale<65I/IIUnknownUnknownSD
MSRB1SNVMissense_Mutationrs373673022c.119C>Tp.Ser40Leup.S40LQ9NZV6protein_codingtolerated(0.06)probably_damaging(0.931)TCGA-A5-A1OH-01Endometriumuterine corpus endometrioid carcinomaFemale>=65III/IVChemotherapycarboplatinCR
MSRB1SNVMissense_Mutationrs755400235c.58N>Ap.Val20Ilep.V20IQ9NZV6protein_codingtolerated(1)benign(0)TCGA-AP-A0LM-01Endometriumuterine corpus endometrioid carcinomaFemale<65III/IVChemotherapycisplatinSD
MSRB1SNVMissense_Mutationc.335N>Tp.Ala112Valp.A112VQ9NZV6protein_codingtolerated(0.28)benign(0)TCGA-B5-A11U-01Endometriumuterine corpus endometrioid carcinomaFemale>=65III/IVUnknownUnknownSD
MSRB1SNVMissense_Mutationrs770241137c.188G>Tp.Arg63Ilep.R63IQ9NZV6protein_codingdeleterious(0.01)benign(0.214)TCGA-BK-A6W3-01Endometriumuterine corpus endometrioid carcinomaFemale<65I/IIUnknownUnknownSD
MSRB1SNVMissense_Mutationnovelc.191N>Tp.Ser64Phep.S64FQ9NZV6protein_codingdeleterious(0.01)benign(0.049)TCGA-FI-A2D0-01Endometriumuterine corpus endometrioid carcinomaFemale<65I/IIUnknownUnknownSD
MSRB1SNVMissense_Mutationnovelc.314N>Gp.Pro105Argp.P105RQ9NZV6protein_codingdeleterious(0)possibly_damaging(0.863)TCGA-XR-A8TF-01Liverliver hepatocellular carcinomaMale>=65I/IIUnknownUnknownPD
MSRB1deletionFrame_Shift_Delnovelc.15_39delCTTCTTCGGGGGCGAGGTTTTCCAGp.Ser5ArgfsTer55p.S5Rfs*55Q9NZV6protein_codingTCGA-G3-A5SK-01Liverliver hepatocellular carcinomaMale<65I/IIUnknownUnknownPD
Page: 1 2 

Top

Related drugs of malignant transformation related genes

check buttonIdentification of chemicals and drugs interact with genes involved in malignant transfromation
(DGIdb 4.0)
Entrez IDSymbolCategoryInteraction TypesDrug Claim NameDrug NamePMIDs
Page: 1