| Tissue | Expression Dynamics | Abbreviation |
| Esophagus |  | ESCC: Esophageal squamous cell carcinoma |
| HGIN: High-grade intraepithelial neoplasias |
| LGIN: Low-grade intraepithelial neoplasias |
| Oral Cavity | 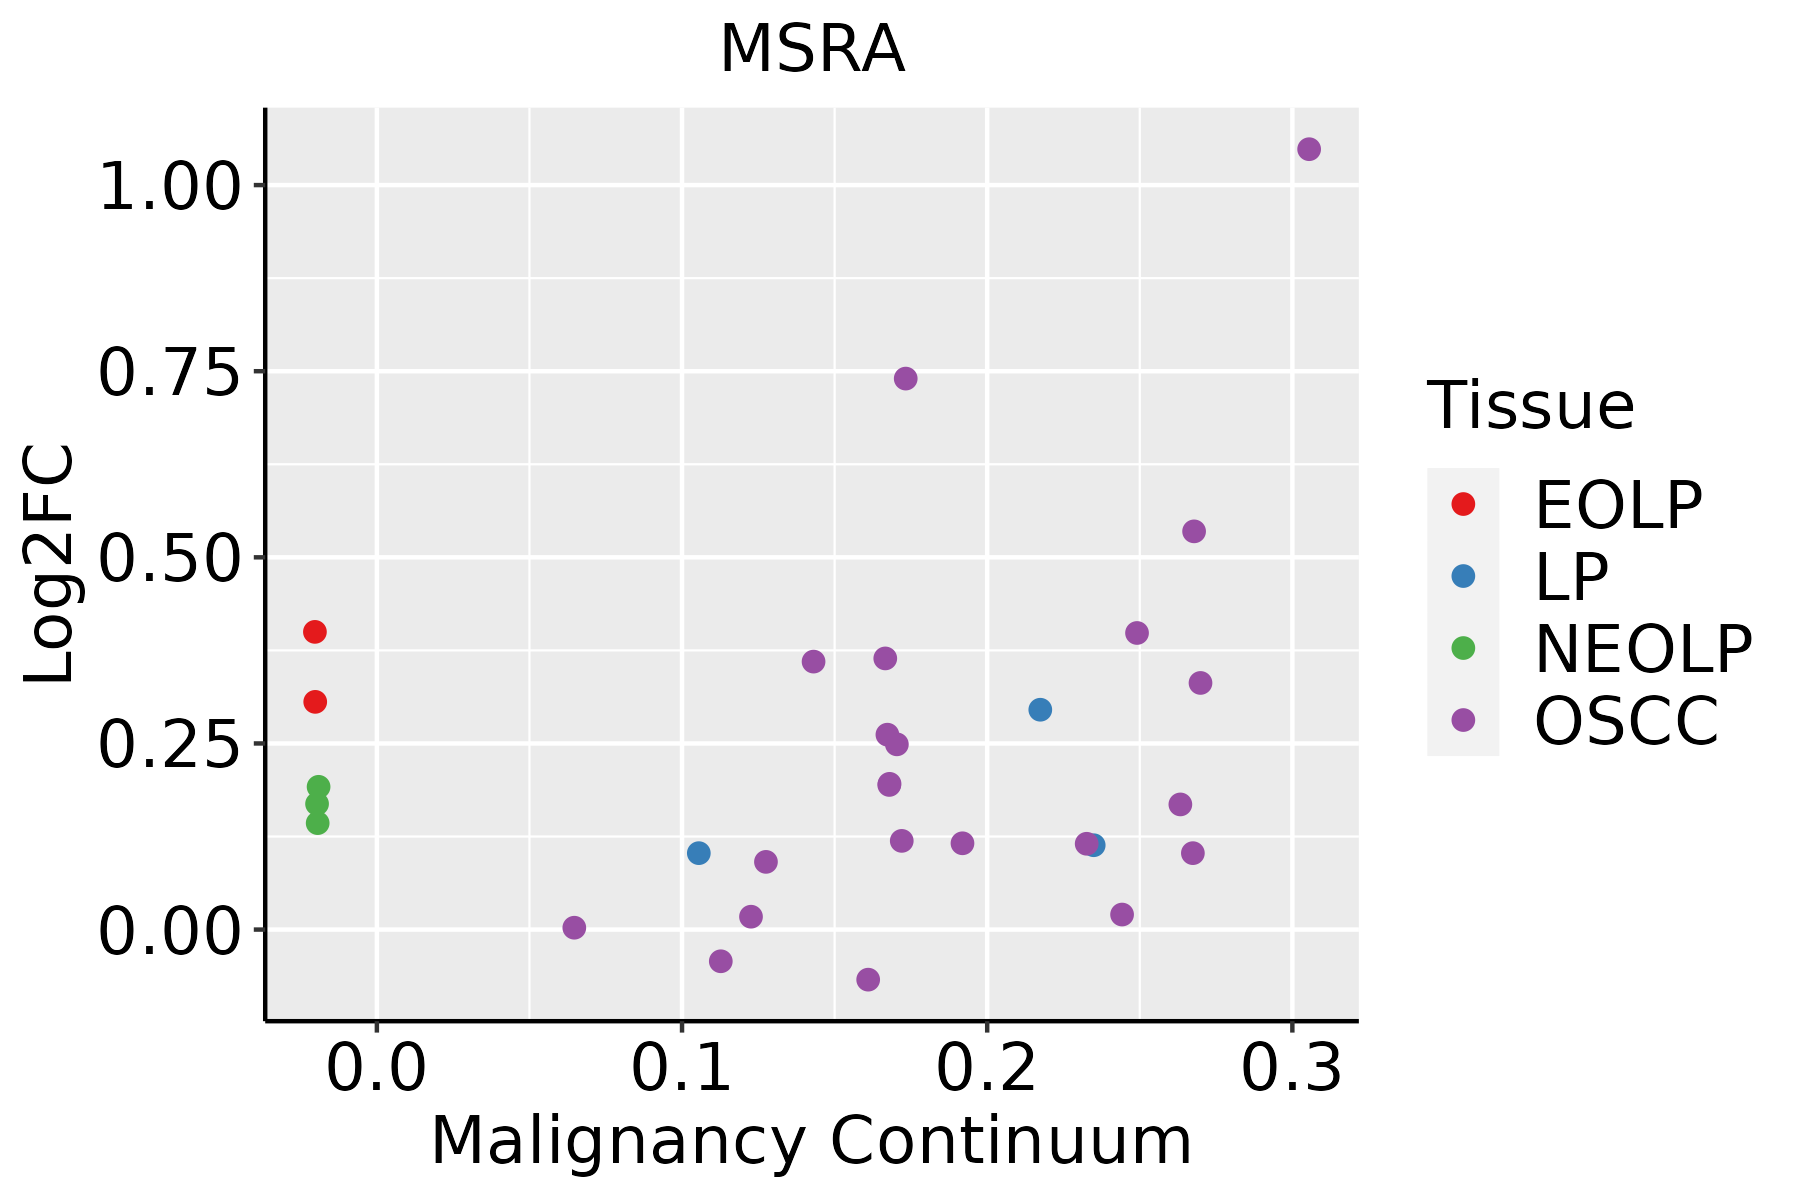 | EOLP: Erosive Oral lichen planus |
| LP: leukoplakia |
| NEOLP: Non-erosive oral lichen planus |
| OSCC: Oral squamous cell carcinoma |
| Thyroid | 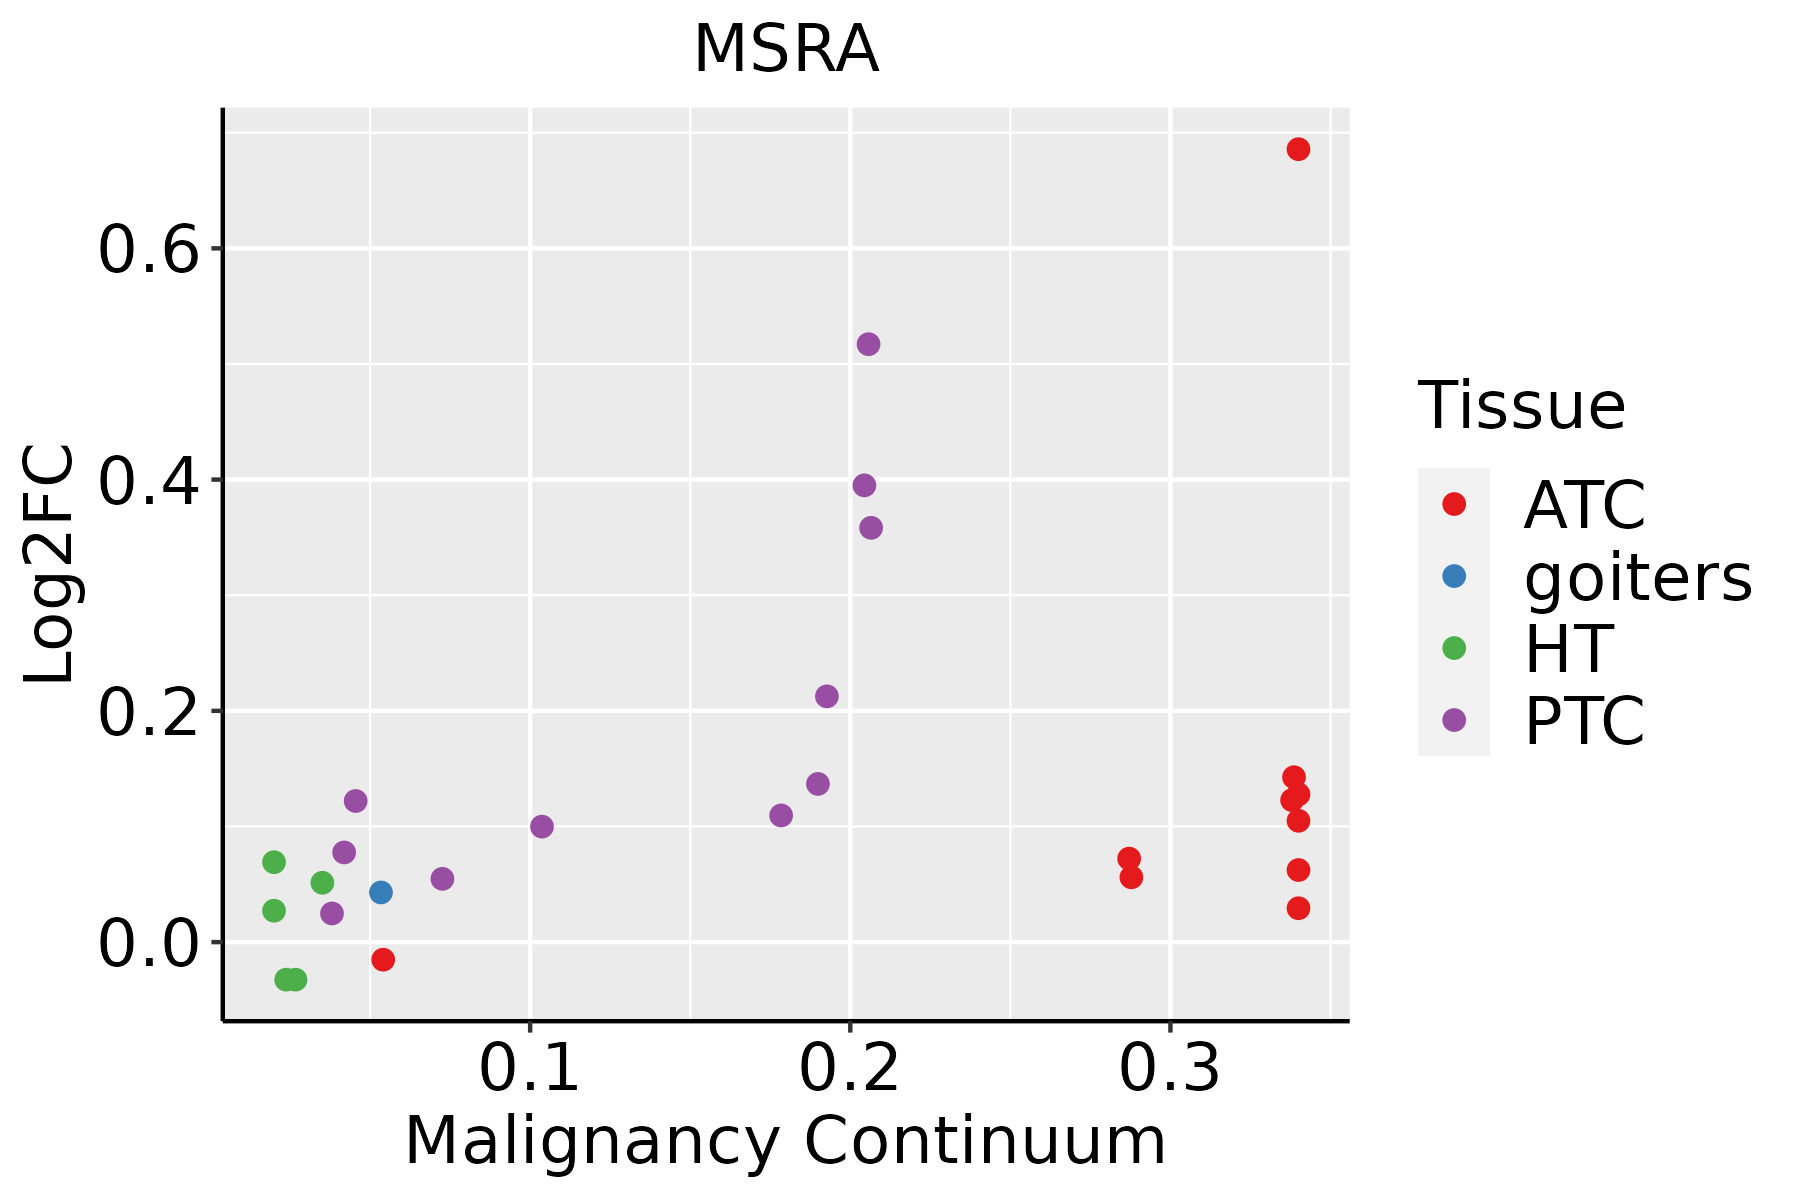 | ATC: Anaplastic thyroid cancer |
| HT: Hashimoto's thyroiditis |
| PTC: Papillary thyroid cancer |
| GO ID | Tissue | Disease Stage | Description | Gene Ratio | Bg Ratio | pvalue | p.adjust | Count |
| GO:0006979111 | Esophagus | ESCC | response to oxidative stress | 303/8552 | 446/18723 | 7.15e-22 | 1.30e-19 | 303 |
| GO:0062197111 | Esophagus | ESCC | cellular response to chemical stress | 234/8552 | 337/18723 | 5.37e-19 | 5.97e-17 | 234 |
| GO:0034599111 | Esophagus | ESCC | cellular response to oxidative stress | 197/8552 | 288/18723 | 3.76e-15 | 2.15e-13 | 197 |
| GO:00067906 | Esophagus | ESCC | sulfur compound metabolic process | 201/8552 | 339/18723 | 2.64e-07 | 3.94e-06 | 201 |
| GO:000697920 | Oral cavity | OSCC | response to oxidative stress | 273/7305 | 446/18723 | 8.35e-22 | 1.65e-19 | 273 |
| GO:006219720 | Oral cavity | OSCC | cellular response to chemical stress | 204/7305 | 337/18723 | 6.89e-16 | 5.19e-14 | 204 |
| GO:003459920 | Oral cavity | OSCC | cellular response to oxidative stress | 173/7305 | 288/18723 | 2.90e-13 | 1.43e-11 | 173 |
| GO:00067905 | Oral cavity | OSCC | sulfur compound metabolic process | 168/7305 | 339/18723 | 4.50e-05 | 3.84e-04 | 168 |
| GO:000697926 | Oral cavity | EOLP | response to oxidative stress | 87/2218 | 446/18723 | 1.62e-06 | 3.80e-05 | 87 |
| GO:006219726 | Oral cavity | EOLP | cellular response to chemical stress | 64/2218 | 337/18723 | 8.49e-05 | 1.01e-03 | 64 |
| GO:003459925 | Oral cavity | EOLP | cellular response to oxidative stress | 54/2218 | 288/18723 | 4.04e-04 | 3.58e-03 | 54 |
| GO:000697933 | Oral cavity | NEOLP | response to oxidative stress | 94/2005 | 446/18723 | 7.53e-11 | 8.58e-09 | 94 |
| GO:006219733 | Oral cavity | NEOLP | cellular response to chemical stress | 75/2005 | 337/18723 | 4.87e-10 | 3.97e-08 | 75 |
| GO:003459933 | Oral cavity | NEOLP | cellular response to oxidative stress | 61/2005 | 288/18723 | 1.33e-07 | 4.67e-06 | 61 |
| GO:0006979113 | Thyroid | PTC | response to oxidative stress | 234/5968 | 446/18723 | 6.97e-20 | 9.77e-18 | 234 |
| GO:0062197113 | Thyroid | PTC | cellular response to chemical stress | 180/5968 | 337/18723 | 1.36e-16 | 1.16e-14 | 180 |
| GO:0034599113 | Thyroid | PTC | cellular response to oxidative stress | 151/5968 | 288/18723 | 2.82e-13 | 1.43e-11 | 151 |
| GO:00065552 | Thyroid | PTC | methionine metabolic process | 11/5968 | 16/18723 | 2.70e-03 | 1.36e-02 | 11 |
| GO:00000963 | Thyroid | PTC | sulfur amino acid metabolic process | 18/5968 | 34/18723 | 8.65e-03 | 3.62e-02 | 18 |
| GO:000697934 | Thyroid | ATC | response to oxidative stress | 246/6293 | 446/18723 | 2.98e-21 | 6.09e-19 | 246 |
| Hugo Symbol | Variant Class | Variant Classification | dbSNP RS | HGVSc | HGVSp | HGVSp Short | SWISSPROT | BIOTYPE | SIFT | PolyPhen | Tumor Sample Barcode | Tissue | Histology | Sex | Age | Stage | Therapy Types | Drugs | Outcome |
| MSRA | SNV | Missense_Mutation | novel | c.298N>G | p.Thr100Ala | p.T100A | Q9UJ68 | protein_coding | deleterious(0) | probably_damaging(0.923) | TCGA-A2-A0EP-01 | Breast | breast invasive carcinoma | Female | <65 | I/II | Chemotherapy | cyclophosphamide | CR |
| MSRA | SNV | Missense_Mutation | novel | c.274C>G | p.Gln92Glu | p.Q92E | Q9UJ68 | protein_coding | deleterious(0.01) | possibly_damaging(0.85) | TCGA-C5-A1MH-01 | Cervix | cervical & endocervical cancer | Female | >=65 | III/IV | Chemotherapy | cisplatin | PD |
| MSRA | SNV | Missense_Mutation | | c.131N>T | p.Thr44Ile | p.T44I | Q9UJ68 | protein_coding | tolerated(0.92) | benign(0) | TCGA-AZ-6599-01 | Colorectum | colon adenocarcinoma | Male | >=65 | I/II | Unknown | Unknown | SD |
| MSRA | SNV | Missense_Mutation | | c.443N>A | p.Arg148His | p.R148H | Q9UJ68 | protein_coding | deleterious(0) | probably_damaging(0.983) | TCGA-CM-6166-01 | Colorectum | colon adenocarcinoma | Female | <65 | I/II | Unknown | Unknown | SD |
| MSRA | SNV | Missense_Mutation | rs755860421 | c.622N>A | p.His208Asn | p.H208N | Q9UJ68 | protein_coding | deleterious(0) | probably_damaging(1) | TCGA-A5-A0G1-01 | Endometrium | uterine corpus endometrioid carcinoma | Female | >=65 | I/II | Unknown | Unknown | SD |
| MSRA | SNV | Missense_Mutation | novel | c.376G>A | p.Glu126Lys | p.E126K | Q9UJ68 | protein_coding | tolerated(0.67) | benign(0.031) | TCGA-A5-A0G2-01 | Endometrium | uterine corpus endometrioid carcinoma | Female | <65 | III/IV | Unknown | Unknown | SD |
| MSRA | SNV | Missense_Mutation | novel | c.26G>A | p.Cys9Tyr | p.C9Y | Q9UJ68 | protein_coding | tolerated_low_confidence(0.28) | benign(0.006) | TCGA-AJ-A2QO-01 | Endometrium | uterine corpus endometrioid carcinoma | Female | >=65 | I/II | Unknown | Unknown | SD |
| MSRA | SNV | Missense_Mutation | novel | c.436N>T | p.Gly146Cys | p.G146C | Q9UJ68 | protein_coding | deleterious(0) | probably_damaging(1) | TCGA-AX-A05Z-01 | Endometrium | uterine corpus endometrioid carcinoma | Female | <65 | III/IV | Chemotherapy | adriamycin | SD |
| MSRA | SNV | Missense_Mutation | novel | c.239N>T | p.Arg80Met | p.R80M | Q9UJ68 | protein_coding | deleterious(0) | probably_damaging(0.989) | TCGA-AX-A06F-01 | Endometrium | uterine corpus endometrioid carcinoma | Female | <65 | III/IV | Chemotherapy | carboplatin | SD |
| MSRA | SNV | Missense_Mutation | rs780558371 | c.454N>A | p.Asp152Asn | p.D152N | Q9UJ68 | protein_coding | deleterious(0.01) | probably_damaging(1) | TCGA-AX-A1CE-01 | Endometrium | uterine corpus endometrioid carcinoma | Female | <65 | I/II | Unspecific | Paclitaxel | SD |


