
|
|||||
|
 | |
| |
| |
| |
| |
| |
|
Gene: MSN |
Gene summary for MSN |
| Gene information | Species | Human | Gene symbol | MSN | Gene ID | 4478 |
| Gene name | moesin | |
| Gene Alias | HEL70 | |
| Cytomap | Xq12 | |
| Gene Type | protein-coding | GO ID | GO:0000902 | UniProtAcc | P26038 |
Top |
Malignant transformation analysis |
| Identification of the aberrant gene expression in precancerous and cancerous lesions by comparing the gene expression of stem-like cells in diseased tissues with normal stem cells |
| Entrez ID | Symbol | Replicates | Species | Organ | Tissue | Adj P-value | Log2FC | Malignancy |
| 4478 | MSN | LZE4T | Human | Esophagus | ESCC | 6.82e-26 | 1.36e+00 | 0.0811 |
| 4478 | MSN | LZE7T | Human | Esophagus | ESCC | 1.14e-04 | 9.29e-01 | 0.0667 |
| 4478 | MSN | LZE8T | Human | Esophagus | ESCC | 2.22e-05 | 4.44e-01 | 0.067 |
| 4478 | MSN | LZE6T | Human | Esophagus | ESCC | 2.08e-14 | 1.06e+00 | 0.0845 |
| 4478 | MSN | P2T-E | Human | Esophagus | ESCC | 1.12e-49 | 9.76e-01 | 0.1177 |
| 4478 | MSN | P4T-E | Human | Esophagus | ESCC | 1.34e-18 | 3.39e-01 | 0.1323 |
| 4478 | MSN | P5T-E | Human | Esophagus | ESCC | 5.63e-32 | 8.52e-01 | 0.1327 |
| 4478 | MSN | P8T-E | Human | Esophagus | ESCC | 1.09e-12 | 2.90e-01 | 0.0889 |
| 4478 | MSN | P9T-E | Human | Esophagus | ESCC | 3.24e-20 | 7.54e-01 | 0.1131 |
| 4478 | MSN | P10T-E | Human | Esophagus | ESCC | 1.00e-15 | 4.57e-01 | 0.116 |
| 4478 | MSN | P11T-E | Human | Esophagus | ESCC | 4.71e-22 | 1.38e+00 | 0.1426 |
| 4478 | MSN | P12T-E | Human | Esophagus | ESCC | 6.60e-05 | -2.15e-02 | 0.1122 |
| 4478 | MSN | P15T-E | Human | Esophagus | ESCC | 1.32e-16 | 7.57e-01 | 0.1149 |
| 4478 | MSN | P16T-E | Human | Esophagus | ESCC | 3.40e-31 | 5.91e-01 | 0.1153 |
| 4478 | MSN | P17T-E | Human | Esophagus | ESCC | 1.52e-19 | 1.30e+00 | 0.1278 |
| 4478 | MSN | P19T-E | Human | Esophagus | ESCC | 1.40e-13 | 1.88e+00 | 0.1662 |
| 4478 | MSN | P20T-E | Human | Esophagus | ESCC | 1.87e-29 | 9.82e-01 | 0.1124 |
| 4478 | MSN | P21T-E | Human | Esophagus | ESCC | 1.48e-56 | 1.39e+00 | 0.1617 |
| 4478 | MSN | P22T-E | Human | Esophagus | ESCC | 1.49e-42 | 9.32e-01 | 0.1236 |
| 4478 | MSN | P23T-E | Human | Esophagus | ESCC | 6.26e-11 | 5.54e-01 | 0.108 |
| Page: 1 2 3 4 5 6 7 8 |
| Tissue | Expression Dynamics | Abbreviation |
| Esophagus | 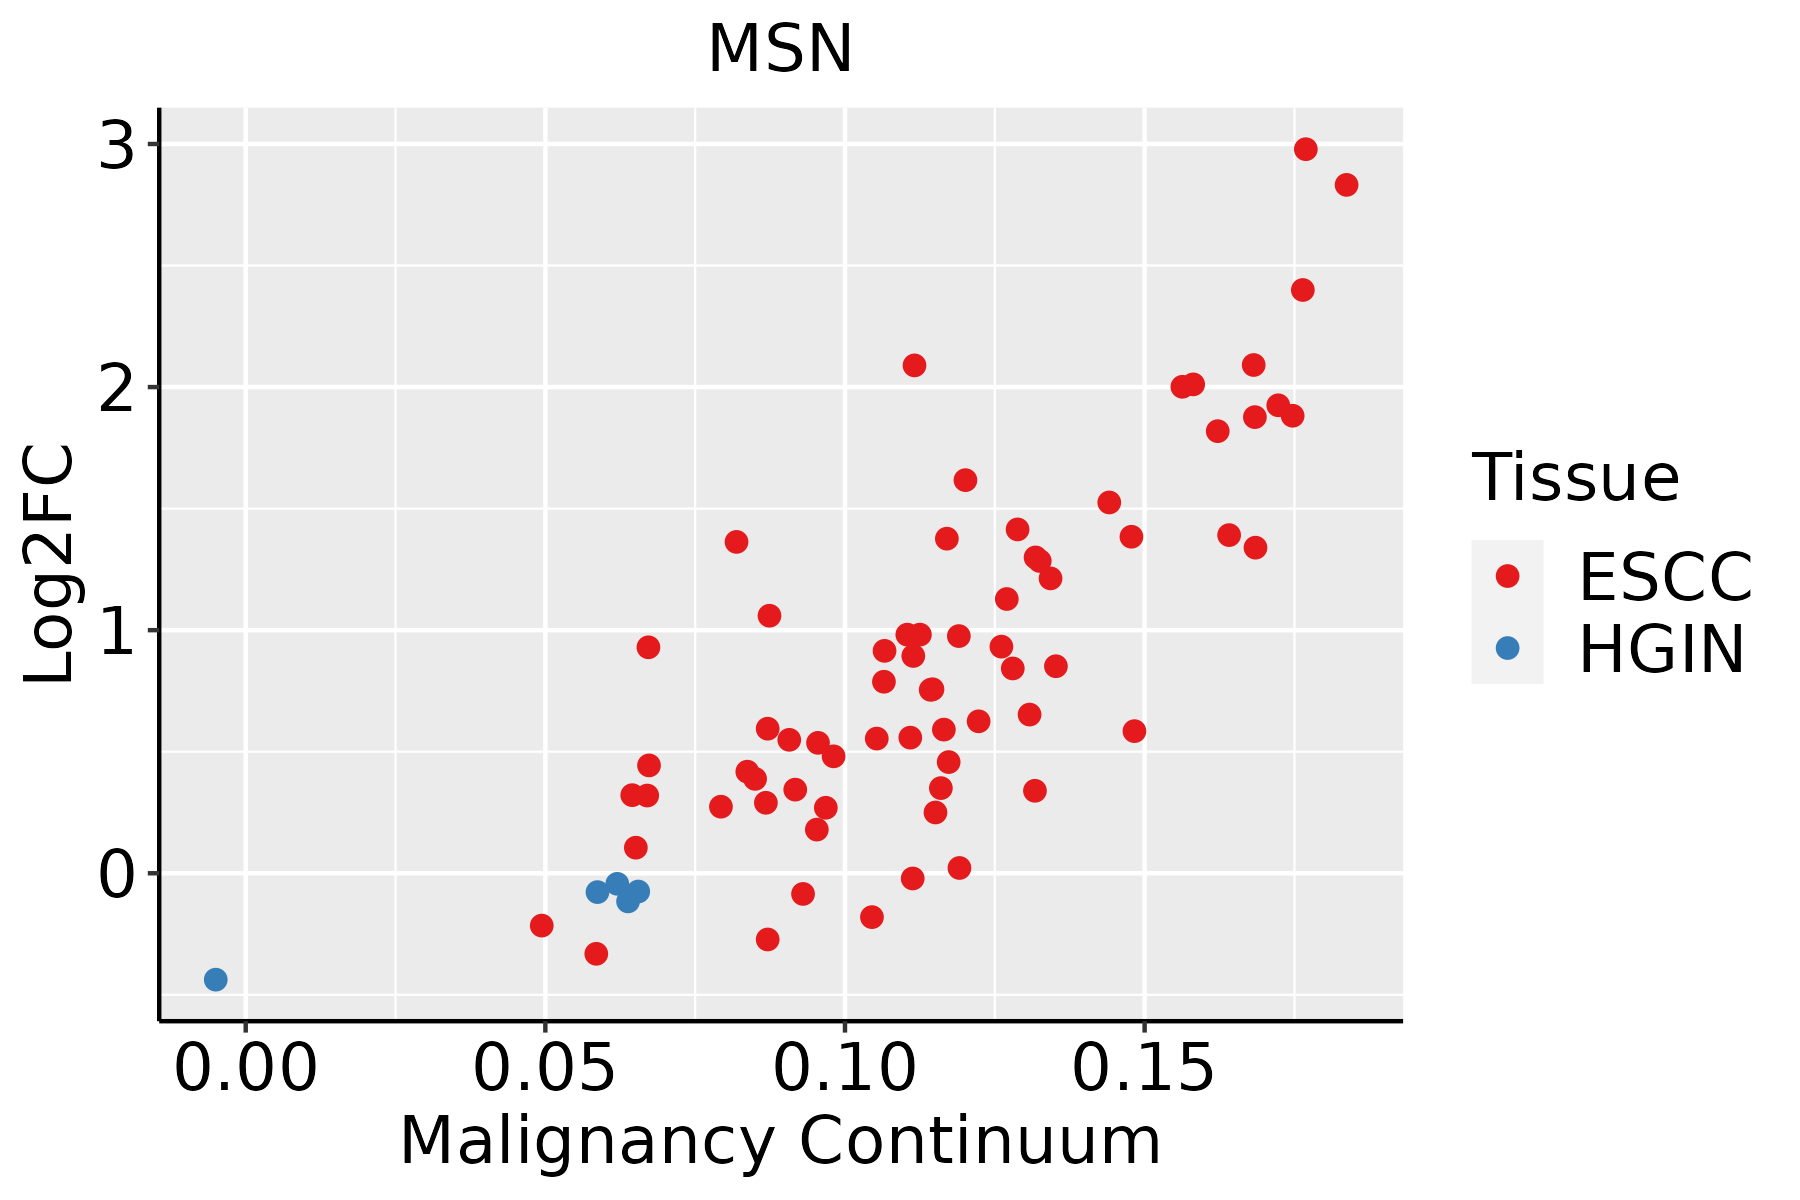 | ESCC: Esophageal squamous cell carcinoma |
| HGIN: High-grade intraepithelial neoplasias | ||
| LGIN: Low-grade intraepithelial neoplasias | ||
| Liver | 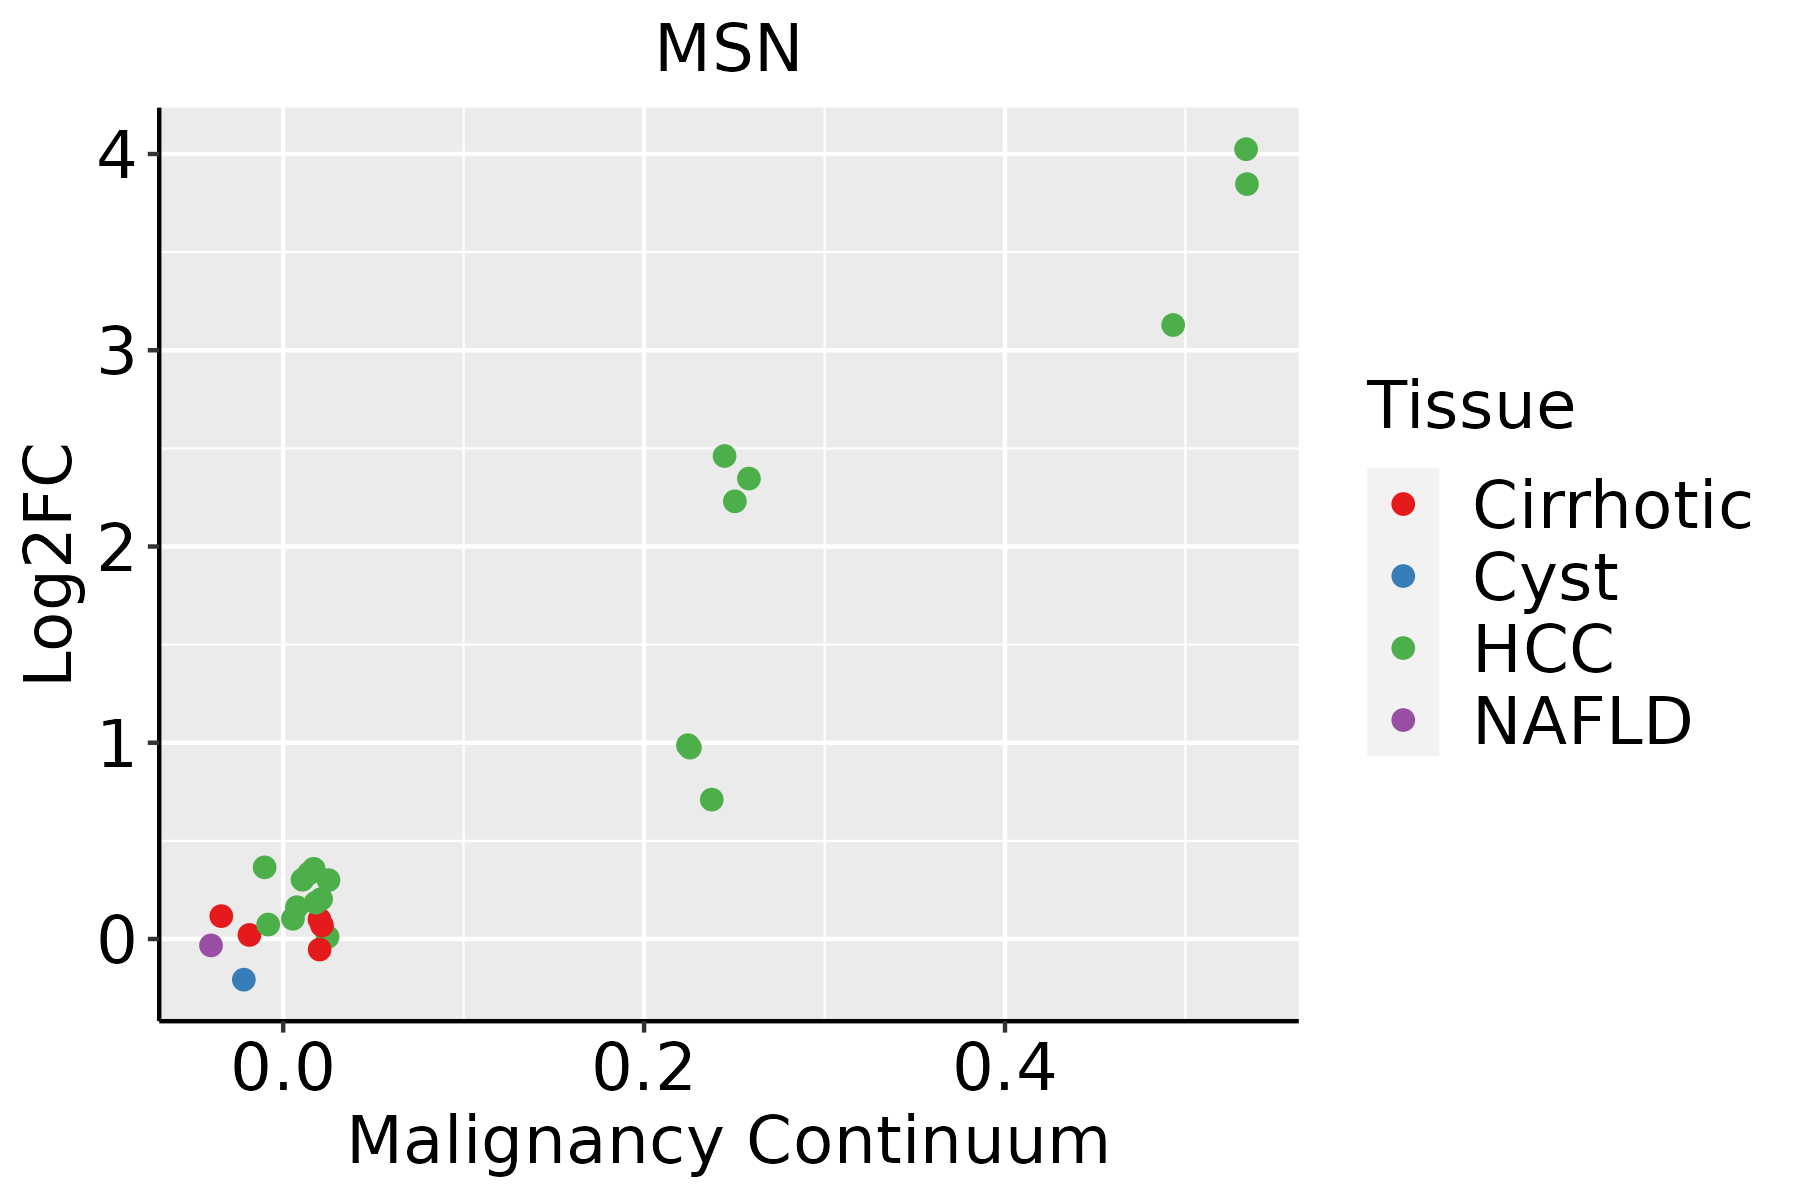 | HCC: Hepatocellular carcinoma |
| NAFLD: Non-alcoholic fatty liver disease | ||
| Lung |  | AAH: Atypical adenomatous hyperplasia |
| AIS: Adenocarcinoma in situ | ||
| IAC: Invasive lung adenocarcinoma | ||
| MIA: Minimally invasive adenocarcinoma | ||
| Oral Cavity | 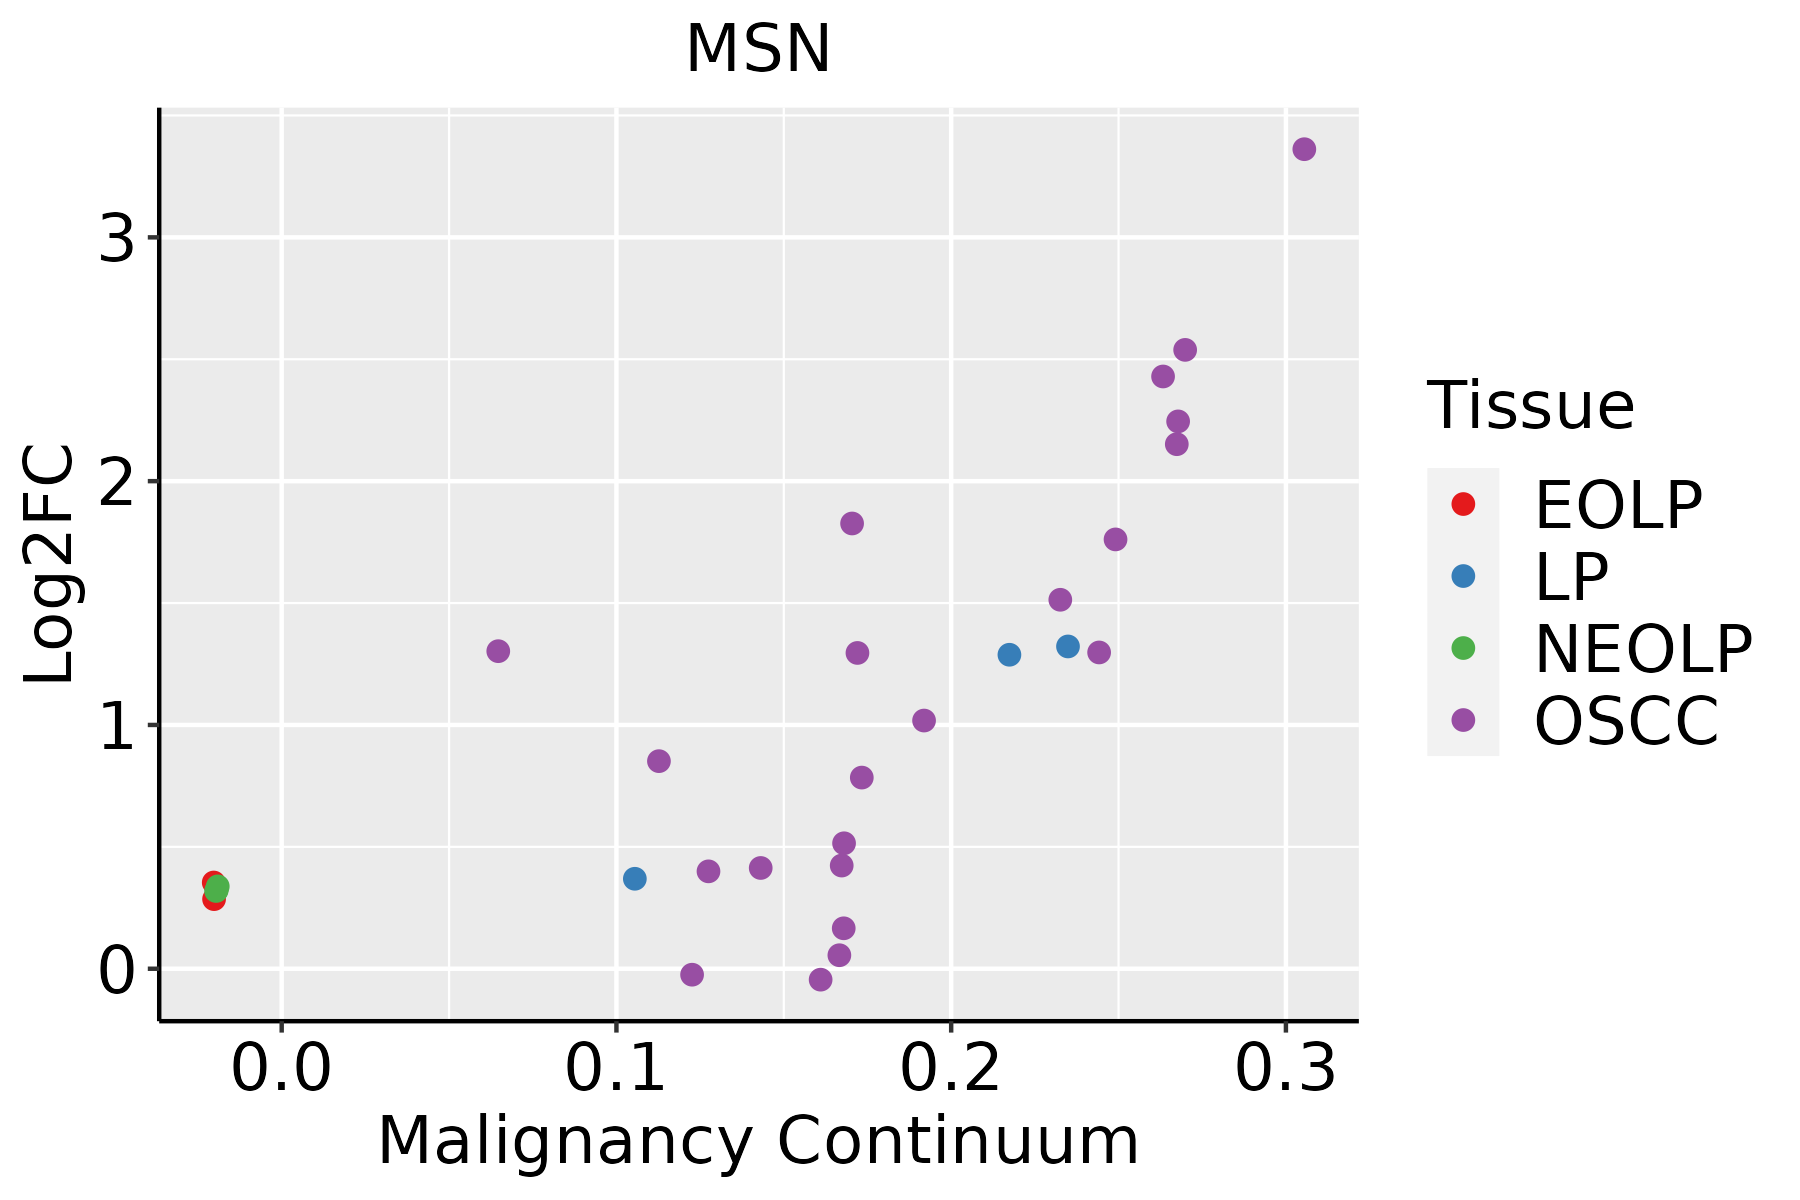 | EOLP: Erosive Oral lichen planus |
| LP: leukoplakia | ||
| NEOLP: Non-erosive oral lichen planus | ||
| OSCC: Oral squamous cell carcinoma | ||
| Prostate | 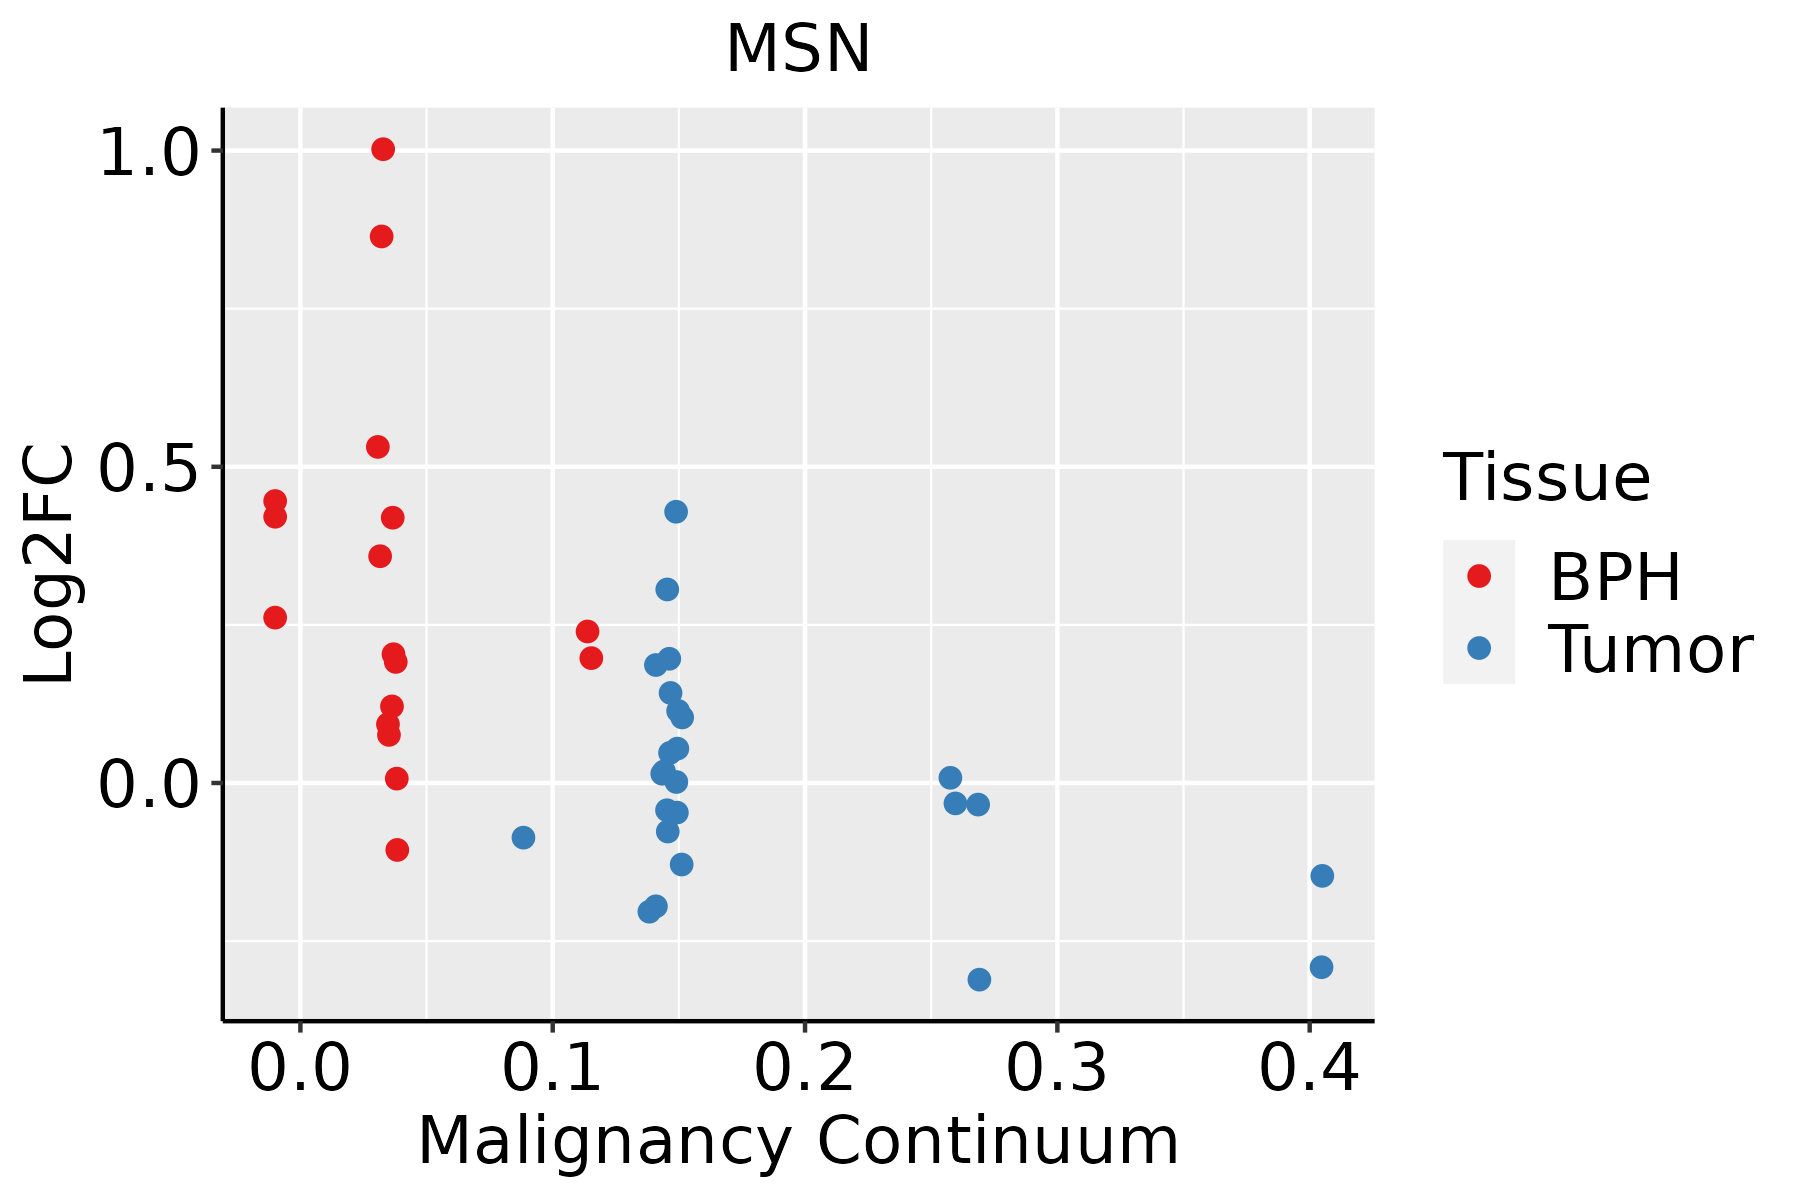 | BPH: Benign Prostatic Hyperplasia |
| Skin | 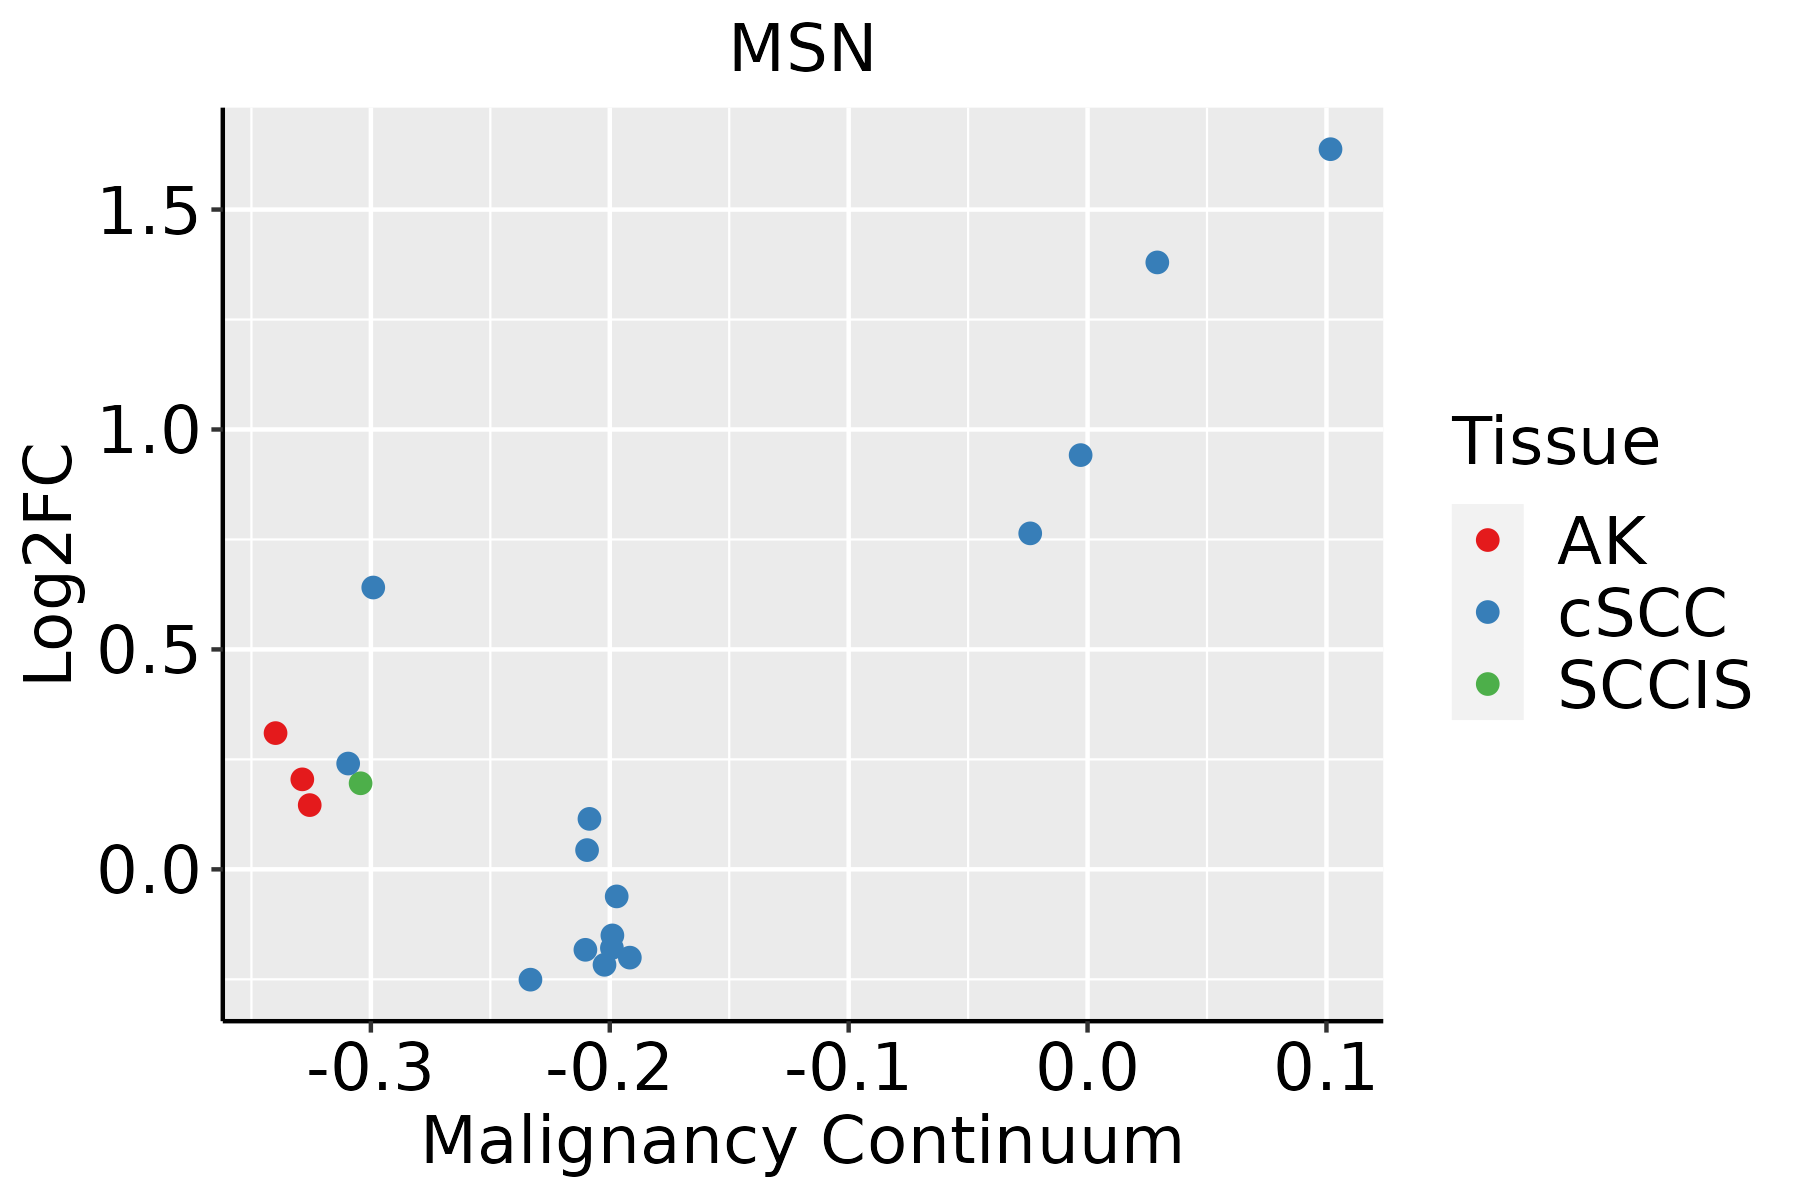 | AK: Actinic keratosis |
| cSCC: Cutaneous squamous cell carcinoma | ||
| SCCIS:squamous cell carcinoma in situ | ||
| Thyroid | 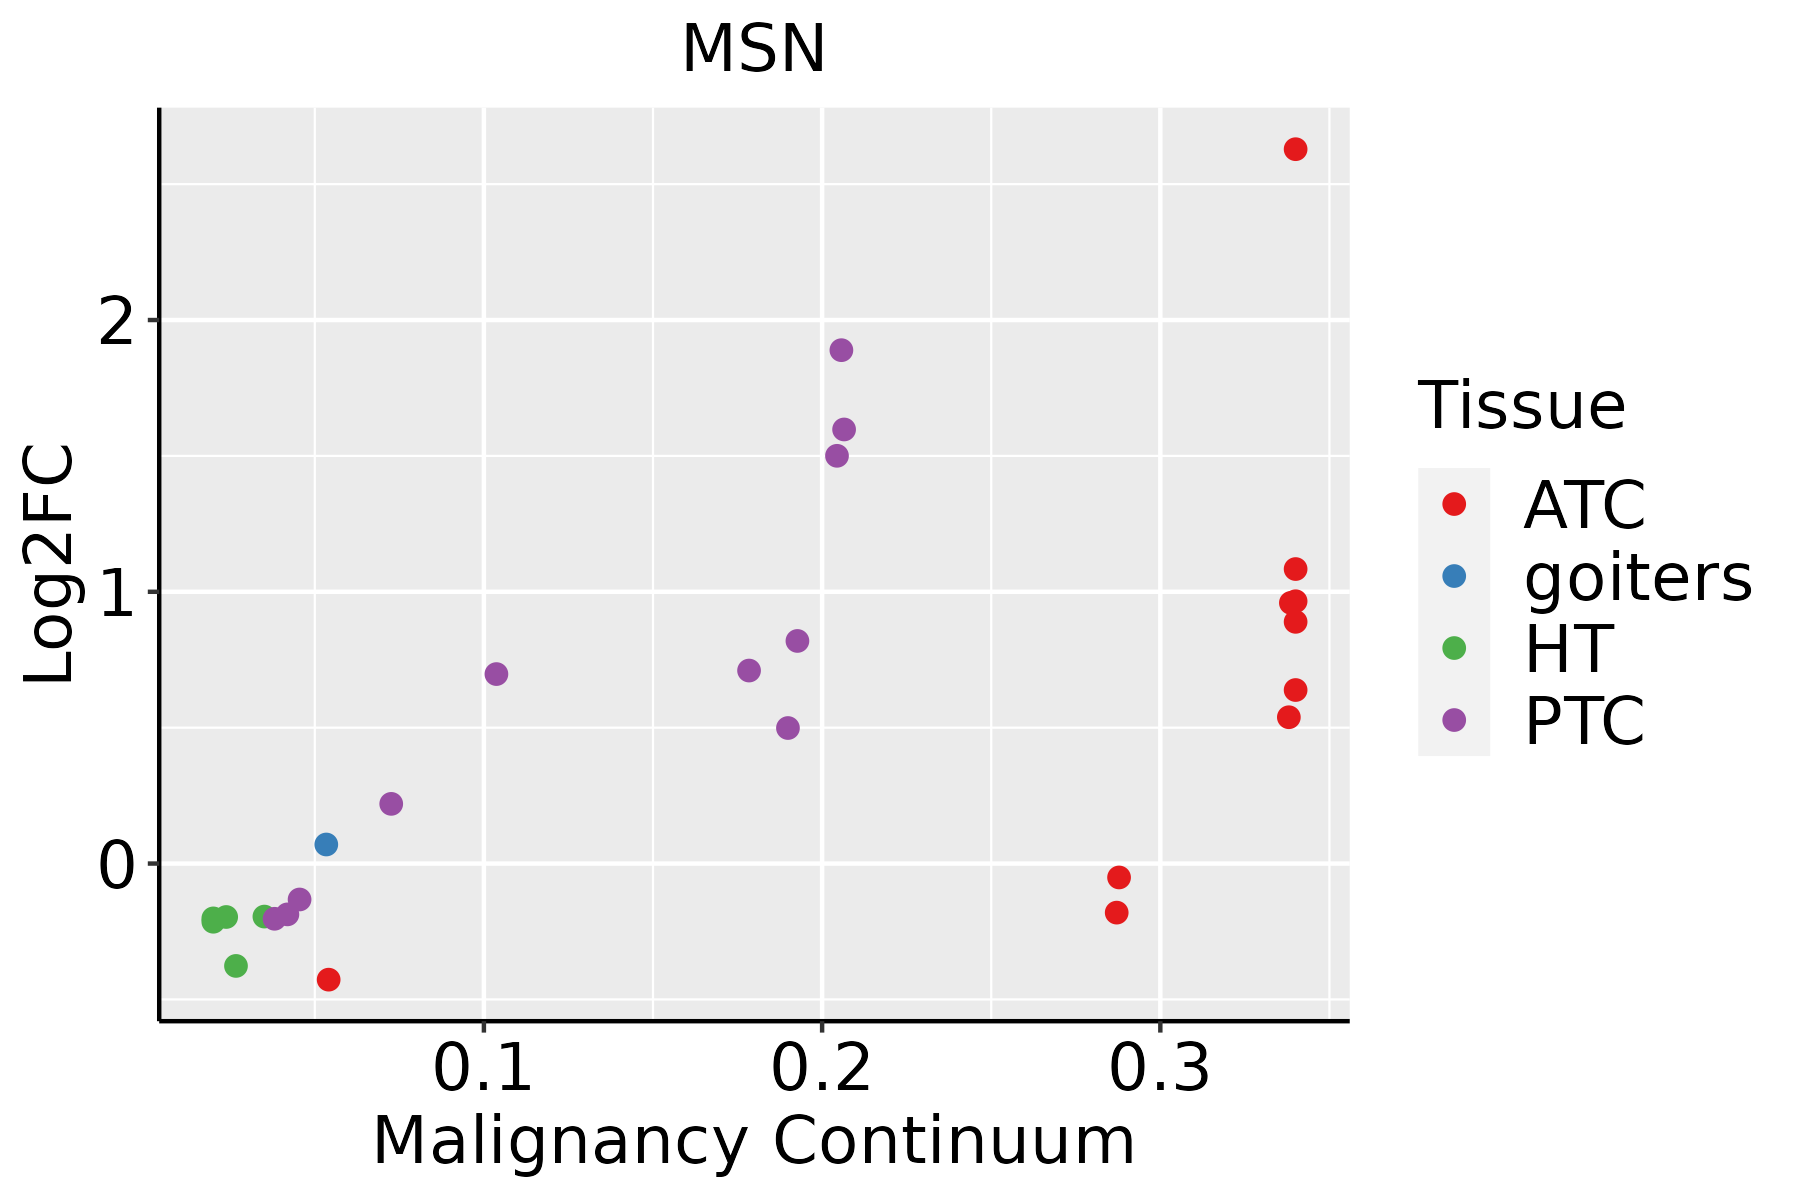 | ATC: Anaplastic thyroid cancer |
| HT: Hashimoto's thyroiditis | ||
| PTC: Papillary thyroid cancer |
| ∗log2FC in expression of this searched gene in stem-like cells from each diseased tissue sample relative to stem-like cells in normal samples in each tissue plotted against the malignancy continuum. Samples are colored based on if they are from different disease stage. |
Top |
Malignant transformation related pathway analysis |
| Find out the enriched GO biological processes and KEGG pathways involved in transition from healthy to precancer to cancer |
| Tissue | Disease Stage | Enriched GO biological Processes |
| Colorectum | AD |  |
| Colorectum | SER |  |
| Colorectum | MSS |  |
| Colorectum | MSI-H |  |
| Colorectum | FAP |  |
| ∗Top 15 enriched GO BP terms are showed in the bar plot of each disease state in each tissue. Each row represents a significant GO biological process which is colored according to the -log10(p.adjust). |
| Page: 1 2 3 4 5 6 7 8 9 |
| GO ID | Tissue | Disease Stage | Description | Gene Ratio | Bg Ratio | pvalue | p.adjust | Count |
| GO:00026837 | Cervix | CC | negative regulation of immune system process | 94/2311 | 434/18723 | 2.63e-08 | 1.87e-06 | 94 |
| GO:004593610 | Cervix | CC | negative regulation of phosphate metabolic process | 88/2311 | 441/18723 | 2.92e-06 | 8.27e-05 | 88 |
| GO:001056310 | Cervix | CC | negative regulation of phosphorus metabolic process | 88/2311 | 442/18723 | 3.21e-06 | 8.77e-05 | 88 |
| GO:004232610 | Cervix | CC | negative regulation of phosphorylation | 77/2311 | 385/18723 | 1.09e-05 | 2.38e-04 | 77 |
| GO:0051250 | Cervix | CC | negative regulation of lymphocyte activation | 39/2311 | 157/18723 | 1.23e-05 | 2.57e-04 | 39 |
| GO:000193310 | Cervix | CC | negative regulation of protein phosphorylation | 69/2311 | 342/18723 | 2.29e-05 | 4.01e-04 | 69 |
| GO:0002695 | Cervix | CC | negative regulation of leukocyte activation | 43/2311 | 187/18723 | 3.47e-05 | 5.60e-04 | 43 |
| GO:0050866 | Cervix | CC | negative regulation of cell activation | 44/2311 | 210/18723 | 2.76e-04 | 3.02e-03 | 44 |
| GO:00507773 | Cervix | CC | negative regulation of immune response | 41/2311 | 194/18723 | 3.63e-04 | 3.76e-03 | 41 |
| GO:0002819 | Cervix | CC | regulation of adaptive immune response | 35/2311 | 183/18723 | 5.38e-03 | 3.11e-02 | 35 |
| GO:000268312 | Cervix | HSIL_HPV | negative regulation of immune system process | 39/737 | 434/18723 | 1.51e-06 | 6.60e-05 | 39 |
| GO:004593615 | Cervix | HSIL_HPV | negative regulation of phosphate metabolic process | 36/737 | 441/18723 | 3.12e-05 | 8.94e-04 | 36 |
| GO:001056315 | Cervix | HSIL_HPV | negative regulation of phosphorus metabolic process | 36/737 | 442/18723 | 3.27e-05 | 9.16e-04 | 36 |
| GO:000193314 | Cervix | HSIL_HPV | negative regulation of protein phosphorylation | 30/737 | 342/18723 | 3.80e-05 | 1.03e-03 | 30 |
| GO:004232614 | Cervix | HSIL_HPV | negative regulation of phosphorylation | 32/737 | 385/18723 | 6.03e-05 | 1.44e-03 | 32 |
| GO:0050864 | Cervix | HSIL_HPV | regulation of B cell activation | 19/737 | 198/18723 | 3.19e-04 | 5.15e-03 | 19 |
| GO:00028191 | Cervix | HSIL_HPV | regulation of adaptive immune response | 17/737 | 183/18723 | 9.31e-04 | 1.18e-02 | 17 |
| GO:00026951 | Cervix | HSIL_HPV | negative regulation of leukocyte activation | 17/737 | 187/18723 | 1.18e-03 | 1.41e-02 | 17 |
| GO:00512501 | Cervix | HSIL_HPV | negative regulation of lymphocyte activation | 15/737 | 157/18723 | 1.37e-03 | 1.56e-02 | 15 |
| GO:00508661 | Cervix | HSIL_HPV | negative regulation of cell activation | 18/737 | 210/18723 | 1.68e-03 | 1.81e-02 | 18 |
| Page: 1 2 3 4 5 6 7 8 9 10 11 12 13 14 15 16 17 18 19 20 21 22 23 24 25 26 27 28 29 30 31 32 33 34 35 36 37 38 |
| Pathway ID | Tissue | Disease Stage | Description | Gene Ratio | Bg Ratio | pvalue | p.adjust | qvalue | Count |
| hsa0520529 | Esophagus | ESCC | Proteoglycans in cancer | 138/4205 | 205/8465 | 1.79e-07 | 1.40e-06 | 7.15e-07 | 138 |
| hsa051629 | Esophagus | ESCC | Measles | 90/4205 | 139/8465 | 2.16e-04 | 7.87e-04 | 4.03e-04 | 90 |
| hsa04530211 | Esophagus | ESCC | Tight junction | 105/4205 | 169/8465 | 6.73e-04 | 2.23e-03 | 1.14e-03 | 105 |
| hsa0481028 | Esophagus | ESCC | Regulation of actin cytoskeleton | 133/4205 | 229/8465 | 5.94e-03 | 1.48e-02 | 7.56e-03 | 133 |
| hsa0520537 | Esophagus | ESCC | Proteoglycans in cancer | 138/4205 | 205/8465 | 1.79e-07 | 1.40e-06 | 7.15e-07 | 138 |
| hsa0516213 | Esophagus | ESCC | Measles | 90/4205 | 139/8465 | 2.16e-04 | 7.87e-04 | 4.03e-04 | 90 |
| hsa04530310 | Esophagus | ESCC | Tight junction | 105/4205 | 169/8465 | 6.73e-04 | 2.23e-03 | 1.14e-03 | 105 |
| hsa04810112 | Esophagus | ESCC | Regulation of actin cytoskeleton | 133/4205 | 229/8465 | 5.94e-03 | 1.48e-02 | 7.56e-03 | 133 |
| hsa0453022 | Liver | Cirrhotic | Tight junction | 82/2530 | 169/8465 | 2.14e-07 | 2.85e-06 | 1.76e-06 | 82 |
| hsa0481021 | Liver | Cirrhotic | Regulation of actin cytoskeleton | 100/2530 | 229/8465 | 5.28e-06 | 5.50e-05 | 3.39e-05 | 100 |
| hsa0520510 | Liver | Cirrhotic | Proteoglycans in cancer | 85/2530 | 205/8465 | 2.37e-04 | 1.58e-03 | 9.75e-04 | 85 |
| hsa0467022 | Liver | Cirrhotic | Leukocyte transendothelial migration | 49/2530 | 114/8465 | 1.92e-03 | 8.55e-03 | 5.27e-03 | 49 |
| hsa0453032 | Liver | Cirrhotic | Tight junction | 82/2530 | 169/8465 | 2.14e-07 | 2.85e-06 | 1.76e-06 | 82 |
| hsa0481031 | Liver | Cirrhotic | Regulation of actin cytoskeleton | 100/2530 | 229/8465 | 5.28e-06 | 5.50e-05 | 3.39e-05 | 100 |
| hsa0520511 | Liver | Cirrhotic | Proteoglycans in cancer | 85/2530 | 205/8465 | 2.37e-04 | 1.58e-03 | 9.75e-04 | 85 |
| hsa0467032 | Liver | Cirrhotic | Leukocyte transendothelial migration | 49/2530 | 114/8465 | 1.92e-03 | 8.55e-03 | 5.27e-03 | 49 |
| hsa0453042 | Liver | HCC | Tight junction | 110/4020 | 169/8465 | 2.45e-06 | 2.28e-05 | 1.27e-05 | 110 |
| hsa0481041 | Liver | HCC | Regulation of actin cytoskeleton | 134/4020 | 229/8465 | 4.48e-04 | 1.94e-03 | 1.08e-03 | 134 |
| hsa0520521 | Liver | HCC | Proteoglycans in cancer | 121/4020 | 205/8465 | 5.22e-04 | 2.18e-03 | 1.21e-03 | 121 |
| hsa0467042 | Liver | HCC | Leukocyte transendothelial migration | 68/4020 | 114/8465 | 5.79e-03 | 1.64e-02 | 9.15e-03 | 68 |
| Page: 1 2 3 4 5 |
Top |
Cell-cell communication analysis |
| Identification of potential cell-cell interactions between two cell types and their ligand-receptor pairs for different disease states |
| Ligand | Receptor | LRpair | Pathway | Tissue | Disease Stage |
| Page: 1 |
Top |
Single-cell gene regulatory network inference analysis |
| Find out the significant the regulons (TFs) and the target genes of each regulon across cell types for different disease states |
| TF | Cell Type | Tissue | Disease Stage | Target Gene | RSS | Regulon Activity |
| ∗The dot plots of a searched regulon are shown for all cell subpopulations in each disease state of each tissue based on the regulon specific score inferred using pySCENIC and by calculating the average expression. |
| Page: 1 |
Top |
Somatic mutation of malignant transformation related genes |
| Annotation of somatic variants for genes involved in malignant transformation |
| Hugo Symbol | Variant Class | Variant Classification | dbSNP RS | HGVSc | HGVSp | HGVSp Short | SWISSPROT | BIOTYPE | SIFT | PolyPhen | Tumor Sample Barcode | Tissue | Histology | Sex | Age | Stage | Therapy Types | Drugs | Outcome |
| MSN | SNV | Missense_Mutation | c.1189N>A | p.Glu397Lys | p.E397K | P26038 | protein_coding | tolerated(0.32) | possibly_damaging(0.61) | TCGA-A2-A0YT-01 | Breast | breast invasive carcinoma | Female | <65 | III/IV | Hormone Therapy | arimidex | SD | |
| MSN | SNV | Missense_Mutation | c.1678C>T | p.Arg560Cys | p.R560C | P26038 | protein_coding | deleterious(0) | probably_damaging(0.999) | TCGA-A2-A3XZ-01 | Breast | breast invasive carcinoma | Female | <65 | I/II | Chemotherapy | carboplatin | CR | |
| MSN | SNV | Missense_Mutation | c.1507N>T | p.Arg503Cys | p.R503C | P26038 | protein_coding | deleterious(0.01) | probably_damaging(0.953) | TCGA-AC-A23H-01 | Breast | breast invasive carcinoma | Female | >=65 | I/II | Unknown | Unknown | PD | |
| MSN | SNV | Missense_Mutation | c.855N>A | p.Met285Ile | p.M285I | P26038 | protein_coding | tolerated(0.23) | benign(0.029) | TCGA-C8-A12U-01 | Breast | breast invasive carcinoma | Female | <65 | I/II | Unknown | Unknown | SD | |
| MSN | SNV | Missense_Mutation | rs753856958 | c.659N>G | p.Val220Gly | p.V220G | P26038 | protein_coding | deleterious(0) | probably_damaging(0.998) | TCGA-E9-A1N5-01 | Breast | breast invasive carcinoma | Female | <65 | I/II | Chemotherapy | doxorubicin | SD |
| MSN | SNV | Missense_Mutation | rs770945316 | c.299G>A | p.Arg100His | p.R100H | P26038 | protein_coding | tolerated(0.58) | benign(0.068) | TCGA-LL-A9Q3-01 | Breast | breast invasive carcinoma | Female | >=65 | III/IV | Immunotherapy | herceptin | CR |
| MSN | SNV | Missense_Mutation | novel | c.1034A>G | p.Glu345Gly | p.E345G | P26038 | protein_coding | tolerated(0.19) | benign(0.007) | TCGA-S3-AA17-01 | Breast | breast invasive carcinoma | Female | <65 | I/II | Hormone Therapy | anastrozole | SD |
| MSN | insertion | In_Frame_Ins | novel | c.342_343insCTCACCTTACCCTTACCCTCCACTTGCATCCTTCTCCCAAAAAAC | p.Asp114_Ile115insLeuThrLeuProLeuProSerThrCysIleLeuLeuProLysAsn | p.D114_I115insLTLPLPSTCILLPKN | P26038 | protein_coding | TCGA-A8-A095-01 | Breast | breast invasive carcinoma | Female | <65 | I/II | Chemotherapy | 5-fluorouracil | CR | ||
| MSN | SNV | Missense_Mutation | novel | c.322N>A | p.Glu108Lys | p.E108K | P26038 | protein_coding | tolerated(0.09) | possibly_damaging(0.47) | TCGA-2W-A8YY-01 | Cervix | cervical & endocervical cancer | Female | <65 | I/II | Chemotherapy | cisplatin | CR |
| MSN | SNV | Missense_Mutation | rs778459733 | c.835N>T | p.Arg279Trp | p.R279W | P26038 | protein_coding | deleterious(0.03) | possibly_damaging(0.598) | TCGA-2W-A8YY-01 | Cervix | cervical & endocervical cancer | Female | <65 | I/II | Chemotherapy | cisplatin | CR |
| Page: 1 2 3 4 5 6 7 8 9 10 11 12 |
Top |
Related drugs of malignant transformation related genes |
| Identification of chemicals and drugs interact with genes involved in malignant transfromation |
| (DGIdb 4.0) |
| Entrez ID | Symbol | Category | Interaction Types | Drug Claim Name | Drug Name | PMIDs |
| Page: 1 |

Copyright 2023-Present -The University of Texas Health Science Center at Houston |