
|
|||||
|
 | |
| |
| |
| |
| |
| |
|
Gene: MSMB |
Gene summary for MSMB |
| Gene information | Species | Human | Gene symbol | MSMB | Gene ID | 4477 |
| Gene name | microseminoprotein beta | |
| Gene Alias | HPC13 | |
| Cytomap | 10q11.22 | |
| Gene Type | protein-coding | GO ID | GO:0008150 | UniProtAcc | P08118 |
Top |
Malignant transformation analysis |
| Identification of the aberrant gene expression in precancerous and cancerous lesions by comparing the gene expression of stem-like cells in diseased tissues with normal stem cells |
| Entrez ID | Symbol | Replicates | Species | Organ | Tissue | Adj P-value | Log2FC | Malignancy |
| 4477 | MSMB | LZE5T | Human | Esophagus | ESCC | 2.70e-11 | 1.99e+00 | 0.0514 |
| 4477 | MSMB | P8T-E | Human | Esophagus | ESCC | 2.78e-28 | 2.27e+00 | 0.0889 |
| 4477 | MSMB | P15T-E | Human | Esophagus | ESCC | 1.29e-02 | 9.66e-02 | 0.1149 |
| 4477 | MSMB | P23T-E | Human | Esophagus | ESCC | 1.41e-05 | 1.23e-01 | 0.108 |
| 4477 | MSMB | P54T-E | Human | Esophagus | ESCC | 3.48e-11 | 5.12e-01 | 0.0975 |
| 4477 | MSMB | P61T-E | Human | Esophagus | ESCC | 1.77e-06 | 3.50e-01 | 0.099 |
| 4477 | MSMB | P62T-E | Human | Esophagus | ESCC | 4.56e-07 | 4.26e-01 | 0.1302 |
| 4477 | MSMB | P75T-E | Human | Esophagus | ESCC | 6.38e-04 | 4.47e-01 | 0.1125 |
| 4477 | MSMB | P83T-E | Human | Esophagus | ESCC | 5.17e-03 | 2.69e-01 | 0.1738 |
| 4477 | MSMB | P94T-E | Human | Esophagus | ESCC | 1.05e-15 | 3.49e+00 | 0.0879 |
| 4477 | MSMB | P104T-E | Human | Esophagus | ESCC | 2.26e-11 | 1.54e+00 | 0.0931 |
| 4477 | MSMB | P127T-E | Human | Esophagus | ESCC | 1.90e-03 | 2.92e-02 | 0.0826 |
| 4477 | MSMB | C43 | Human | Oral cavity | OSCC | 9.26e-07 | 1.67e-01 | 0.1704 |
| 4477 | MSMB | C46 | Human | Oral cavity | OSCC | 8.79e-36 | 8.21e-01 | 0.1673 |
| 4477 | MSMB | C08 | Human | Oral cavity | OSCC | 7.57e-13 | 5.21e-01 | 0.1919 |
| 4477 | MSMB | LN38 | Human | Oral cavity | OSCC | 1.54e-03 | 2.78e+00 | 0.168 |
| 4477 | MSMB | LN46 | Human | Oral cavity | OSCC | 8.31e-13 | 5.52e-01 | 0.1666 |
| 4477 | MSMB | SYSMH1 | Human | Oral cavity | OSCC | 3.50e-02 | 8.01e-02 | 0.1127 |
| 4477 | MSMB | GSM5252127_BPH283PrSF_Via | Human | Prostate | BPH | 1.20e-02 | -5.08e-01 | -0.1453 |
| 4477 | MSMB | GSM5252129_BPH327PrSF_Via | Human | Prostate | BPH | 4.59e-02 | -5.66e-01 | -0.1697 |
| Page: 1 2 3 |
| Tissue | Expression Dynamics | Abbreviation |
| Esophagus | 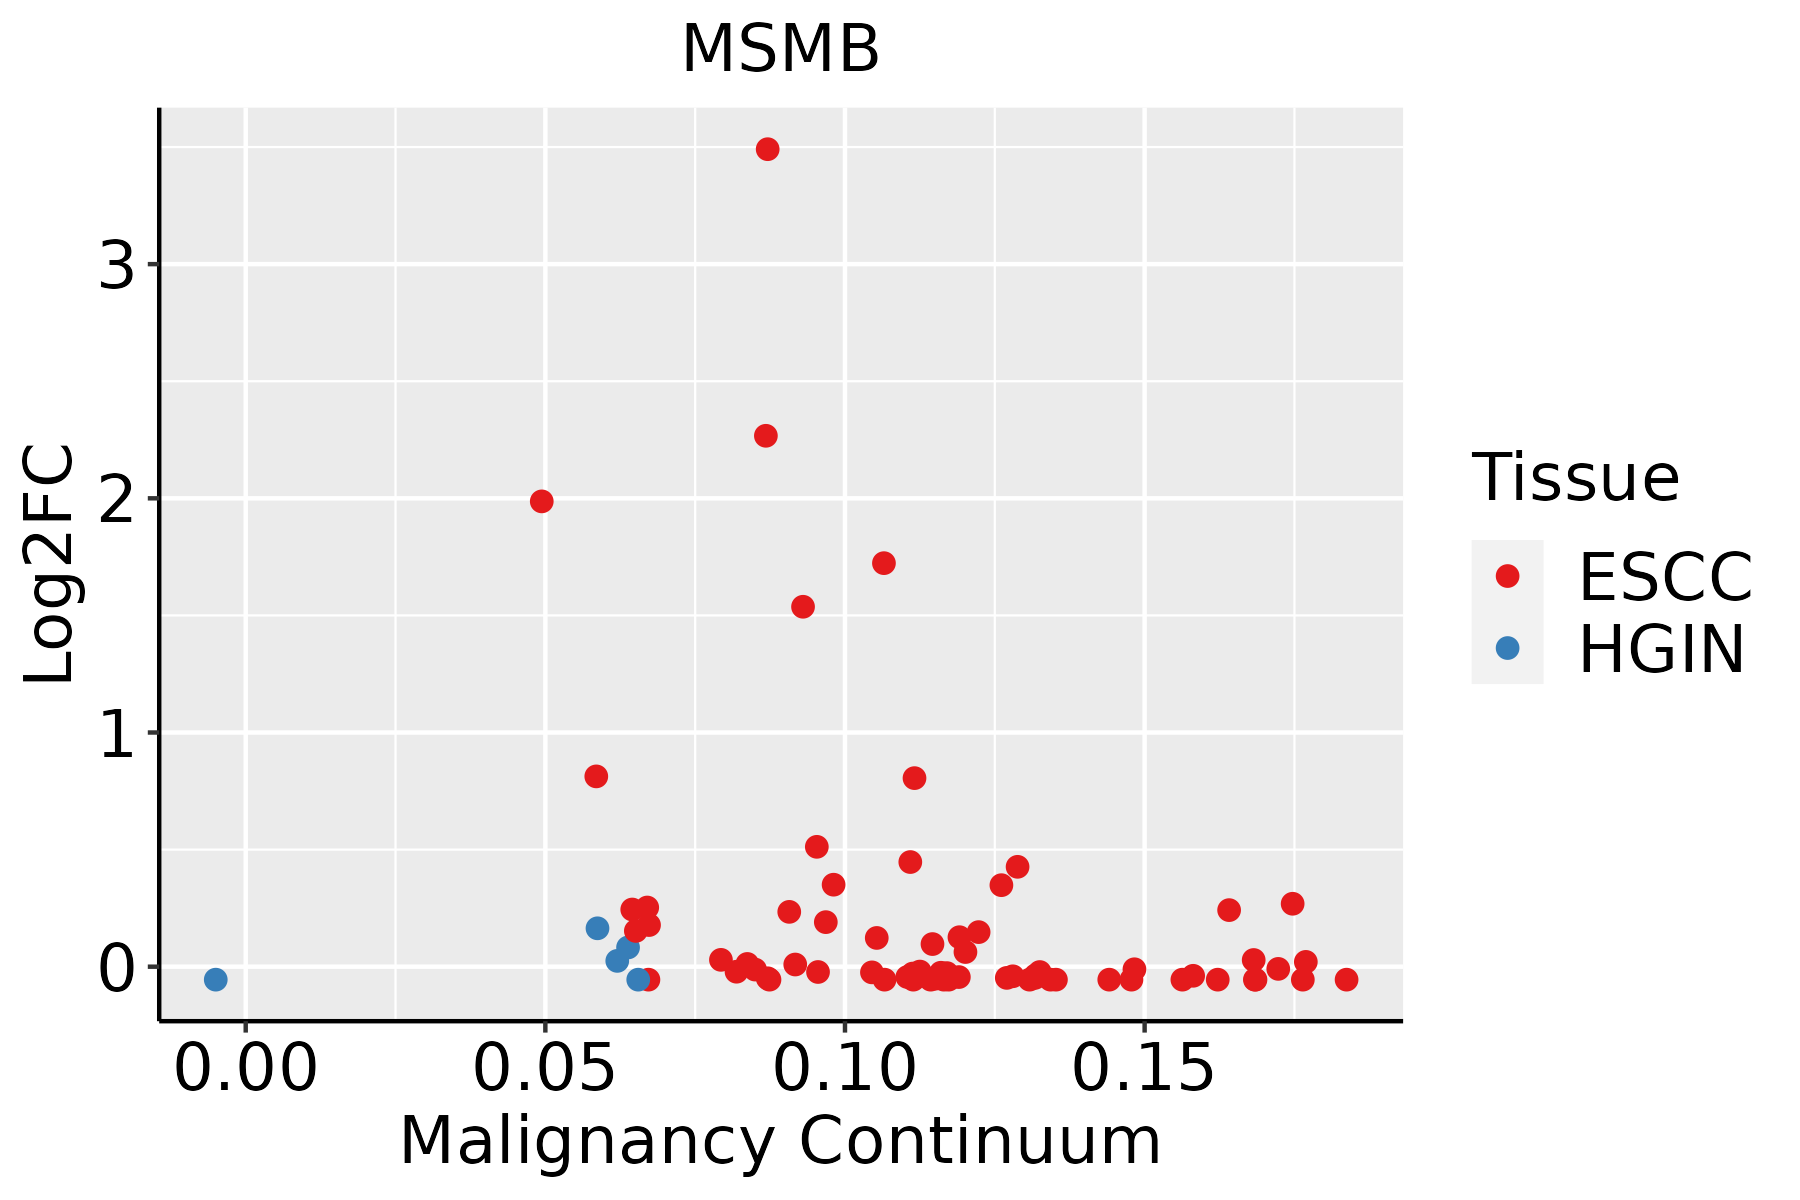 | ESCC: Esophageal squamous cell carcinoma |
| HGIN: High-grade intraepithelial neoplasias | ||
| LGIN: Low-grade intraepithelial neoplasias | ||
| GC |  | CAG: Chronic atrophic gastritis |
| CAG with IM: Chronic atrophic gastritis with intestinal metaplasia | ||
| CSG: Chronic superficial gastritis | ||
| GC: Gastric cancer | ||
| SIM: Severe intestinal metaplasia | ||
| WIM: Wild intestinal metaplasia | ||
| Oral Cavity |  | EOLP: Erosive Oral lichen planus |
| LP: leukoplakia | ||
| NEOLP: Non-erosive oral lichen planus | ||
| OSCC: Oral squamous cell carcinoma | ||
| Prostate |  | BPH: Benign Prostatic Hyperplasia |
| ∗log2FC in expression of this searched gene in stem-like cells from each diseased tissue sample relative to stem-like cells in normal samples in each tissue plotted against the malignancy continuum. Samples are colored based on if they are from different disease stage. |
Top |
Malignant transformation related pathway analysis |
| Find out the enriched GO biological processes and KEGG pathways involved in transition from healthy to precancer to cancer |
| Tissue | Disease Stage | Enriched GO biological Processes |
| Colorectum | AD |  |
| Colorectum | SER |  |
| Colorectum | MSS |  |
| Colorectum | MSI-H |  |
| Colorectum | FAP |  |
| ∗Top 15 enriched GO BP terms are showed in the bar plot of each disease state in each tissue. Each row represents a significant GO biological process which is colored according to the -log10(p.adjust). |
| Page: 1 2 3 4 5 6 7 8 9 |
| GO ID | Tissue | Disease Stage | Description | Gene Ratio | Bg Ratio | pvalue | p.adjust | Count |
| Page: 1 |
| Pathway ID | Tissue | Disease Stage | Description | Gene Ratio | Bg Ratio | pvalue | p.adjust | qvalue | Count |
| Page: 1 |
Top |
Cell-cell communication analysis |
| Identification of potential cell-cell interactions between two cell types and their ligand-receptor pairs for different disease states |
| Ligand | Receptor | LRpair | Pathway | Tissue | Disease Stage |
| Page: 1 |
Top |
Single-cell gene regulatory network inference analysis |
| Find out the significant the regulons (TFs) and the target genes of each regulon across cell types for different disease states |
| TF | Cell Type | Tissue | Disease Stage | Target Gene | RSS | Regulon Activity |
| ∗The dot plots of a searched regulon are shown for all cell subpopulations in each disease state of each tissue based on the regulon specific score inferred using pySCENIC and by calculating the average expression. |
| Page: 1 |
Top |
Somatic mutation of malignant transformation related genes |
| Annotation of somatic variants for genes involved in malignant transformation |
| Hugo Symbol | Variant Class | Variant Classification | dbSNP RS | HGVSc | HGVSp | HGVSp Short | SWISSPROT | BIOTYPE | SIFT | PolyPhen | Tumor Sample Barcode | Tissue | Histology | Sex | Age | Stage | Therapy Types | Drugs | Outcome |
| MSMB | SNV | Missense_Mutation | novel | c.304N>T | p.Asp102Tyr | p.D102Y | P08118 | protein_coding | deleterious(0) | possibly_damaging(0.89) | TCGA-A6-3809-01 | Colorectum | colon adenocarcinoma | Female | >=65 | I/II | Unknown | Unknown | SD |
| MSMB | SNV | Missense_Mutation | novel | c.35N>T | p.Ala12Val | p.A12V | P08118 | protein_coding | deleterious(0) | benign(0.092) | TCGA-A5-A0G2-01 | Endometrium | uterine corpus endometrioid carcinoma | Female | <65 | III/IV | Unknown | Unknown | SD |
| MSMB | SNV | Missense_Mutation | novel | c.336G>T | p.Trp112Cys | p.W112C | P08118 | protein_coding | deleterious(0.02) | probably_damaging(0.989) | TCGA-AP-A056-01 | Endometrium | uterine corpus endometrioid carcinoma | Female | <65 | I/II | Unknown | Unknown | SD |
| MSMB | SNV | Missense_Mutation | novel | c.180N>G | p.Cys60Trp | p.C60W | P08118 | protein_coding | deleterious(0) | probably_damaging(0.999) | TCGA-AP-A059-01 | Endometrium | uterine corpus endometrioid carcinoma | Female | >=65 | I/II | Unknown | Unknown | SD |
| MSMB | SNV | Missense_Mutation | novel | c.57T>G | p.Asn19Lys | p.N19K | P08118 | protein_coding | deleterious(0.05) | benign(0.406) | TCGA-DF-A2KU-01 | Endometrium | uterine corpus endometrioid carcinoma | Female | Unknown | I/II | Unknown | Unknown | SD |
| MSMB | SNV | Missense_Mutation | novel | c.175A>G | p.Thr59Ala | p.T59A | P08118 | protein_coding | tolerated(0.51) | benign(0.001) | TCGA-EO-A22R-01 | Endometrium | uterine corpus endometrioid carcinoma | Female | <65 | I/II | Unknown | Unknown | SD |
| MSMB | SNV | Missense_Mutation | novel | c.43N>A | p.Val15Met | p.V15M | P08118 | protein_coding | tolerated(0.13) | benign(0.149) | TCGA-EO-A22U-01 | Endometrium | uterine corpus endometrioid carcinoma | Female | >=65 | I/II | Unknown | Unknown | SD |
| MSMB | SNV | Missense_Mutation | novel | c.10N>A | p.Leu4Ile | p.L4I | P08118 | protein_coding | deleterious(0.03) | possibly_damaging(0.665) | TCGA-EY-A1GI-01 | Endometrium | uterine corpus endometrioid carcinoma | Female | <65 | I/II | Unknown | Unknown | SD |
| MSMB | SNV | Missense_Mutation | novel | c.151N>C | p.Glu51Gln | p.E51Q | P08118 | protein_coding | tolerated(0.33) | benign(0.003) | TCGA-44-7667-01 | Lung | lung adenocarcinoma | Female | <65 | I/II | Unknown | Unknown | SD |
| MSMB | SNV | Missense_Mutation | novel | c.154T>A | p.Trp52Arg | p.W52R | P08118 | protein_coding | deleterious(0) | probably_damaging(1) | TCGA-62-A470-01 | Lung | lung adenocarcinoma | Male | >=65 | I/II | Unknown | Unknown | PD |
| Page: 1 2 |
Top |
Related drugs of malignant transformation related genes |
| Identification of chemicals and drugs interact with genes involved in malignant transfromation |
| (DGIdb 4.0) |
| Entrez ID | Symbol | Category | Interaction Types | Drug Claim Name | Drug Name | PMIDs |
| 4477 | MSMB | DRUGGABLE GENOME, CLINICALLY ACTIONABLE | Tigapotide | TIGAPOTIDE |
| Page: 1 |

Copyright 2023-Present -The University of Texas Health Science Center at Houston |