
|
|||||
|
 | |
| |
| |
| |
| |
| |
|
Gene: MSLN |
Gene summary for MSLN |
| Gene information | Species | Human | Gene symbol | MSLN | Gene ID | 10232 |
| Gene name | mesothelin | |
| Gene Alias | MPF | |
| Cytomap | 16p13.3 | |
| Gene Type | protein-coding | GO ID | GO:0007155 | UniProtAcc | Q13421 |
Top |
Malignant transformation analysis |
| Identification of the aberrant gene expression in precancerous and cancerous lesions by comparing the gene expression of stem-like cells in diseased tissues with normal stem cells |
| Entrez ID | Symbol | Replicates | Species | Organ | Tissue | Adj P-value | Log2FC | Malignancy |
| 10232 | MSLN | AEH-subject1 | Human | Endometrium | AEH | 7.98e-10 | 4.16e-01 | -0.3059 |
| 10232 | MSLN | AEH-subject2 | Human | Endometrium | AEH | 1.35e-29 | 8.10e-01 | -0.2525 |
| 10232 | MSLN | EEC-subject2 | Human | Endometrium | EEC | 2.23e-51 | 9.88e-01 | -0.2607 |
| 10232 | MSLN | EEC-subject5 | Human | Endometrium | EEC | 1.39e-04 | 2.77e-01 | -0.249 |
| 10232 | MSLN | GSM6177622_NYU_UCEC3_lib1_lib1 | Human | Endometrium | EEC | 5.59e-07 | 3.69e-01 | -0.1917 |
| 10232 | MSLN | GSM6177622_NYU_UCEC3_lib2_lib2 | Human | Endometrium | EEC | 3.97e-05 | 3.73e-01 | -0.1916 |
| 10232 | MSLN | GSM6177623_NYU_UCEC3_Vis | Human | Endometrium | EEC | 7.39e-56 | 1.08e+00 | -0.1269 |
| 10232 | MSLN | LZE22T | Human | Esophagus | ESCC | 4.48e-03 | 1.03e+00 | 0.068 |
| 10232 | MSLN | P5T-E | Human | Esophagus | ESCC | 8.94e-09 | 4.69e-02 | 0.1327 |
| 10232 | MSLN | P8T-E | Human | Esophagus | ESCC | 2.42e-83 | 2.19e+00 | 0.0889 |
| 10232 | MSLN | P10T-E | Human | Esophagus | ESCC | 7.90e-03 | -2.50e-01 | 0.116 |
| 10232 | MSLN | P16T-E | Human | Esophagus | ESCC | 1.30e-02 | -2.40e-01 | 0.1153 |
| 10232 | MSLN | P27T-E | Human | Esophagus | ESCC | 1.04e-03 | -2.31e-01 | 0.1055 |
| 10232 | MSLN | P31T-E | Human | Esophagus | ESCC | 1.18e-02 | 1.38e-01 | 0.1251 |
| 10232 | MSLN | P32T-E | Human | Esophagus | ESCC | 7.90e-03 | -2.50e-01 | 0.1666 |
| 10232 | MSLN | P39T-E | Human | Esophagus | ESCC | 1.06e-03 | -1.94e-01 | 0.0894 |
| 10232 | MSLN | P61T-E | Human | Esophagus | ESCC | 1.57e-02 | -2.50e-01 | 0.099 |
| 10232 | MSLN | P62T-E | Human | Esophagus | ESCC | 1.23e-03 | -2.50e-01 | 0.1302 |
| 10232 | MSLN | P75T-E | Human | Esophagus | ESCC | 2.52e-04 | 3.74e-01 | 0.1125 |
| 10232 | MSLN | P76T-E | Human | Esophagus | ESCC | 8.97e-03 | -1.39e-01 | 0.1207 |
| Page: 1 2 3 |
| Tissue | Expression Dynamics | Abbreviation |
| Endometrium | 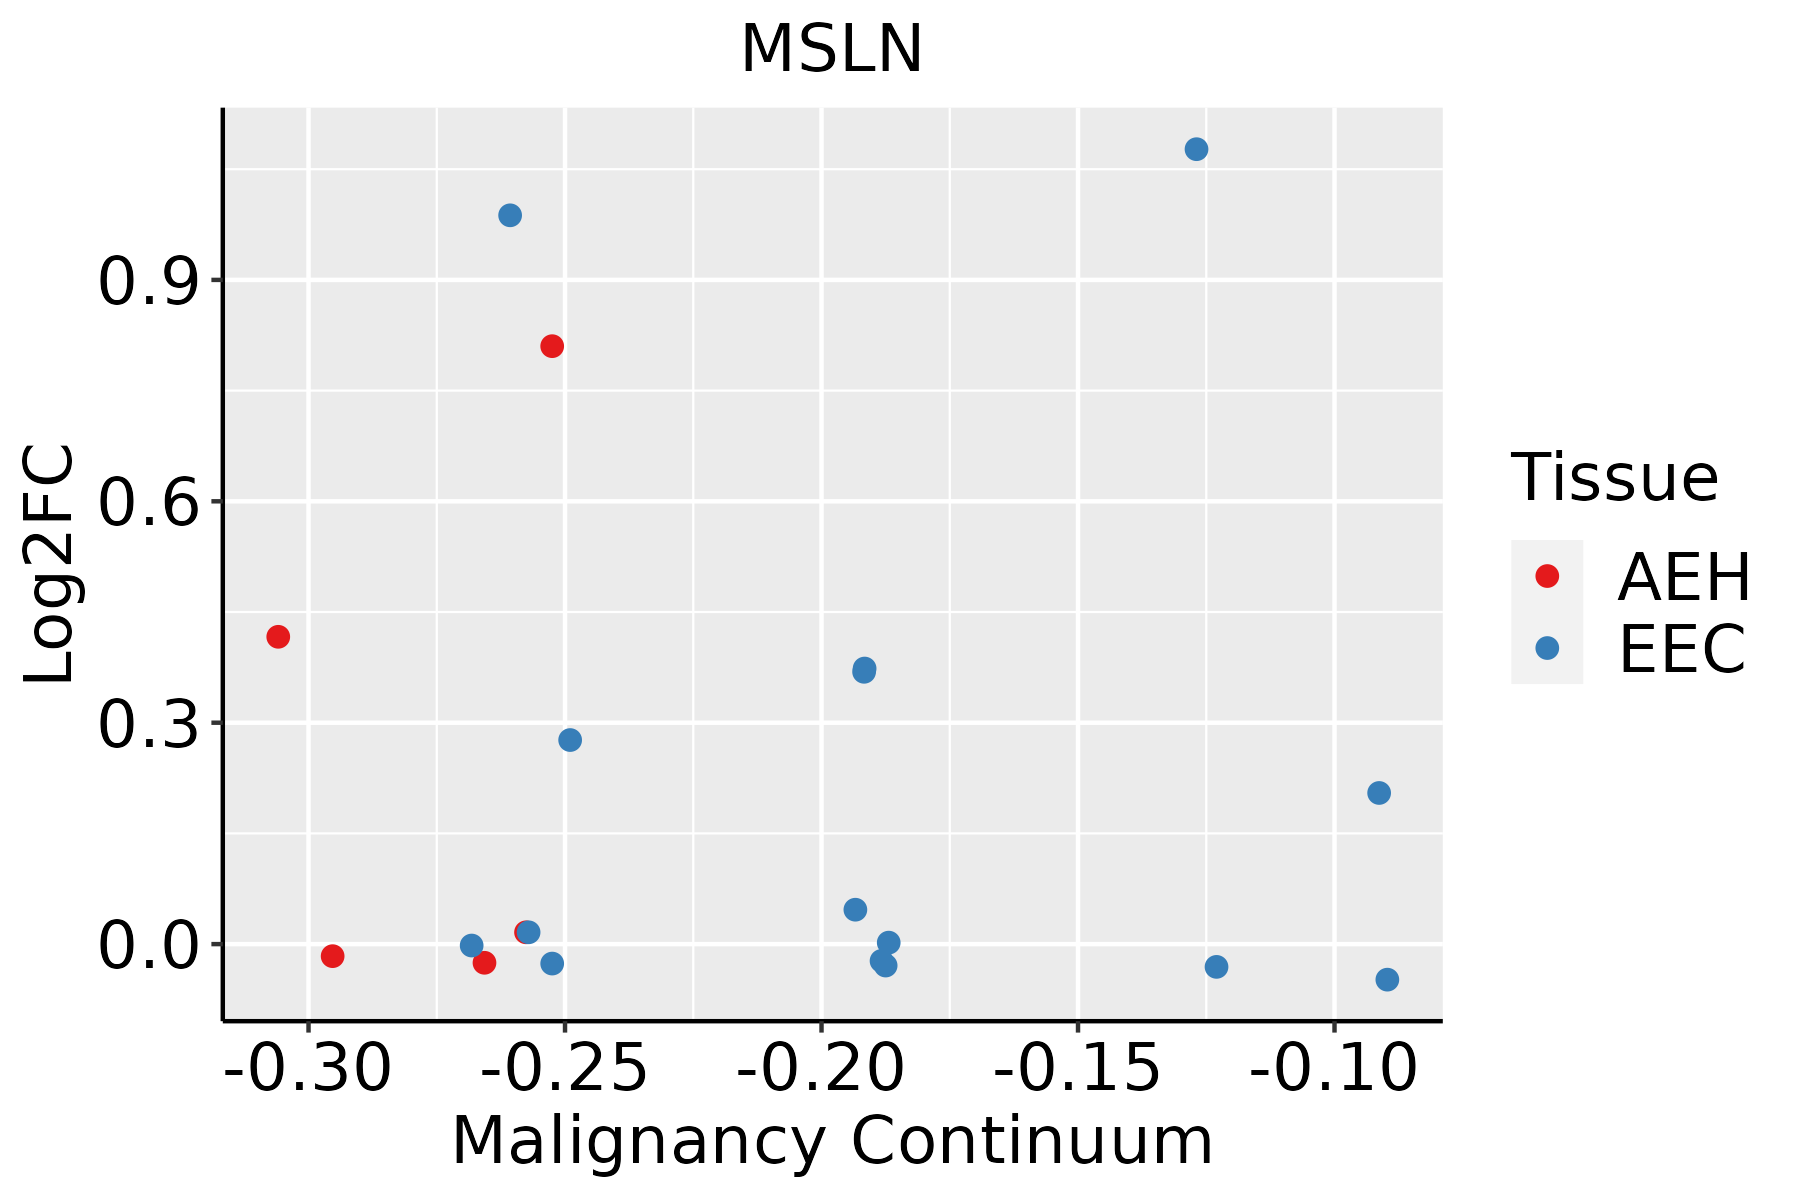 | AEH: Atypical endometrial hyperplasia |
| EEC: Endometrioid Cancer | ||
| Esophagus | 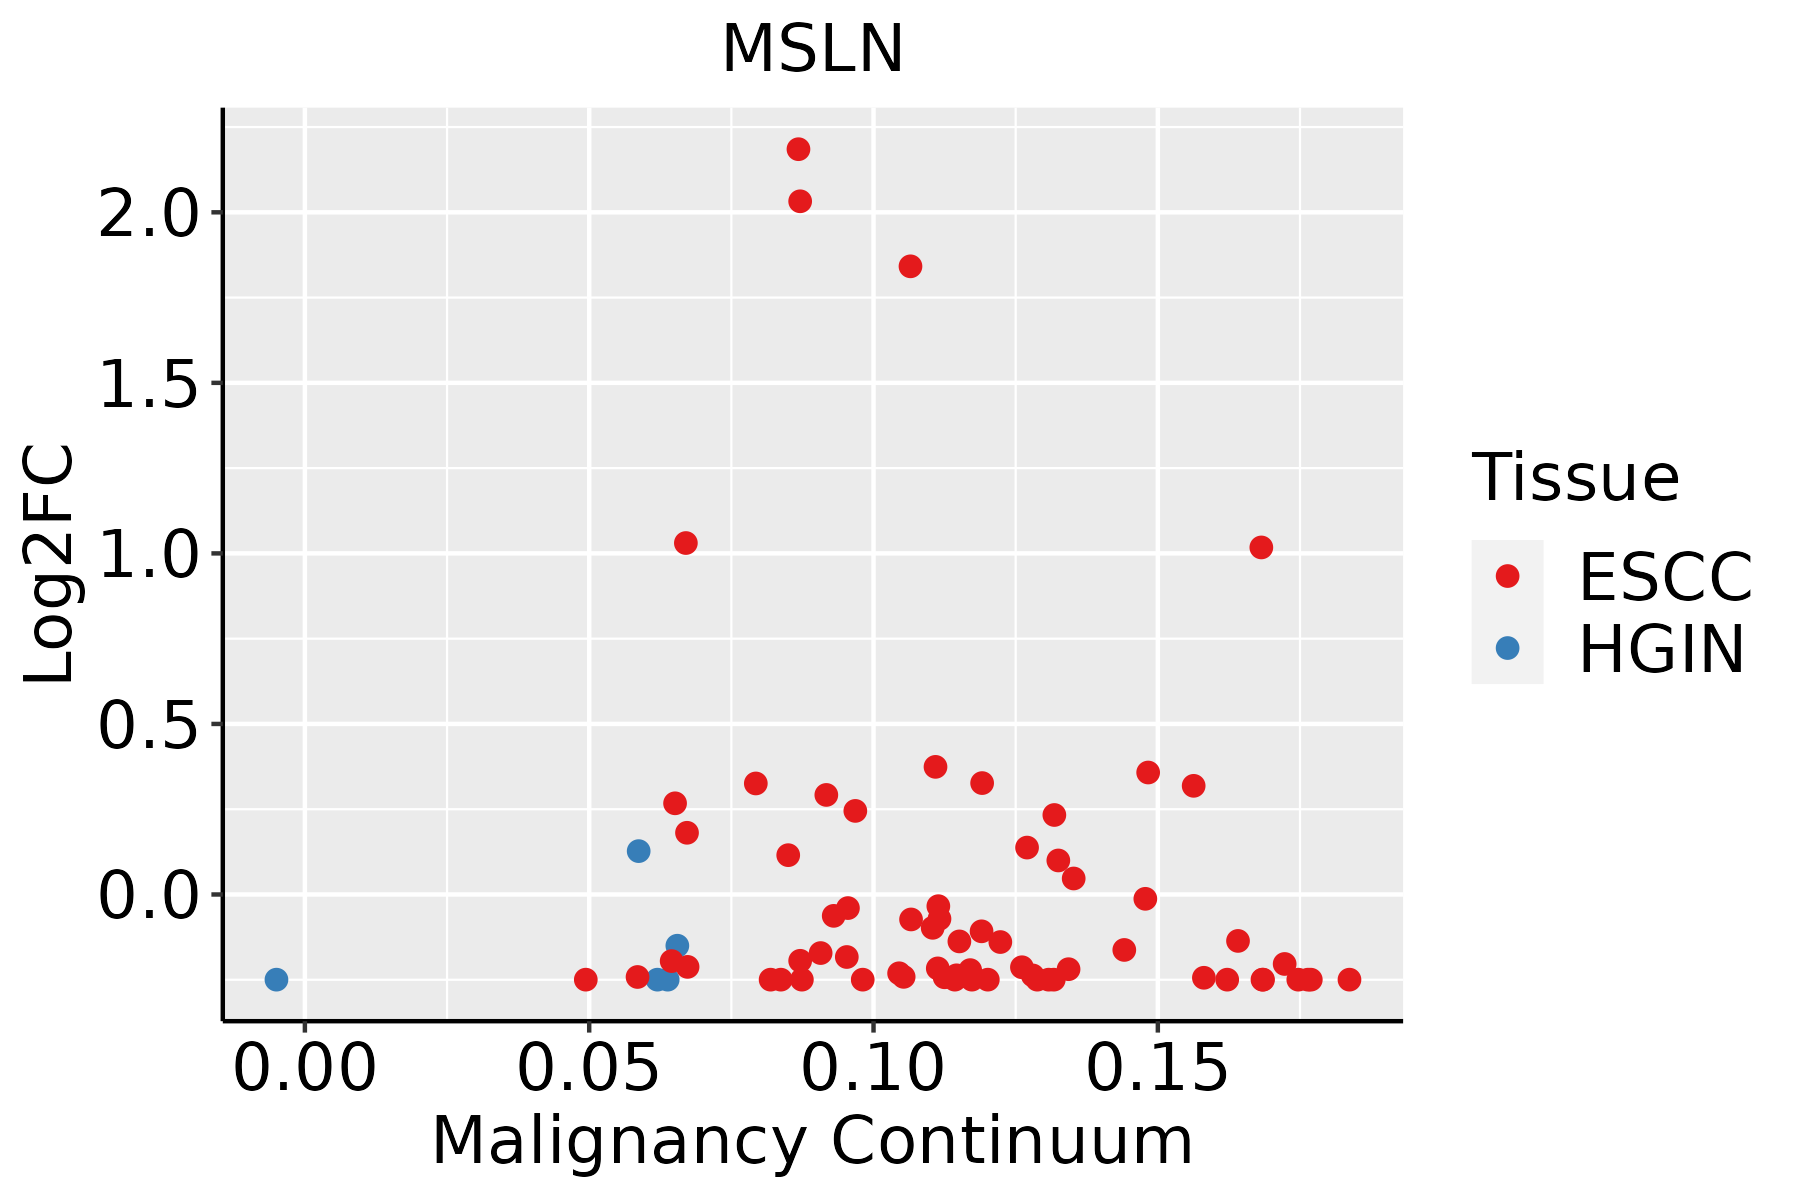 | ESCC: Esophageal squamous cell carcinoma |
| HGIN: High-grade intraepithelial neoplasias | ||
| LGIN: Low-grade intraepithelial neoplasias | ||
| GC | 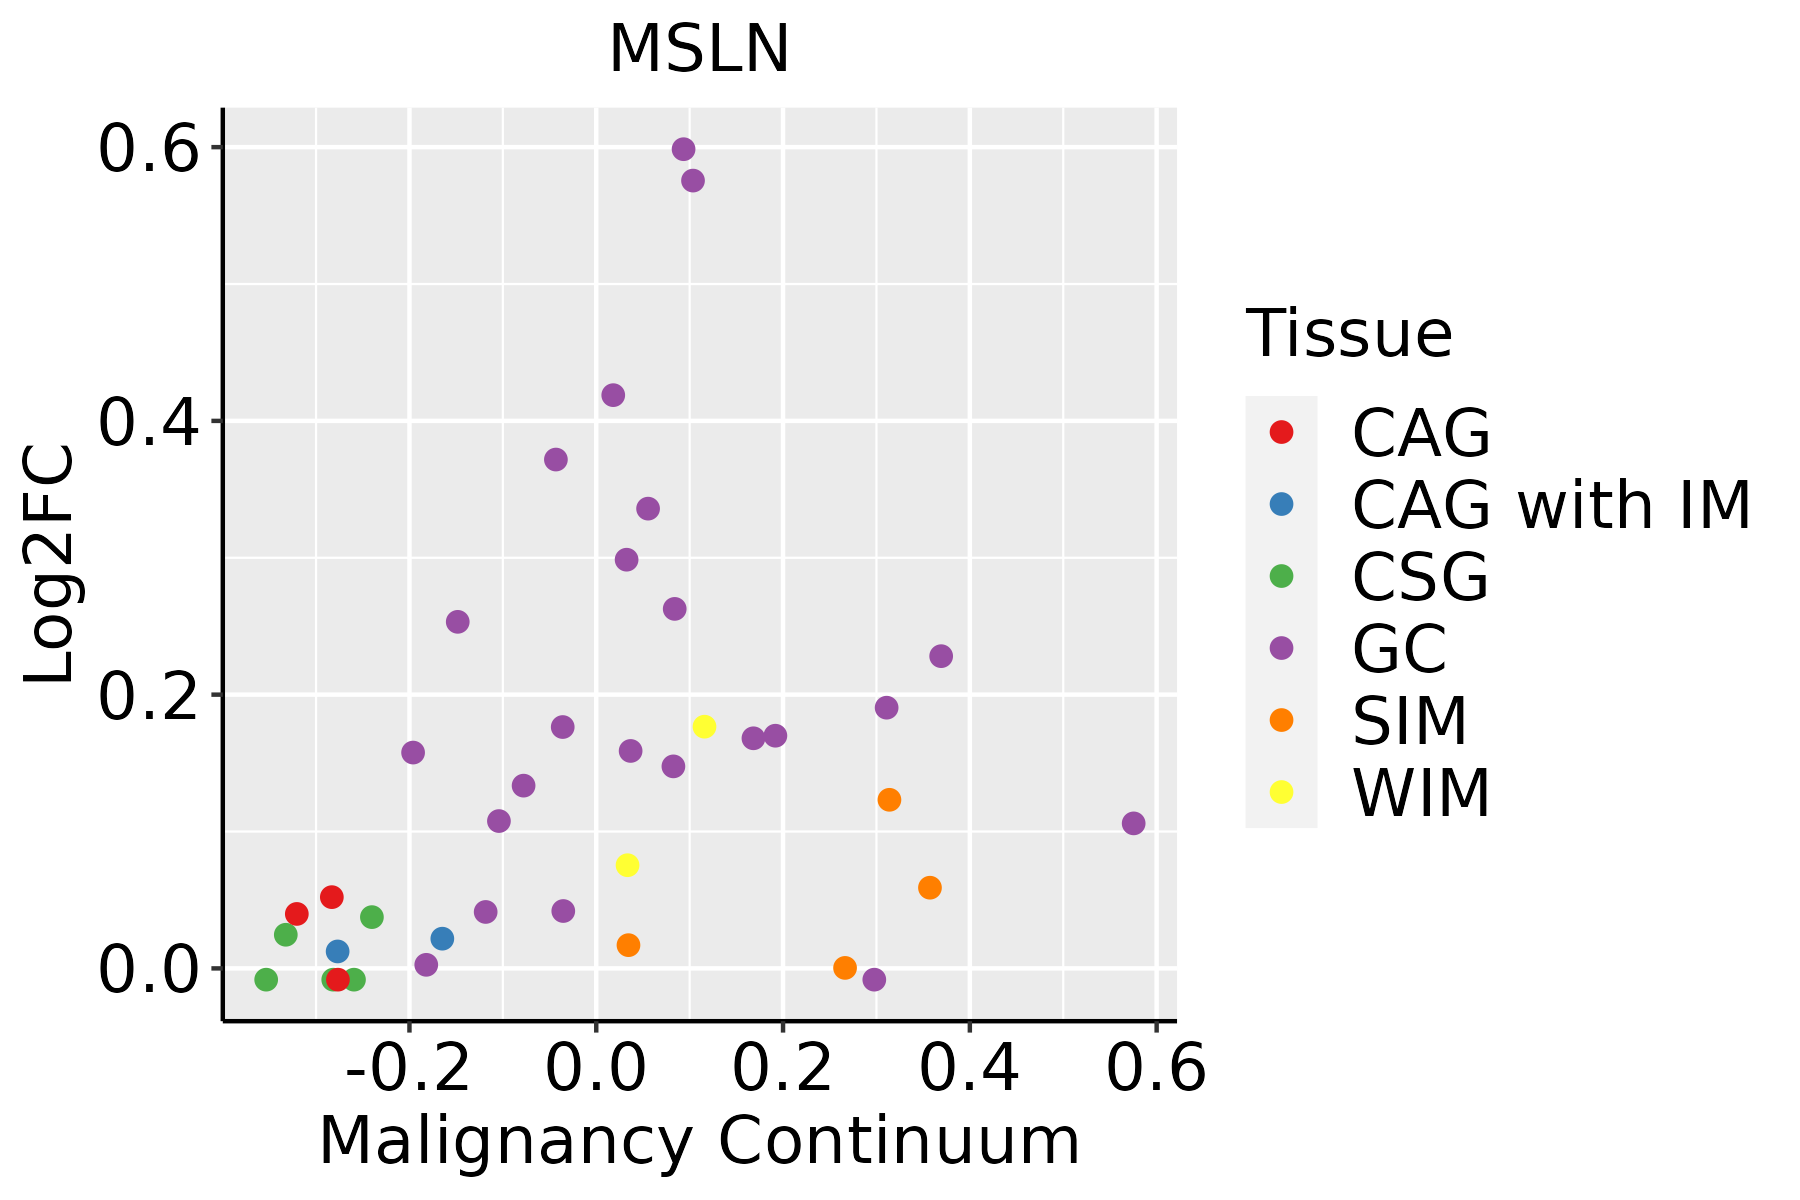 | CAG: Chronic atrophic gastritis |
| CAG with IM: Chronic atrophic gastritis with intestinal metaplasia | ||
| CSG: Chronic superficial gastritis | ||
| GC: Gastric cancer | ||
| SIM: Severe intestinal metaplasia | ||
| WIM: Wild intestinal metaplasia | ||
| Oral Cavity |  | EOLP: Erosive Oral lichen planus |
| LP: leukoplakia | ||
| NEOLP: Non-erosive oral lichen planus | ||
| OSCC: Oral squamous cell carcinoma |
| ∗log2FC in expression of this searched gene in stem-like cells from each diseased tissue sample relative to stem-like cells in normal samples in each tissue plotted against the malignancy continuum. Samples are colored based on if they are from different disease stage. |
Top |
Malignant transformation related pathway analysis |
| Find out the enriched GO biological processes and KEGG pathways involved in transition from healthy to precancer to cancer |
| Tissue | Disease Stage | Enriched GO biological Processes |
| Colorectum | AD |  |
| Colorectum | SER |  |
| Colorectum | MSS |  |
| Colorectum | MSI-H |  |
| Colorectum | FAP |  |
| ∗Top 15 enriched GO BP terms are showed in the bar plot of each disease state in each tissue. Each row represents a significant GO biological process which is colored according to the -log10(p.adjust). |
| Page: 1 2 3 4 5 6 7 8 9 |
| GO ID | Tissue | Disease Stage | Description | Gene Ratio | Bg Ratio | pvalue | p.adjust | Count |
| GO:00315899 | Endometrium | AEH | cell-substrate adhesion | 87/2100 | 363/18723 | 3.51e-12 | 5.70e-10 | 87 |
| GO:00071609 | Endometrium | AEH | cell-matrix adhesion | 54/2100 | 233/18723 | 1.42e-07 | 6.37e-06 | 54 |
| GO:003158915 | Endometrium | EEC | cell-substrate adhesion | 87/2168 | 363/18723 | 1.95e-11 | 3.00e-09 | 87 |
| GO:000716014 | Endometrium | EEC | cell-matrix adhesion | 54/2168 | 233/18723 | 3.98e-07 | 1.56e-05 | 54 |
| GO:003158919 | Esophagus | ESCC | cell-substrate adhesion | 221/8552 | 363/18723 | 3.06e-09 | 6.62e-08 | 221 |
| GO:000716018 | Esophagus | ESCC | cell-matrix adhesion | 141/8552 | 233/18723 | 3.33e-06 | 3.71e-05 | 141 |
| GO:003158917 | Oral cavity | OSCC | cell-substrate adhesion | 193/7305 | 363/18723 | 2.48e-08 | 4.82e-07 | 193 |
| GO:000716016 | Oral cavity | OSCC | cell-matrix adhesion | 125/7305 | 233/18723 | 3.76e-06 | 4.45e-05 | 125 |
| GO:00315895 | Stomach | GC | cell-substrate adhesion | 40/1159 | 363/18723 | 2.91e-04 | 4.68e-03 | 40 |
| GO:00071605 | Stomach | GC | cell-matrix adhesion | 25/1159 | 233/18723 | 5.24e-03 | 4.11e-02 | 25 |
| Page: 1 |
| Pathway ID | Tissue | Disease Stage | Description | Gene Ratio | Bg Ratio | pvalue | p.adjust | qvalue | Count |
| Page: 1 |
Top |
Cell-cell communication analysis |
| Identification of potential cell-cell interactions between two cell types and their ligand-receptor pairs for different disease states |
| Ligand | Receptor | LRpair | Pathway | Tissue | Disease Stage |
| Page: 1 |
Top |
Single-cell gene regulatory network inference analysis |
| Find out the significant the regulons (TFs) and the target genes of each regulon across cell types for different disease states |
| TF | Cell Type | Tissue | Disease Stage | Target Gene | RSS | Regulon Activity |
| ∗The dot plots of a searched regulon are shown for all cell subpopulations in each disease state of each tissue based on the regulon specific score inferred using pySCENIC and by calculating the average expression. |
| Page: 1 |
Top |
Somatic mutation of malignant transformation related genes |
| Annotation of somatic variants for genes involved in malignant transformation |
| Hugo Symbol | Variant Class | Variant Classification | dbSNP RS | HGVSc | HGVSp | HGVSp Short | SWISSPROT | BIOTYPE | SIFT | PolyPhen | Tumor Sample Barcode | Tissue | Histology | Sex | Age | Stage | Therapy Types | Drugs | Outcome |
| MSLN | SNV | Missense_Mutation | rs201807512 | c.1352N>T | p.Ser451Phe | p.S451F | Q13421 | protein_coding | tolerated(0.78) | benign(0.009) | TCGA-5L-AAT1-01 | Breast | breast invasive carcinoma | Female | <65 | III/IV | Hormone Therapy | letrozol | SD |
| MSLN | SNV | Missense_Mutation | c.375N>A | p.Phe125Leu | p.F125L | Q13421 | protein_coding | deleterious(0) | probably_damaging(0.996) | TCGA-A1-A0SJ-01 | Breast | breast invasive carcinoma | Female | <65 | III/IV | Unknown | Unknown | SD | |
| MSLN | SNV | Missense_Mutation | c.148N>A | p.Gly50Arg | p.G50R | Q13421 | protein_coding | tolerated(0.42) | possibly_damaging(0.619) | TCGA-AR-A0TT-01 | Breast | breast invasive carcinoma | Female | <65 | III/IV | Chemotherapy | doxorubicin | SD | |
| MSLN | SNV | Missense_Mutation | rs566010506 | c.1723C>T | p.Arg575Trp | p.R575W | Q13421 | protein_coding | deleterious(0.03) | possibly_damaging(0.765) | TCGA-2W-A8YY-01 | Cervix | cervical & endocervical cancer | Female | <65 | I/II | Chemotherapy | cisplatin | CR |
| MSLN | SNV | Missense_Mutation | novel | c.326N>G | p.Ser109Cys | p.S109C | Q13421 | protein_coding | tolerated(0.06) | possibly_damaging(0.907) | TCGA-JW-A5VL-01 | Cervix | cervical & endocervical cancer | Female | <65 | I/II | Unknown | Unknown | SD |
| MSLN | insertion | Frame_Shift_Ins | novel | c.1448_1449insCA | p.Leu484ThrfsTer13 | p.L484Tfs*13 | Q13421 | protein_coding | TCGA-DS-A1OA-01 | Cervix | cervical & endocervical cancer | Female | >=65 | I/II | Chemotherapy | carboplatin | PD | ||
| MSLN | SNV | Missense_Mutation | rs147793202 | c.428N>A | p.Arg143His | p.R143H | Q13421 | protein_coding | tolerated(0.56) | possibly_damaging(0.733) | TCGA-A6-2686-01 | Colorectum | colon adenocarcinoma | Female | >=65 | I/II | Unknown | Unknown | SD |
| MSLN | SNV | Missense_Mutation | rs145025982 | c.571G>A | p.Asp191Asn | p.D191N | Q13421 | protein_coding | deleterious(0.02) | probably_damaging(0.996) | TCGA-AA-3510-01 | Colorectum | colon adenocarcinoma | Male | >=65 | I/II | Unknown | Unknown | SD |
| MSLN | SNV | Missense_Mutation | novel | c.1195N>T | p.Leu399Phe | p.L399F | Q13421 | protein_coding | deleterious(0) | probably_damaging(0.997) | TCGA-AA-A010-01 | Colorectum | colon adenocarcinoma | Female | <65 | I/II | Chemotherapy | folinic | CR |
| MSLN | SNV | Missense_Mutation | rs751744116 | c.1238N>A | p.Arg413Gln | p.R413Q | Q13421 | protein_coding | tolerated(1) | benign(0.005) | TCGA-AY-6197-01 | Colorectum | colon adenocarcinoma | Male | <65 | I/II | Unknown | Unknown | SD |
| Page: 1 2 3 4 5 6 7 |
Top |
Related drugs of malignant transformation related genes |
| Identification of chemicals and drugs interact with genes involved in malignant transfromation |
| (DGIdb 4.0) |
| Entrez ID | Symbol | Category | Interaction Types | Drug Claim Name | Drug Name | PMIDs |
| 10232 | MSLN | SERINE THREONINE KINASE, CELL SURFACE, DRUGGABLE GENOME | RG7882 | |||
| 10232 | MSLN | SERINE THREONINE KINASE, CELL SURFACE, DRUGGABLE GENOME | CAR-T cells targeting Mesothelin | |||
| 10232 | MSLN | SERINE THREONINE KINASE, CELL SURFACE, DRUGGABLE GENOME | CAR-T cells targeting mesothelin | |||
| 10232 | MSLN | SERINE THREONINE KINASE, CELL SURFACE, DRUGGABLE GENOME | CART-meso-19 T cells | |||
| 10232 | MSLN | SERINE THREONINE KINASE, CELL SURFACE, DRUGGABLE GENOME | Hu-CART meso cells | |||
| 10232 | MSLN | SERINE THREONINE KINASE, CELL SURFACE, DRUGGABLE GENOME | AMATUXIMAB | AMATUXIMAB | ||
| 10232 | MSLN | SERINE THREONINE KINASE, CELL SURFACE, DRUGGABLE GENOME | Mesothelin-targeted T cells | |||
| 10232 | MSLN | SERINE THREONINE KINASE, CELL SURFACE, DRUGGABLE GENOME | Anti-meso-CAR vector transduced T cells | |||
| 10232 | MSLN | SERINE THREONINE KINASE, CELL SURFACE, DRUGGABLE GENOME | HuCART-meso cells | |||
| 10232 | MSLN | SERINE THREONINE KINASE, CELL SURFACE, DRUGGABLE GENOME | Anti-mesothelin CAR T Cells |
| Page: 1 2 3 |

Copyright 2023-Present -The University of Texas Health Science Center at Houston |