
|
|||||
|
 | |
| |
| |
| |
| |
| |
|
Gene: MSL1 |
Gene summary for MSL1 |
| Gene information | Species | Human | Gene symbol | MSL1 | Gene ID | 339287 |
| Gene name | MSL complex subunit 1 | |
| Gene Alias | MSL-1 | |
| Cytomap | 17q21.1 | |
| Gene Type | protein-coding | GO ID | GO:0006464 | UniProtAcc | B3KWR7 |
Top |
Malignant transformation analysis |
| Identification of the aberrant gene expression in precancerous and cancerous lesions by comparing the gene expression of stem-like cells in diseased tissues with normal stem cells |
| Entrez ID | Symbol | Replicates | Species | Organ | Tissue | Adj P-value | Log2FC | Malignancy |
| 339287 | MSL1 | GSM4909291 | Human | Breast | IDC | 8.48e-58 | 1.18e+00 | 0.1753 |
| 339287 | MSL1 | GSM4909292 | Human | Breast | IDC | 2.33e-16 | 1.02e+00 | 0.1236 |
| 339287 | MSL1 | GSM4909294 | Human | Breast | IDC | 4.80e-13 | 3.79e-01 | 0.2022 |
| 339287 | MSL1 | GSM4909296 | Human | Breast | IDC | 1.09e-02 | -9.63e-02 | 0.1524 |
| 339287 | MSL1 | GSM4909311 | Human | Breast | IDC | 3.66e-06 | -1.18e-01 | 0.1534 |
| 339287 | MSL1 | GSM4909319 | Human | Breast | IDC | 1.21e-09 | -1.39e-01 | 0.1563 |
| 339287 | MSL1 | GSM4909320 | Human | Breast | IDC | 4.80e-03 | -1.59e-01 | 0.1575 |
| 339287 | MSL1 | GSM4909321 | Human | Breast | IDC | 1.43e-02 | -1.36e-01 | 0.1559 |
| 339287 | MSL1 | NCCBC14 | Human | Breast | DCIS | 1.81e-50 | 1.21e+00 | 0.2021 |
| 339287 | MSL1 | NCCBC2 | Human | Breast | DCIS | 5.90e-03 | 8.99e-02 | 0.1554 |
| 339287 | MSL1 | NCCBC5 | Human | Breast | DCIS | 2.38e-03 | 2.01e-01 | 0.2046 |
| 339287 | MSL1 | P1 | Human | Breast | IDC | 5.27e-04 | 1.40e-02 | 0.1527 |
| 339287 | MSL1 | DCIS2 | Human | Breast | DCIS | 1.72e-37 | 1.73e-01 | 0.0085 |
| 339287 | MSL1 | HCC1_Meng | Human | Liver | HCC | 9.48e-48 | 7.86e-02 | 0.0246 |
| 339287 | MSL1 | HCC2_Meng | Human | Liver | HCC | 5.40e-35 | 2.24e-01 | 0.0107 |
| 339287 | MSL1 | cirrhotic2 | Human | Liver | Cirrhotic | 1.08e-02 | 6.40e-02 | 0.0201 |
| 339287 | MSL1 | HCC1 | Human | Liver | HCC | 5.43e-04 | 2.80e+00 | 0.5336 |
| 339287 | MSL1 | HCC2 | Human | Liver | HCC | 7.48e-04 | 2.29e+00 | 0.5341 |
| 339287 | MSL1 | Pt13.b | Human | Liver | HCC | 2.04e-06 | 1.16e-01 | 0.0251 |
| 339287 | MSL1 | Pt14.a | Human | Liver | HCC | 9.18e-07 | 4.48e-01 | 0.0169 |
| Page: 1 2 3 4 |
| Tissue | Expression Dynamics | Abbreviation |
| Breast | 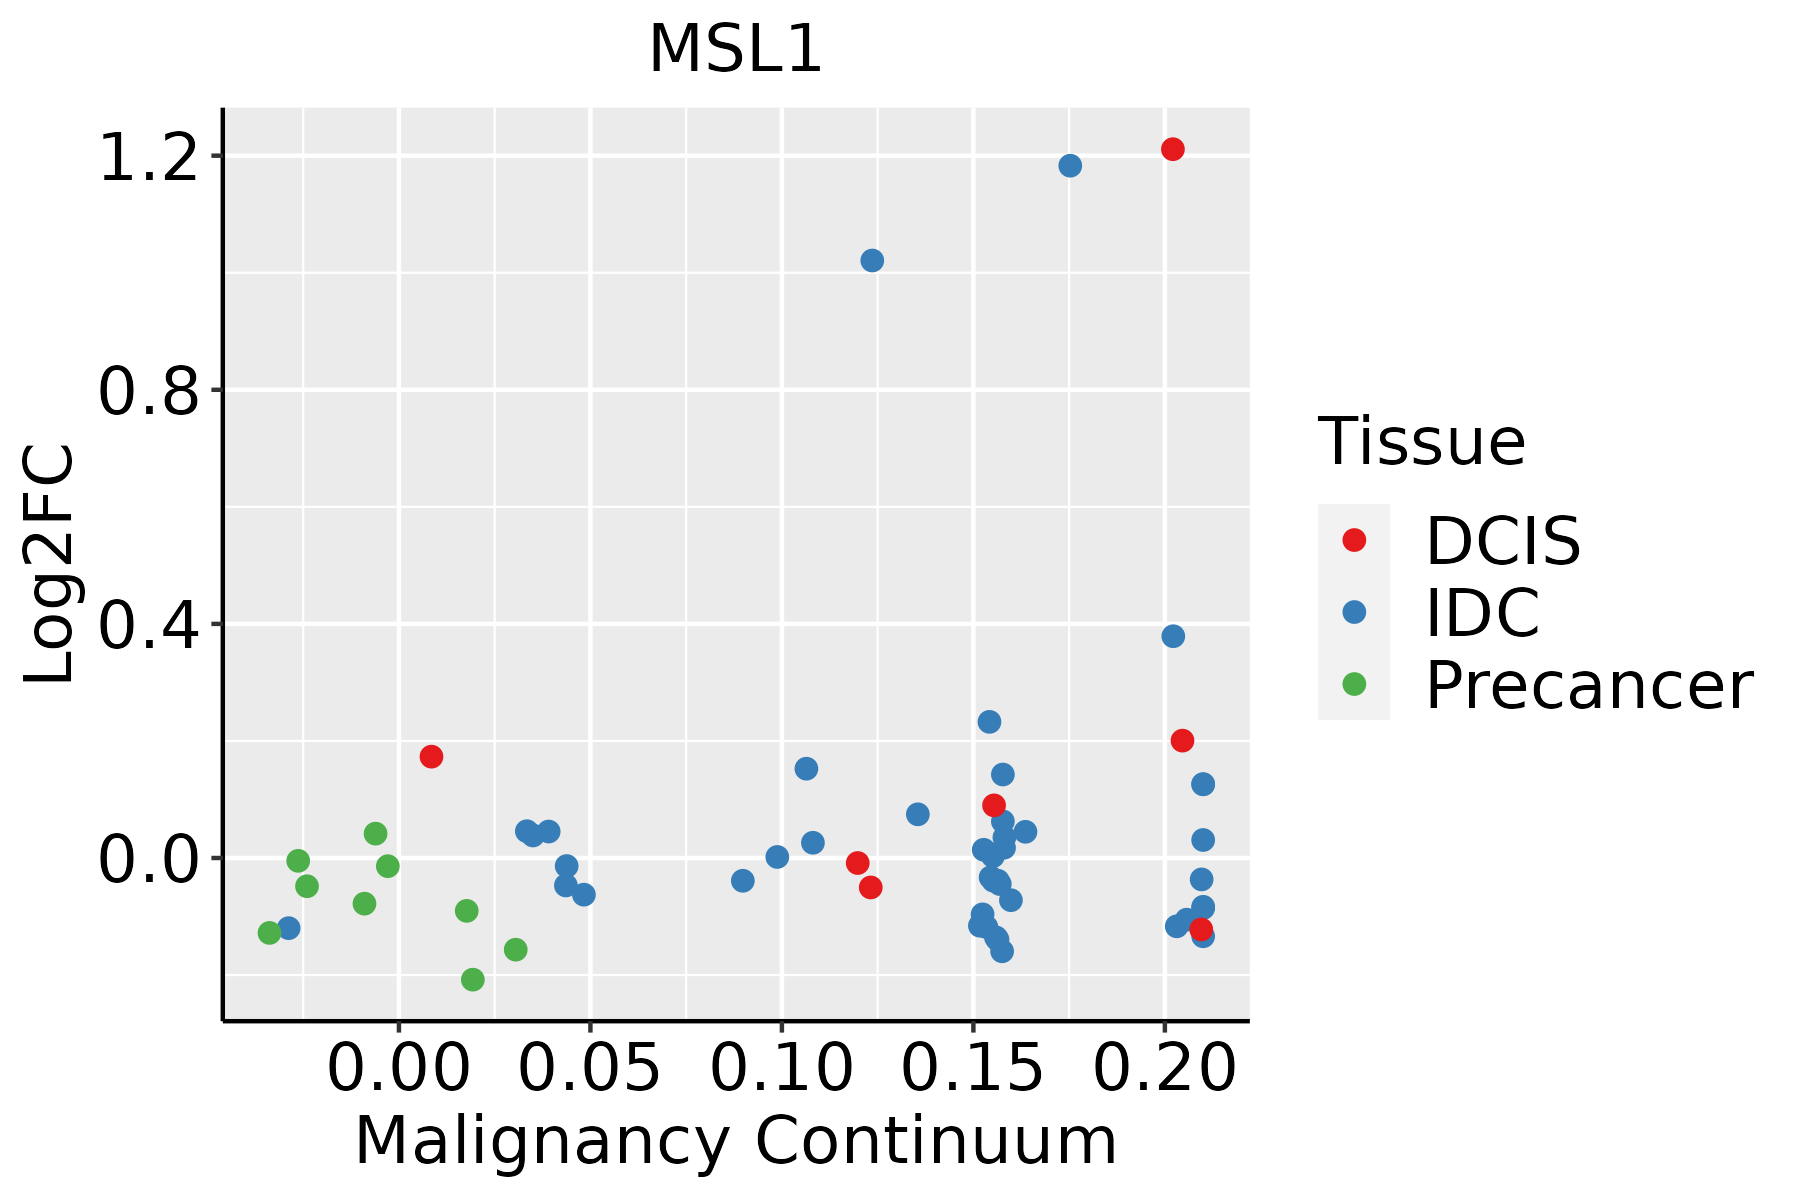 | IDC: Invasive ductal carcinoma |
| DCIS: Ductal carcinoma in situ | ||
| Precancer(BRCA1-mut): Precancerous lesion from BRCA1 mutation carriers | ||
| Liver | 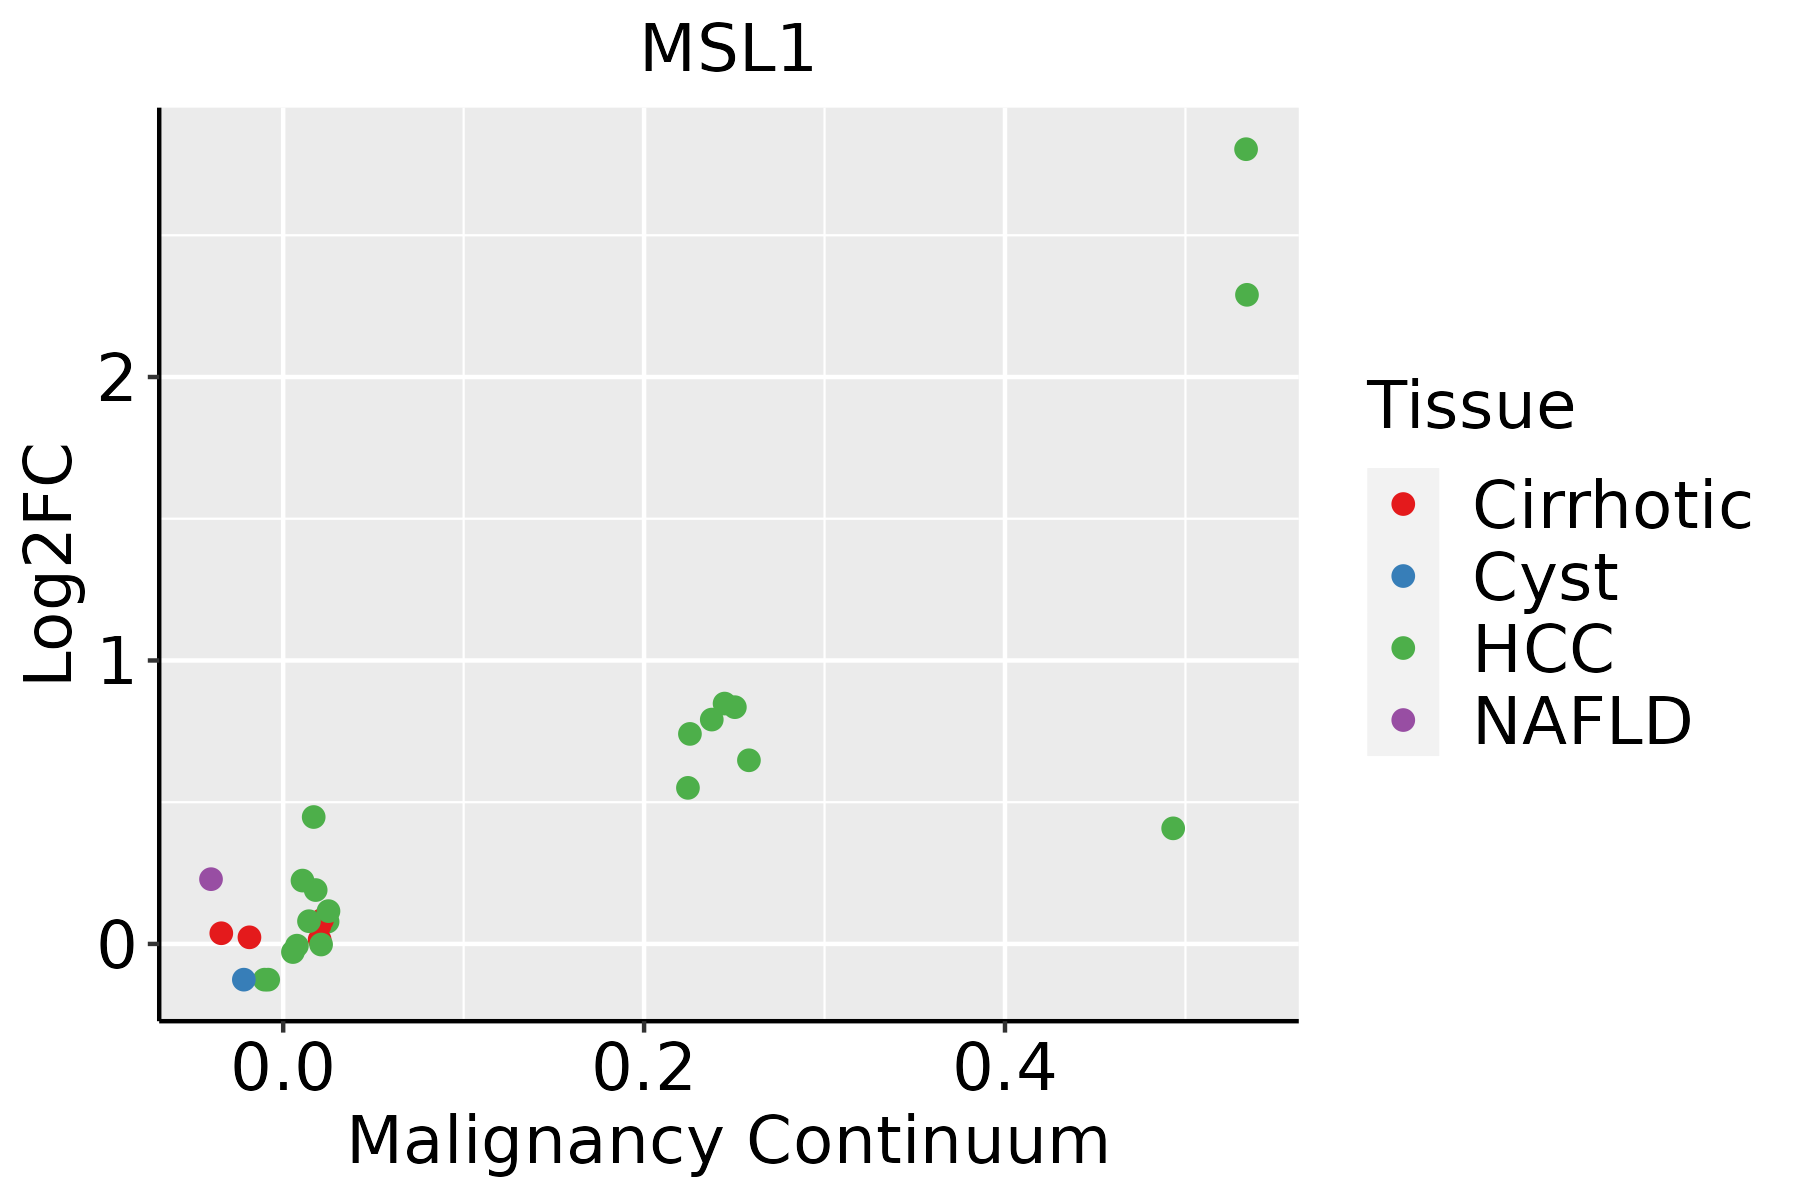 | HCC: Hepatocellular carcinoma |
| NAFLD: Non-alcoholic fatty liver disease | ||
| Oral Cavity | 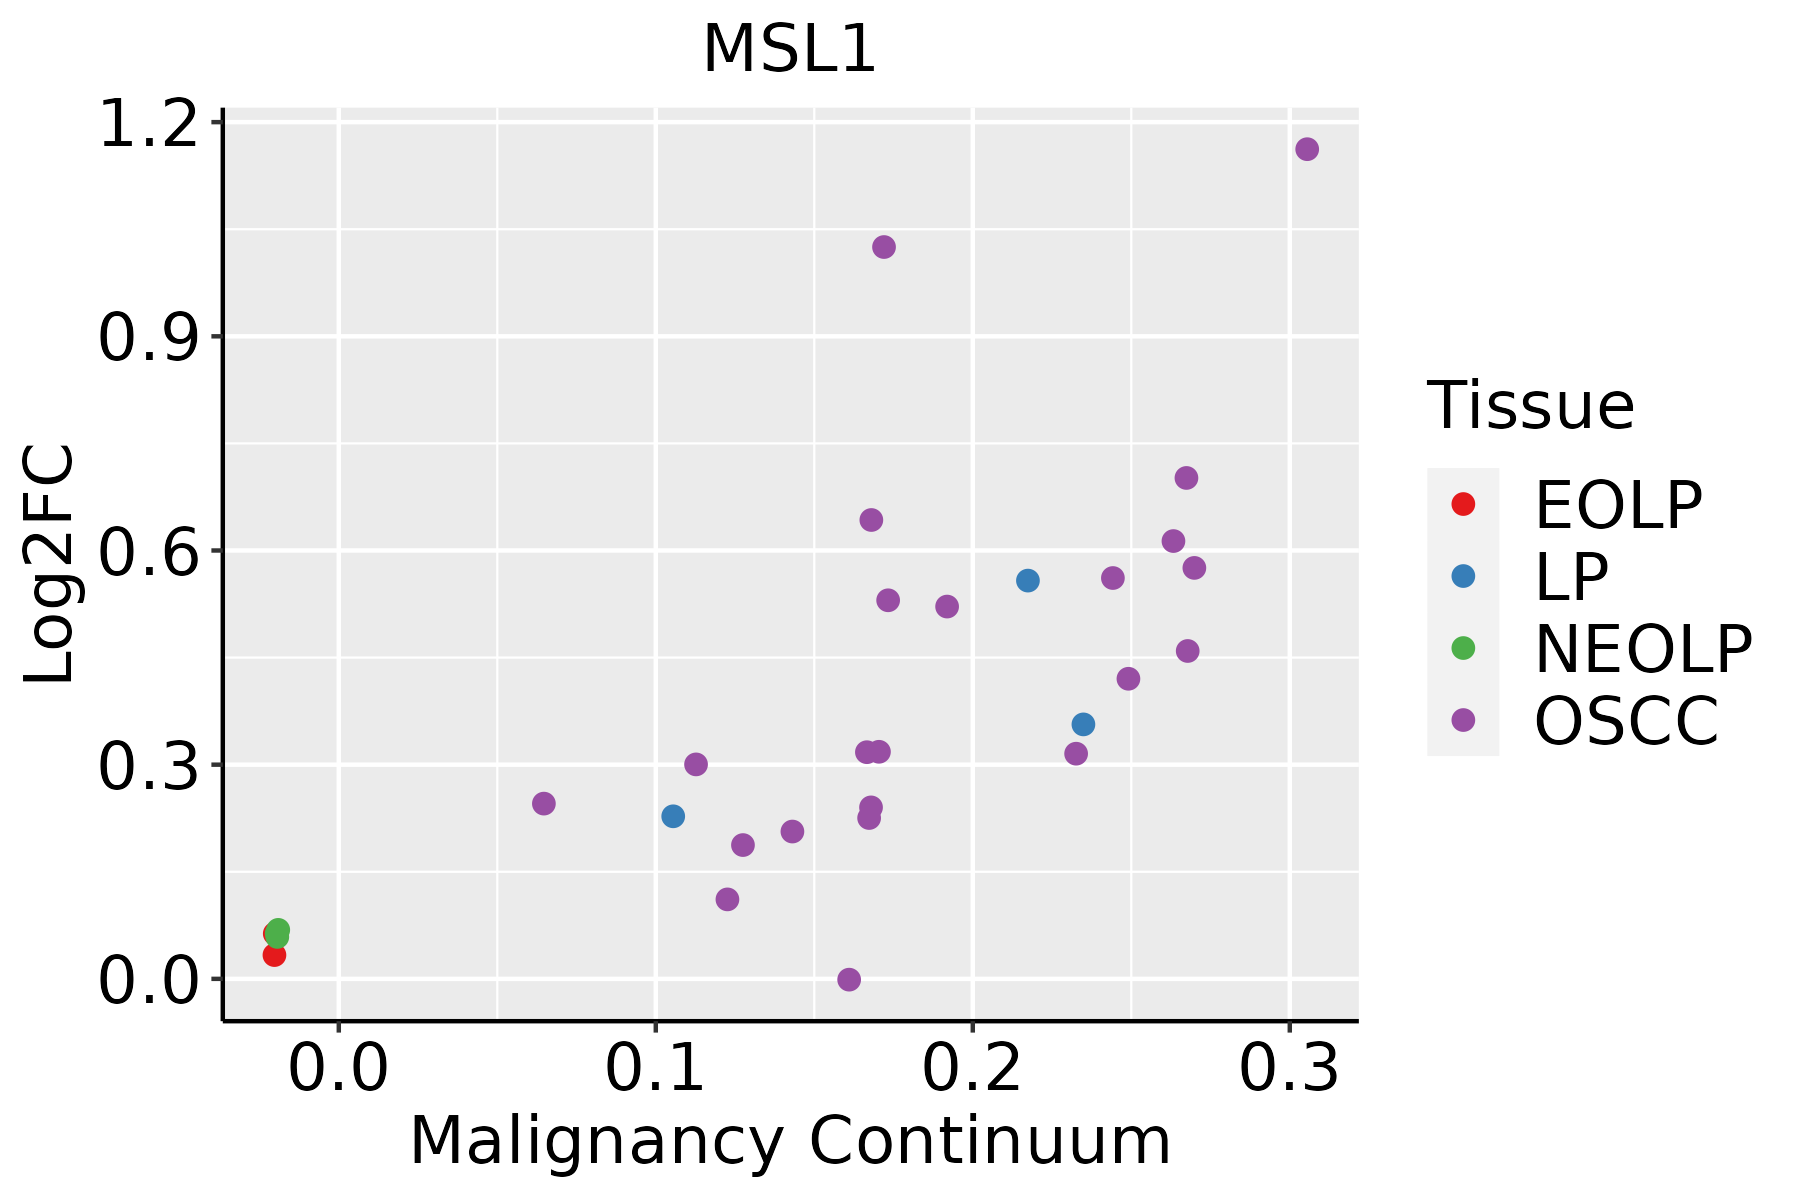 | EOLP: Erosive Oral lichen planus |
| LP: leukoplakia | ||
| NEOLP: Non-erosive oral lichen planus | ||
| OSCC: Oral squamous cell carcinoma | ||
| Prostate | 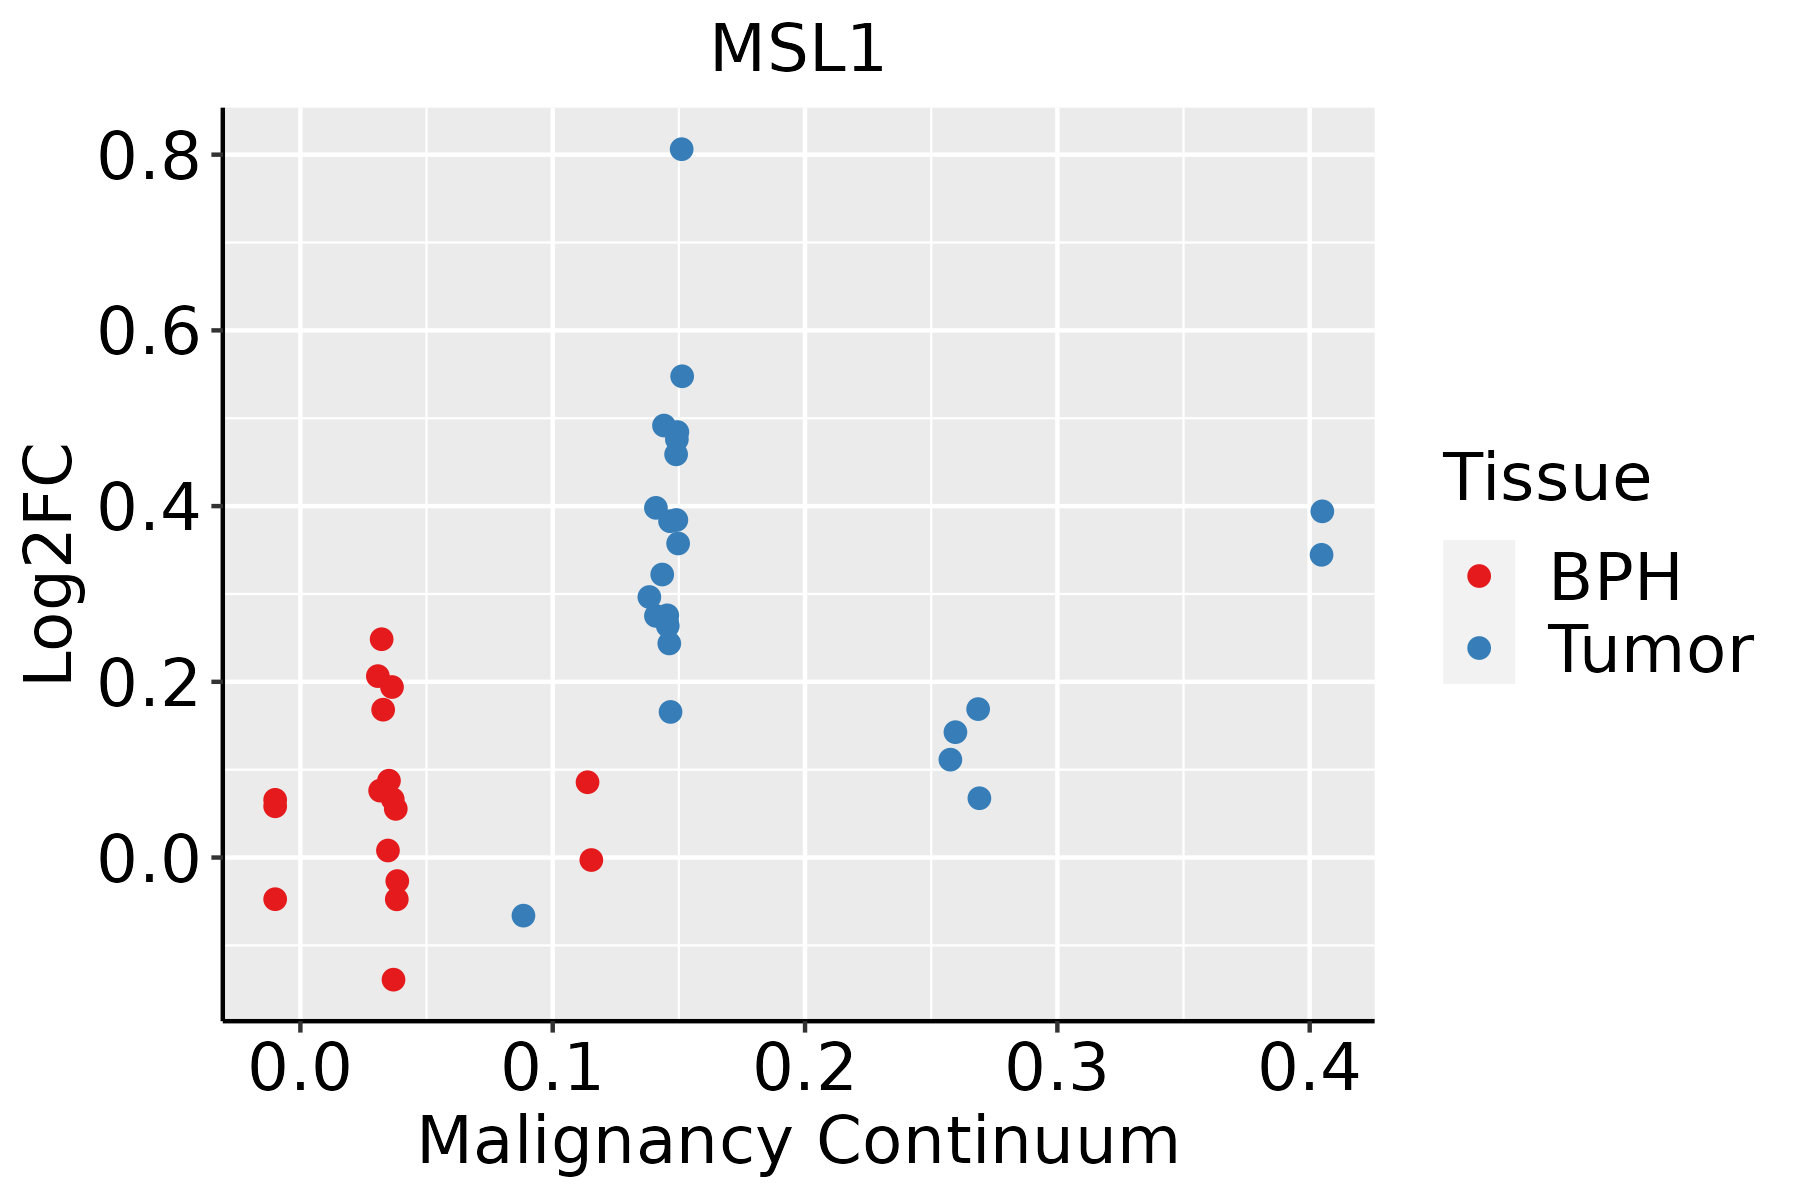 | BPH: Benign Prostatic Hyperplasia |
| Thyroid | 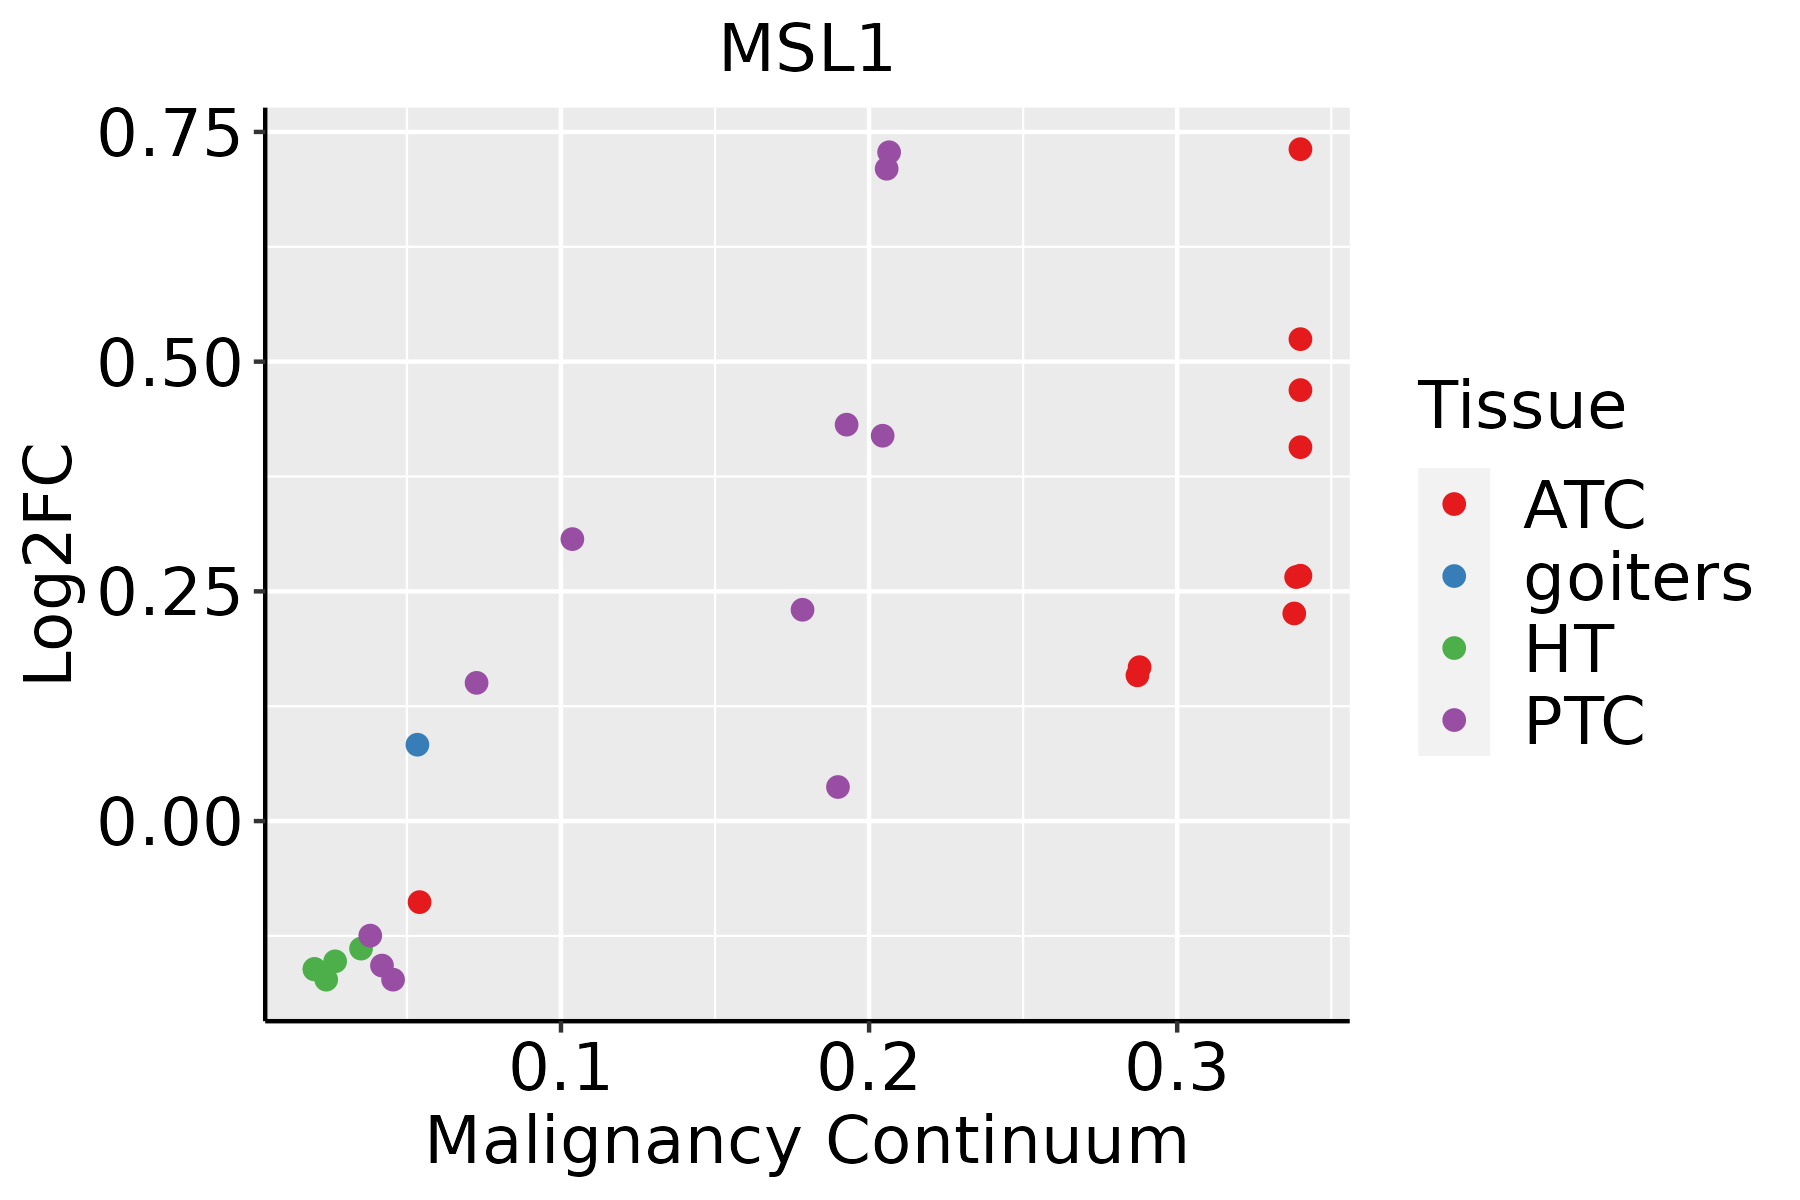 | ATC: Anaplastic thyroid cancer |
| HT: Hashimoto's thyroiditis | ||
| PTC: Papillary thyroid cancer |
| ∗log2FC in expression of this searched gene in stem-like cells from each diseased tissue sample relative to stem-like cells in normal samples in each tissue plotted against the malignancy continuum. Samples are colored based on if they are from different disease stage. |
Top |
Malignant transformation related pathway analysis |
| Find out the enriched GO biological processes and KEGG pathways involved in transition from healthy to precancer to cancer |
| Tissue | Disease Stage | Enriched GO biological Processes |
| Colorectum | AD |  |
| Colorectum | SER |  |
| Colorectum | MSS |  |
| Colorectum | MSI-H |  |
| Colorectum | FAP |  |
| ∗Top 15 enriched GO BP terms are showed in the bar plot of each disease state in each tissue. Each row represents a significant GO biological process which is colored according to the -log10(p.adjust). |
| Page: 1 2 3 4 5 6 7 8 9 |
| GO ID | Tissue | Disease Stage | Description | Gene Ratio | Bg Ratio | pvalue | p.adjust | Count |
| GO:00064731 | Liver | Cirrhotic | protein acetylation | 84/4634 | 201/18723 | 7.50e-08 | 2.25e-06 | 84 |
| GO:00183941 | Liver | Cirrhotic | peptidyl-lysine acetylation | 73/4634 | 169/18723 | 1.08e-07 | 3.07e-06 | 73 |
| GO:00435431 | Liver | Cirrhotic | protein acylation | 95/4634 | 243/18723 | 4.73e-07 | 1.07e-05 | 95 |
| GO:00182051 | Liver | Cirrhotic | peptidyl-lysine modification | 134/4634 | 376/18723 | 1.29e-06 | 2.59e-05 | 134 |
| GO:00064751 | Liver | Cirrhotic | internal protein amino acid acetylation | 65/4634 | 160/18723 | 6.66e-06 | 1.04e-04 | 65 |
| GO:00183931 | Liver | Cirrhotic | internal peptidyl-lysine acetylation | 64/4634 | 158/18723 | 8.75e-06 | 1.29e-04 | 64 |
| GO:001657011 | Liver | Cirrhotic | histone modification | 154/4634 | 463/18723 | 1.92e-05 | 2.57e-04 | 154 |
| GO:00165731 | Liver | Cirrhotic | histone acetylation | 61/4634 | 152/18723 | 1.97e-05 | 2.62e-04 | 61 |
| GO:0043967 | Liver | Cirrhotic | histone H4 acetylation | 31/4634 | 67/18723 | 1.03e-04 | 1.06e-03 | 31 |
| GO:001657021 | Liver | HCC | histone modification | 283/7958 | 463/18723 | 2.68e-16 | 2.33e-14 | 283 |
| GO:00182052 | Liver | HCC | peptidyl-lysine modification | 230/7958 | 376/18723 | 1.51e-13 | 8.32e-12 | 230 |
| GO:00064732 | Liver | HCC | protein acetylation | 135/7958 | 201/18723 | 1.20e-12 | 5.92e-11 | 135 |
| GO:00435432 | Liver | HCC | protein acylation | 157/7958 | 243/18723 | 2.40e-12 | 1.12e-10 | 157 |
| GO:00183942 | Liver | HCC | peptidyl-lysine acetylation | 116/7958 | 169/18723 | 5.11e-12 | 2.23e-10 | 116 |
| GO:00064752 | Liver | HCC | internal protein amino acid acetylation | 107/7958 | 160/18723 | 3.77e-10 | 1.23e-08 | 107 |
| GO:00183932 | Liver | HCC | internal peptidyl-lysine acetylation | 105/7958 | 158/18723 | 9.48e-10 | 2.90e-08 | 105 |
| GO:00165732 | Liver | HCC | histone acetylation | 101/7958 | 152/18723 | 1.99e-09 | 5.63e-08 | 101 |
| GO:00439671 | Liver | HCC | histone H4 acetylation | 50/7958 | 67/18723 | 9.14e-08 | 1.82e-06 | 50 |
| GO:0043984 | Liver | HCC | histone H4-K16 acetylation | 16/7958 | 20/18723 | 7.15e-04 | 4.37e-03 | 16 |
| GO:00165707 | Oral cavity | OSCC | histone modification | 270/7305 | 463/18723 | 1.59e-17 | 1.50e-15 | 270 |
| Page: 1 2 3 4 |
| Pathway ID | Tissue | Disease Stage | Description | Gene Ratio | Bg Ratio | pvalue | p.adjust | qvalue | Count |
| Page: 1 |
Top |
Cell-cell communication analysis |
| Identification of potential cell-cell interactions between two cell types and their ligand-receptor pairs for different disease states |
| Ligand | Receptor | LRpair | Pathway | Tissue | Disease Stage |
| Page: 1 |
Top |
Single-cell gene regulatory network inference analysis |
| Find out the significant the regulons (TFs) and the target genes of each regulon across cell types for different disease states |
| TF | Cell Type | Tissue | Disease Stage | Target Gene | RSS | Regulon Activity |
| ∗The dot plots of a searched regulon are shown for all cell subpopulations in each disease state of each tissue based on the regulon specific score inferred using pySCENIC and by calculating the average expression. |
| Page: 1 |
Top |
Somatic mutation of malignant transformation related genes |
| Annotation of somatic variants for genes involved in malignant transformation |
| Hugo Symbol | Variant Class | Variant Classification | dbSNP RS | HGVSc | HGVSp | HGVSp Short | SWISSPROT | BIOTYPE | SIFT | PolyPhen | Tumor Sample Barcode | Tissue | Histology | Sex | Age | Stage | Therapy Types | Drugs | Outcome |
| MSL1 | SNV | Missense_Mutation | novel | c.728N>A | p.Arg243Gln | p.R243Q | Q68DK7 | protein_coding | deleterious(0) | probably_damaging(0.979) | TCGA-2W-A8YY-01 | Cervix | cervical & endocervical cancer | Female | <65 | I/II | Chemotherapy | cisplatin | CR |
| MSL1 | SNV | Missense_Mutation | novel | c.504N>T | p.Met168Ile | p.M168I | Q68DK7 | protein_coding | deleterious(0.04) | possibly_damaging(0.584) | TCGA-AA-A00N-01 | Colorectum | colon adenocarcinoma | Male | >=65 | I/II | Unknown | Unknown | PD |
| MSL1 | SNV | Missense_Mutation | c.797G>T | p.Arg266Ile | p.R266I | Q68DK7 | protein_coding | deleterious(0) | probably_damaging(0.991) | TCGA-AA-A010-01 | Colorectum | colon adenocarcinoma | Female | <65 | I/II | Chemotherapy | folinic | CR | |
| MSL1 | SNV | Missense_Mutation | c.11N>A | p.Arg4Gln | p.R4Q | Q68DK7 | protein_coding | deleterious(0) | probably_damaging(0.992) | TCGA-AA-A022-01 | Colorectum | colon adenocarcinoma | Female | >=65 | I/II | Unknown | Unknown | SD | |
| MSL1 | SNV | Missense_Mutation | novel | c.890A>C | p.Asp297Ala | p.D297A | Q68DK7 | protein_coding | tolerated(0.06) | probably_damaging(0.934) | TCGA-AM-5820-01 | Colorectum | colon adenocarcinoma | Female | <65 | I/II | Unknown | Unknown | SD |
| MSL1 | deletion | Frame_Shift_Del | c.871delN | p.Phe292SerfsTer10 | p.F292Sfs*10 | Q68DK7 | protein_coding | TCGA-AA-A02R-01 | Colorectum | colon adenocarcinoma | Female | >=65 | I/II | Unknown | Unknown | PD | |||
| MSL1 | insertion | Frame_Shift_Ins | novel | c.891_892insA | p.Val298SerfsTer2 | p.V298Sfs*2 | Q68DK7 | protein_coding | TCGA-AM-5820-01 | Colorectum | colon adenocarcinoma | Female | <65 | I/II | Unknown | Unknown | SD | ||
| MSL1 | insertion | Frame_Shift_Ins | novel | c.792_793insAAACAAACCAAACAAAA | p.Gln265LysfsTer43 | p.Q265Kfs*43 | Q68DK7 | protein_coding | TCGA-CK-4952-01 | Colorectum | colon adenocarcinoma | Female | <65 | III/IV | Unknown | Unknown | SD | ||
| MSL1 | SNV | Missense_Mutation | novel | c.167N>T | p.Pro56Leu | p.P56L | Q68DK7 | protein_coding | tolerated(0.3) | possibly_damaging(0.451) | TCGA-A5-A0G1-01 | Endometrium | uterine corpus endometrioid carcinoma | Female | >=65 | I/II | Unknown | Unknown | SD |
| MSL1 | SNV | Missense_Mutation | novel | c.167N>T | p.Pro56Leu | p.P56L | Q68DK7 | protein_coding | tolerated(0.3) | possibly_damaging(0.451) | TCGA-A5-A0GG-01 | Endometrium | uterine corpus endometrioid carcinoma | Female | >=65 | I/II | Unknown | Unknown | SD |
| Page: 1 2 3 |
Top |
Related drugs of malignant transformation related genes |
| Identification of chemicals and drugs interact with genes involved in malignant transfromation |
| (DGIdb 4.0) |
| Entrez ID | Symbol | Category | Interaction Types | Drug Claim Name | Drug Name | PMIDs |
| Page: 1 |

Copyright 2023-Present -The University of Texas Health Science Center at Houston |