| Tissue | Expression Dynamics | Abbreviation |
| Breast | 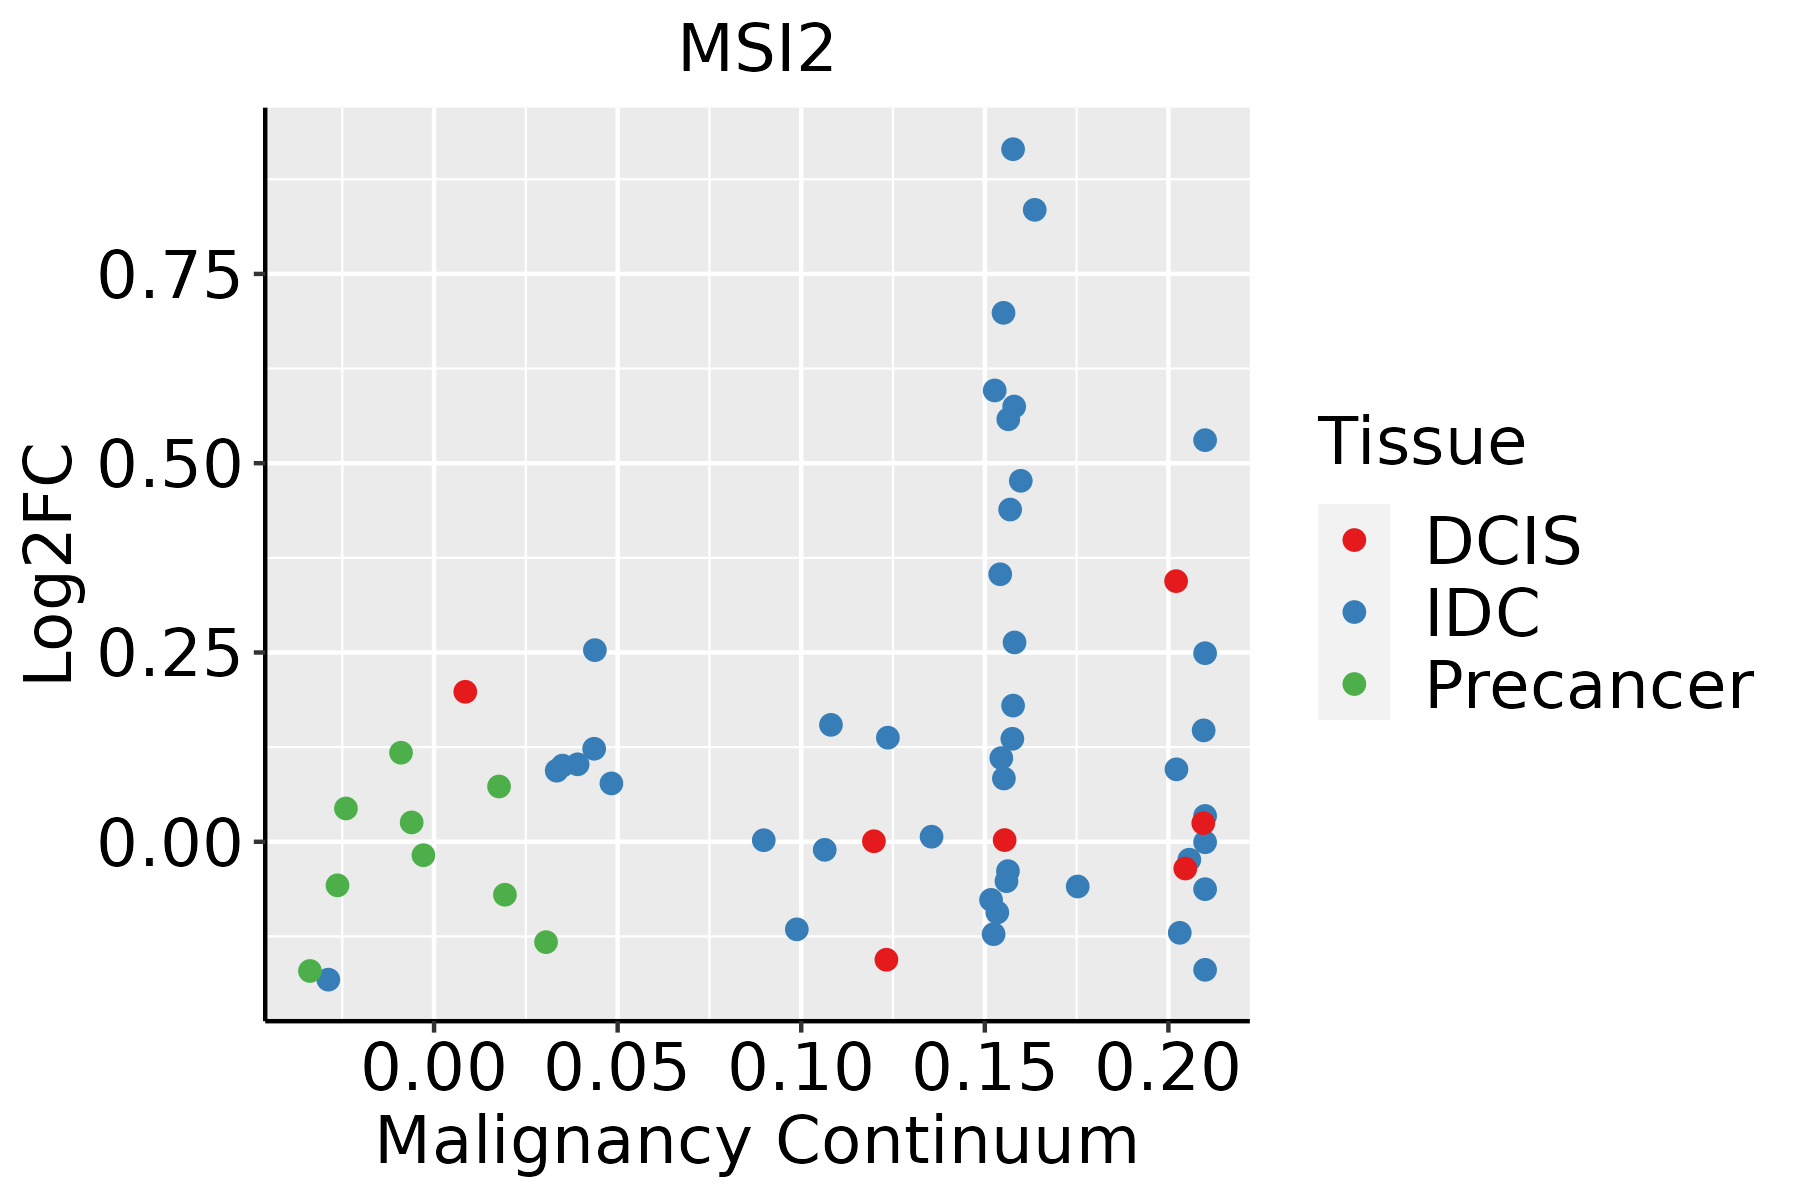 | IDC: Invasive ductal carcinoma |
| DCIS: Ductal carcinoma in situ |
| Precancer(BRCA1-mut): Precancerous lesion from BRCA1 mutation carriers |
| Cervix | 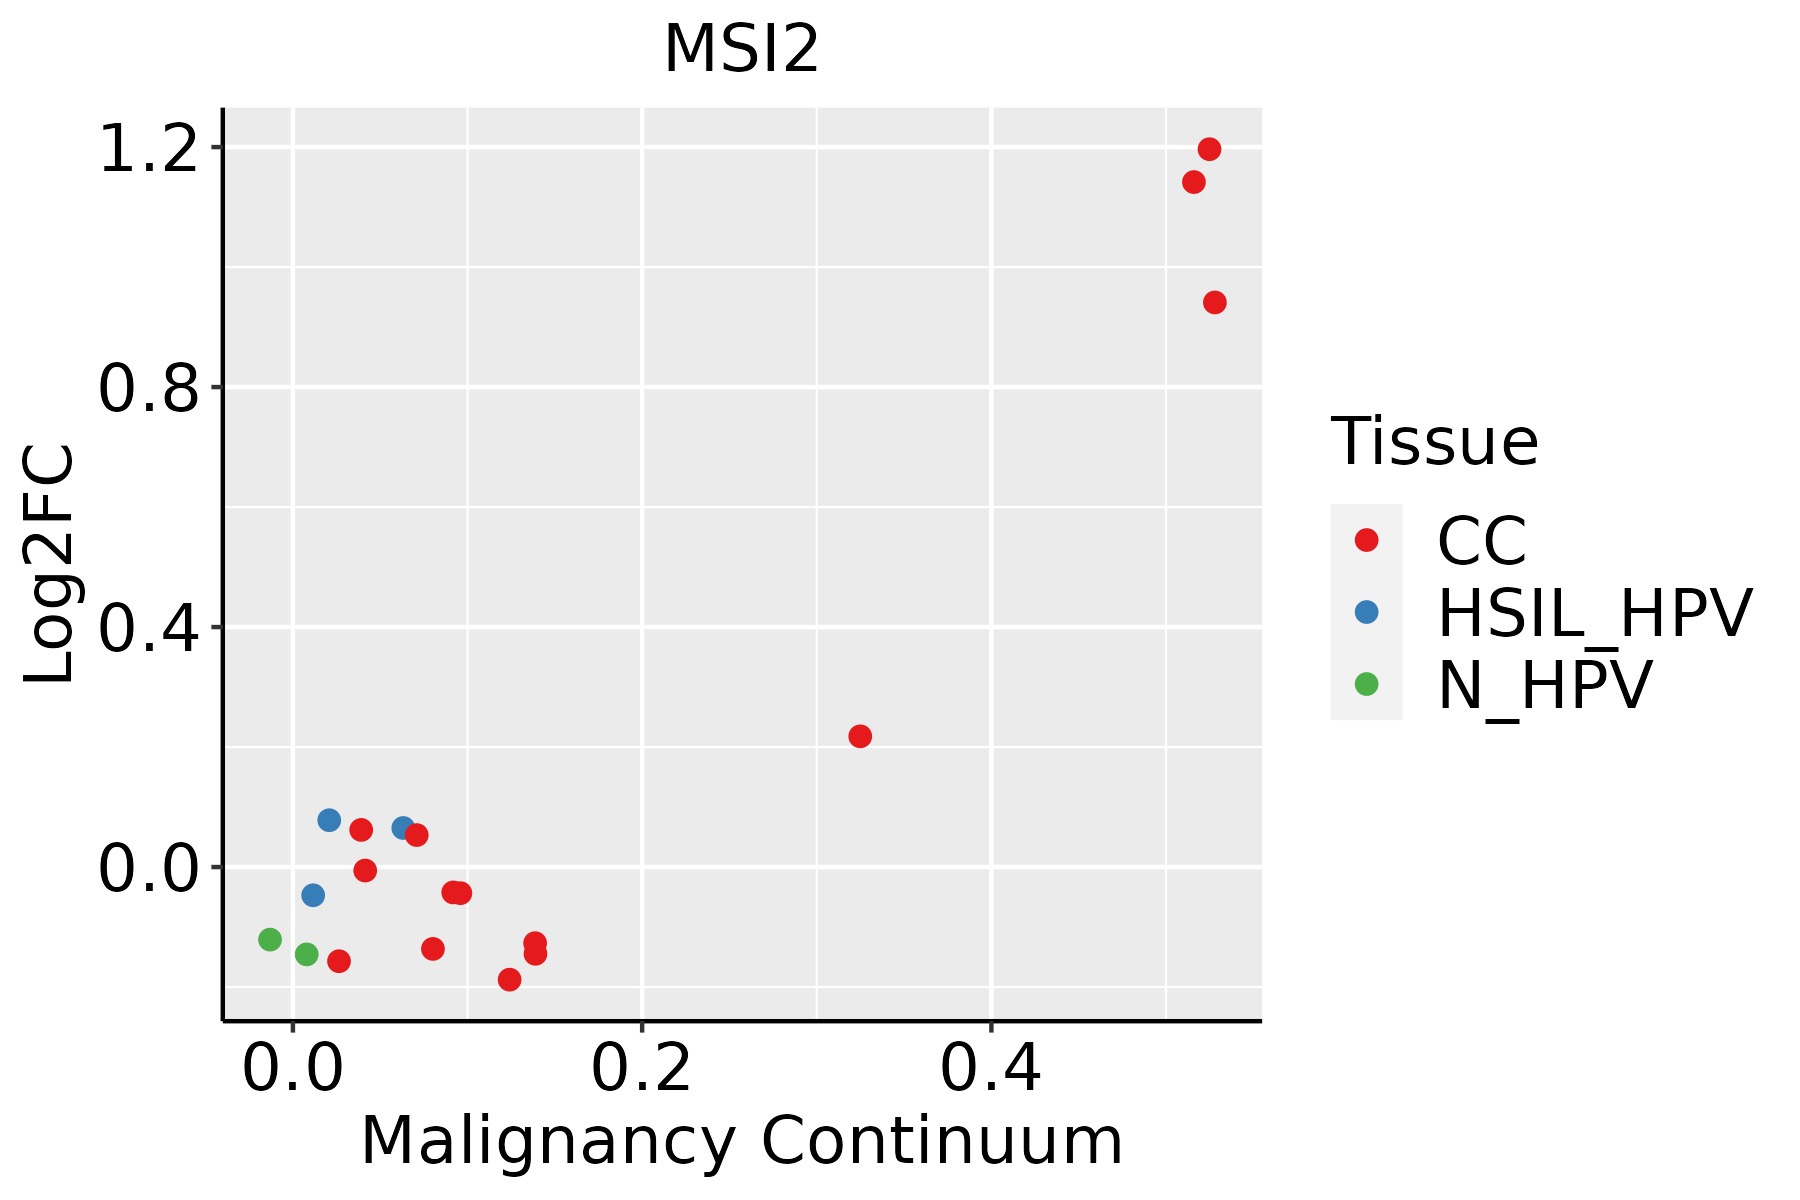 | CC: Cervix cancer |
| HSIL_HPV: HPV-infected high-grade squamous intraepithelial lesions |
| N_HPV: HPV-infected normal cervix |
| Colorectum (GSE201348) |  | FAP: Familial adenomatous polyposis |
| CRC: Colorectal cancer |
| Colorectum (HTA11) |  | AD: Adenomas |
| SER: Sessile serrated lesions |
| MSI-H: Microsatellite-high colorectal cancer |
| MSS: Microsatellite stable colorectal cancer |
| Endometrium |  | AEH: Atypical endometrial hyperplasia |
| EEC: Endometrioid Cancer |
| Esophagus | 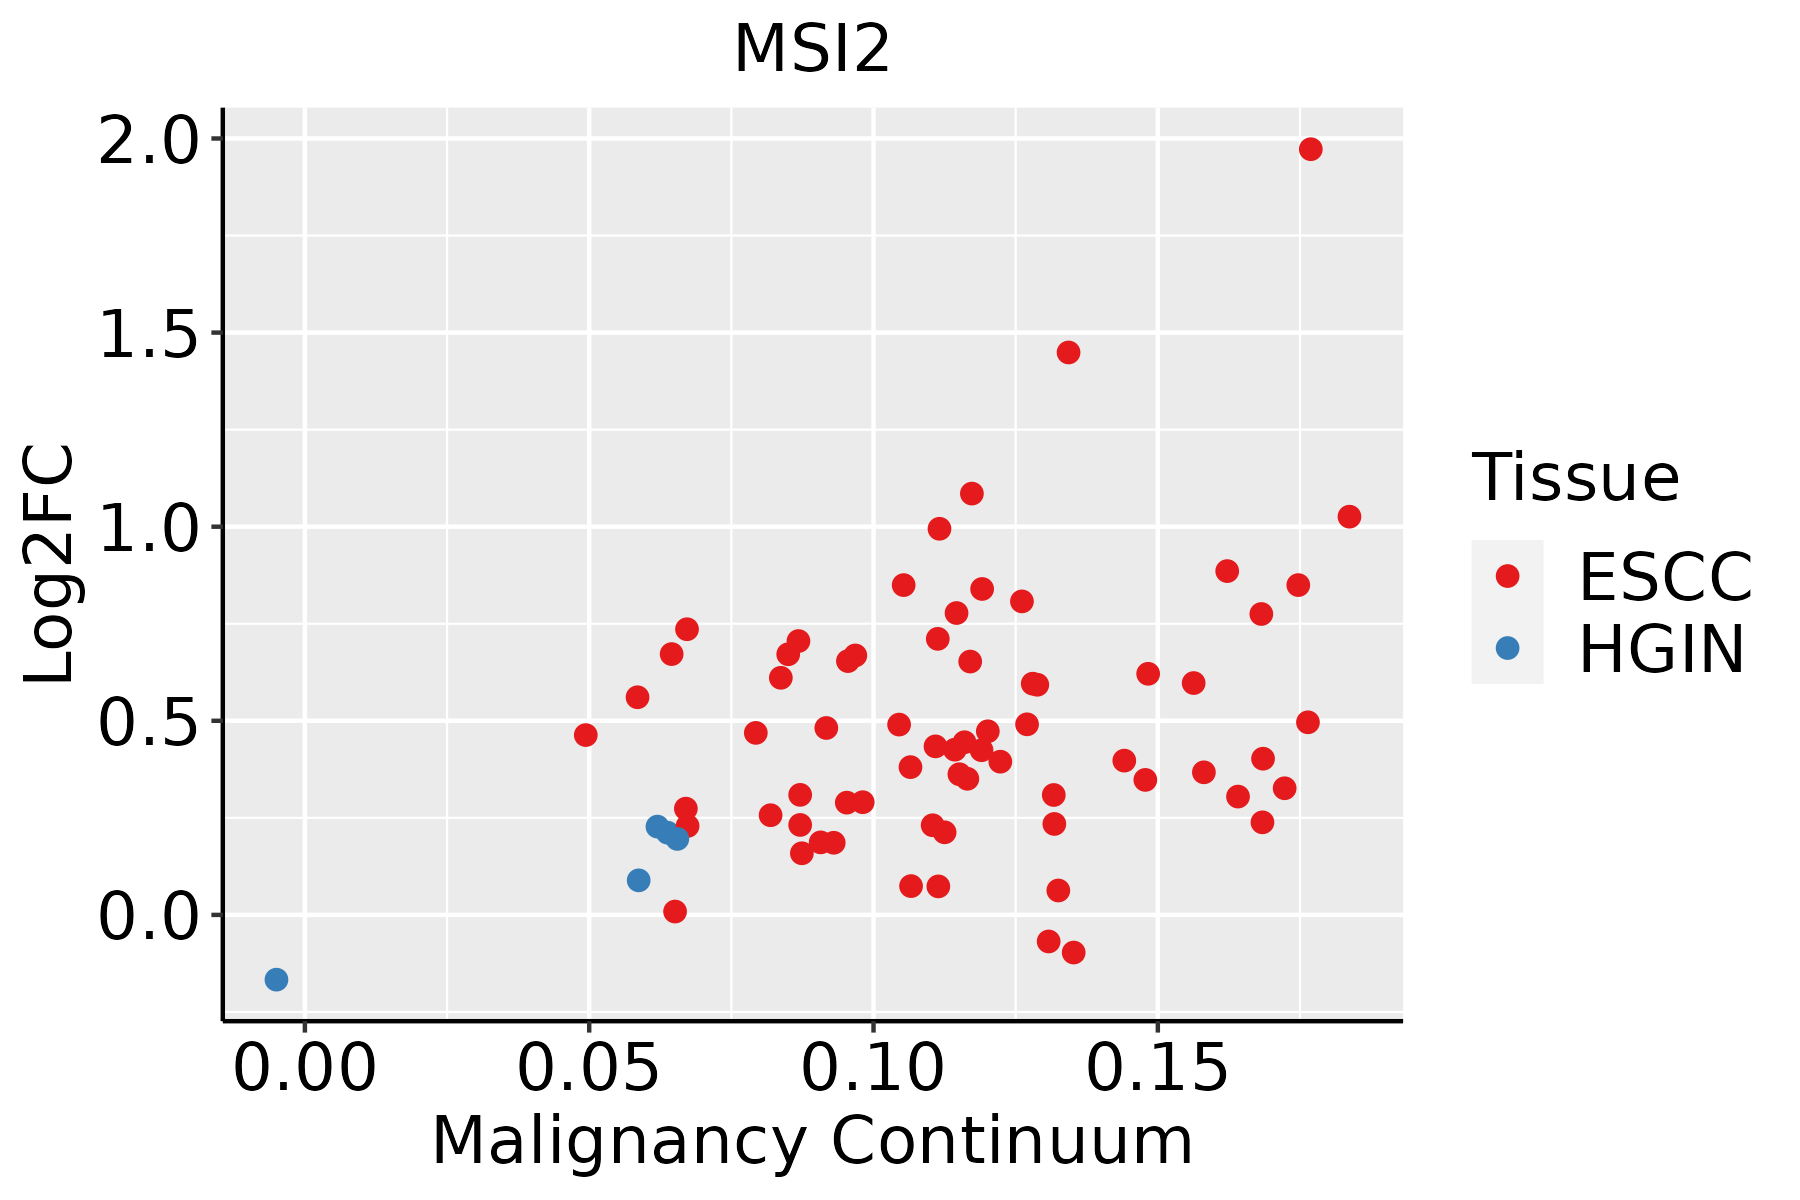 | ESCC: Esophageal squamous cell carcinoma |
| HGIN: High-grade intraepithelial neoplasias |
| LGIN: Low-grade intraepithelial neoplasias |
| Liver | 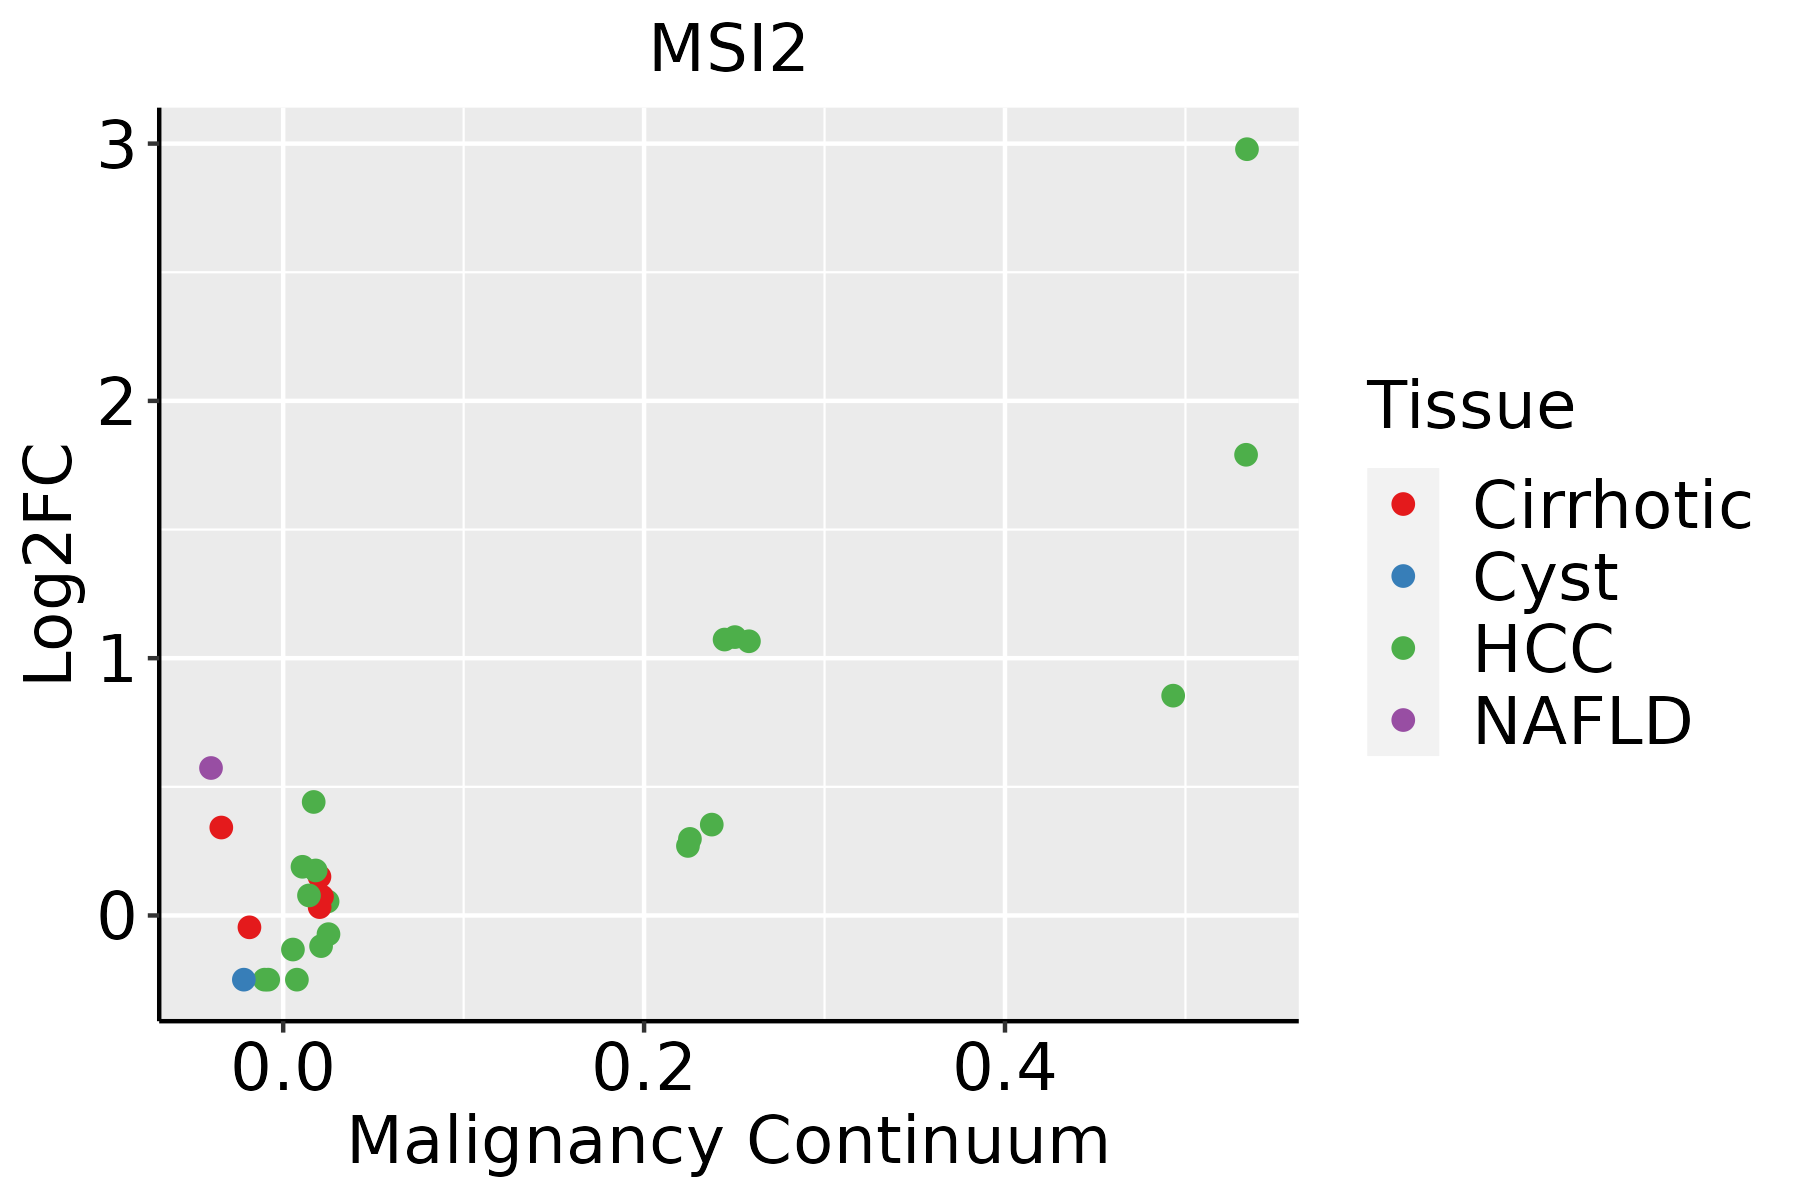 | HCC: Hepatocellular carcinoma |
| NAFLD: Non-alcoholic fatty liver disease |
| Lung | 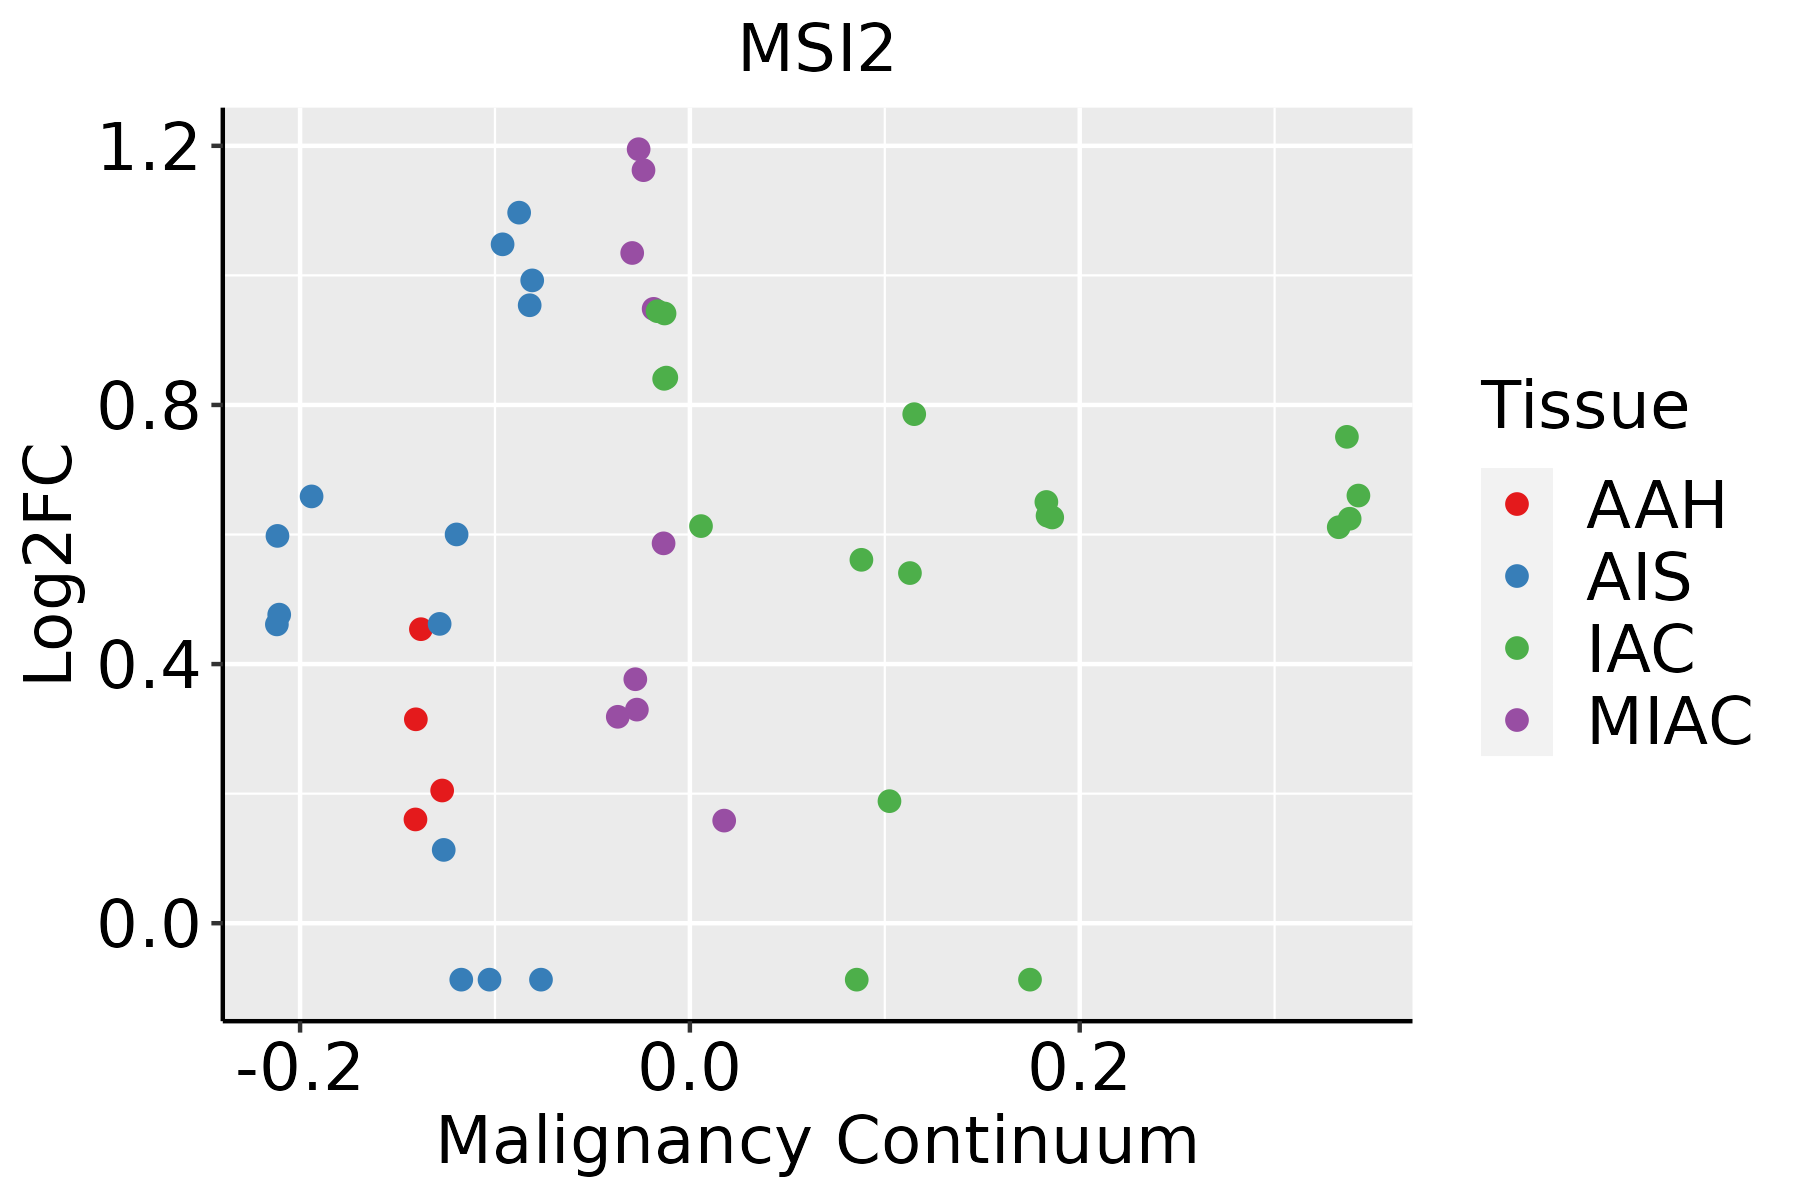 | AAH: Atypical adenomatous hyperplasia |
| AIS: Adenocarcinoma in situ |
| IAC: Invasive lung adenocarcinoma |
| MIA: Minimally invasive adenocarcinoma |
| Oral Cavity |  | EOLP: Erosive Oral lichen planus |
| LP: leukoplakia |
| NEOLP: Non-erosive oral lichen planus |
| OSCC: Oral squamous cell carcinoma |
| Prostate | 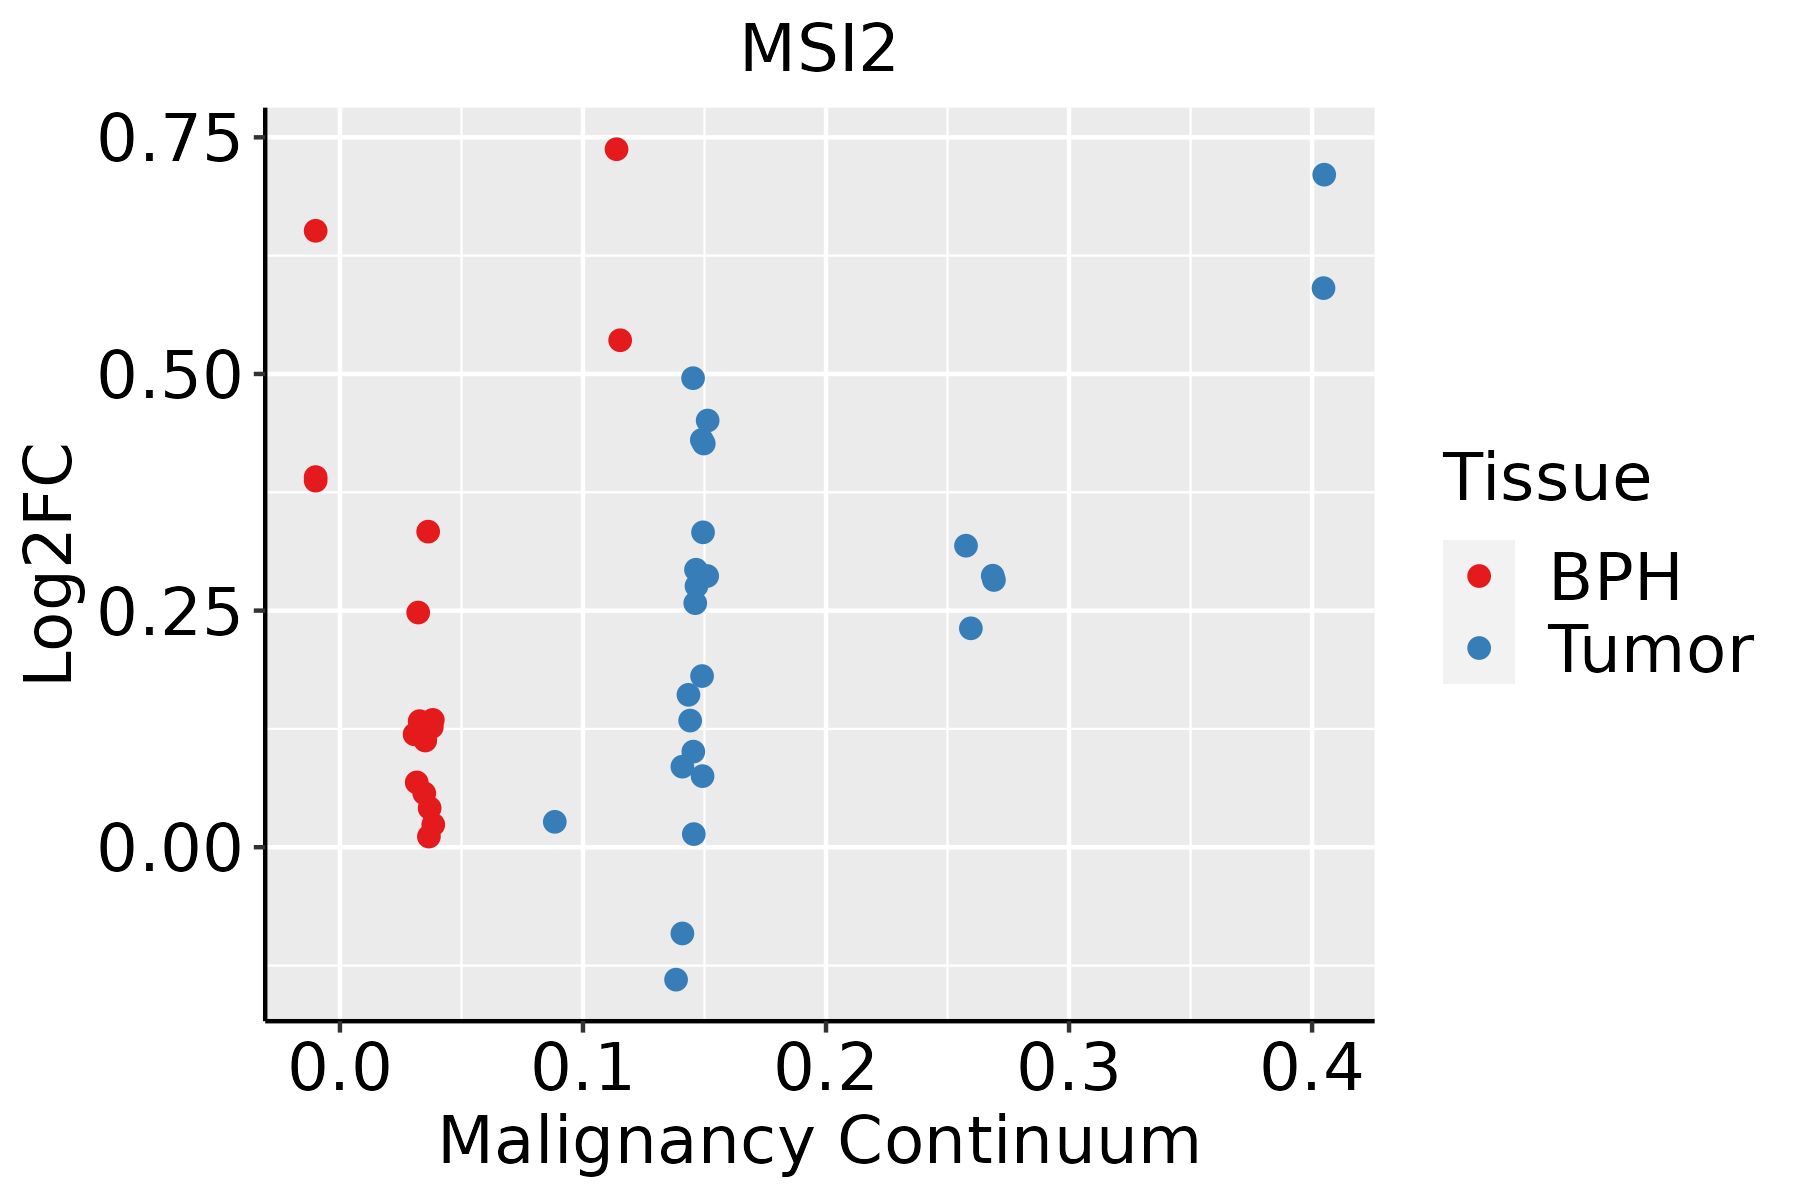 | BPH: Benign Prostatic Hyperplasia |
| Thyroid | 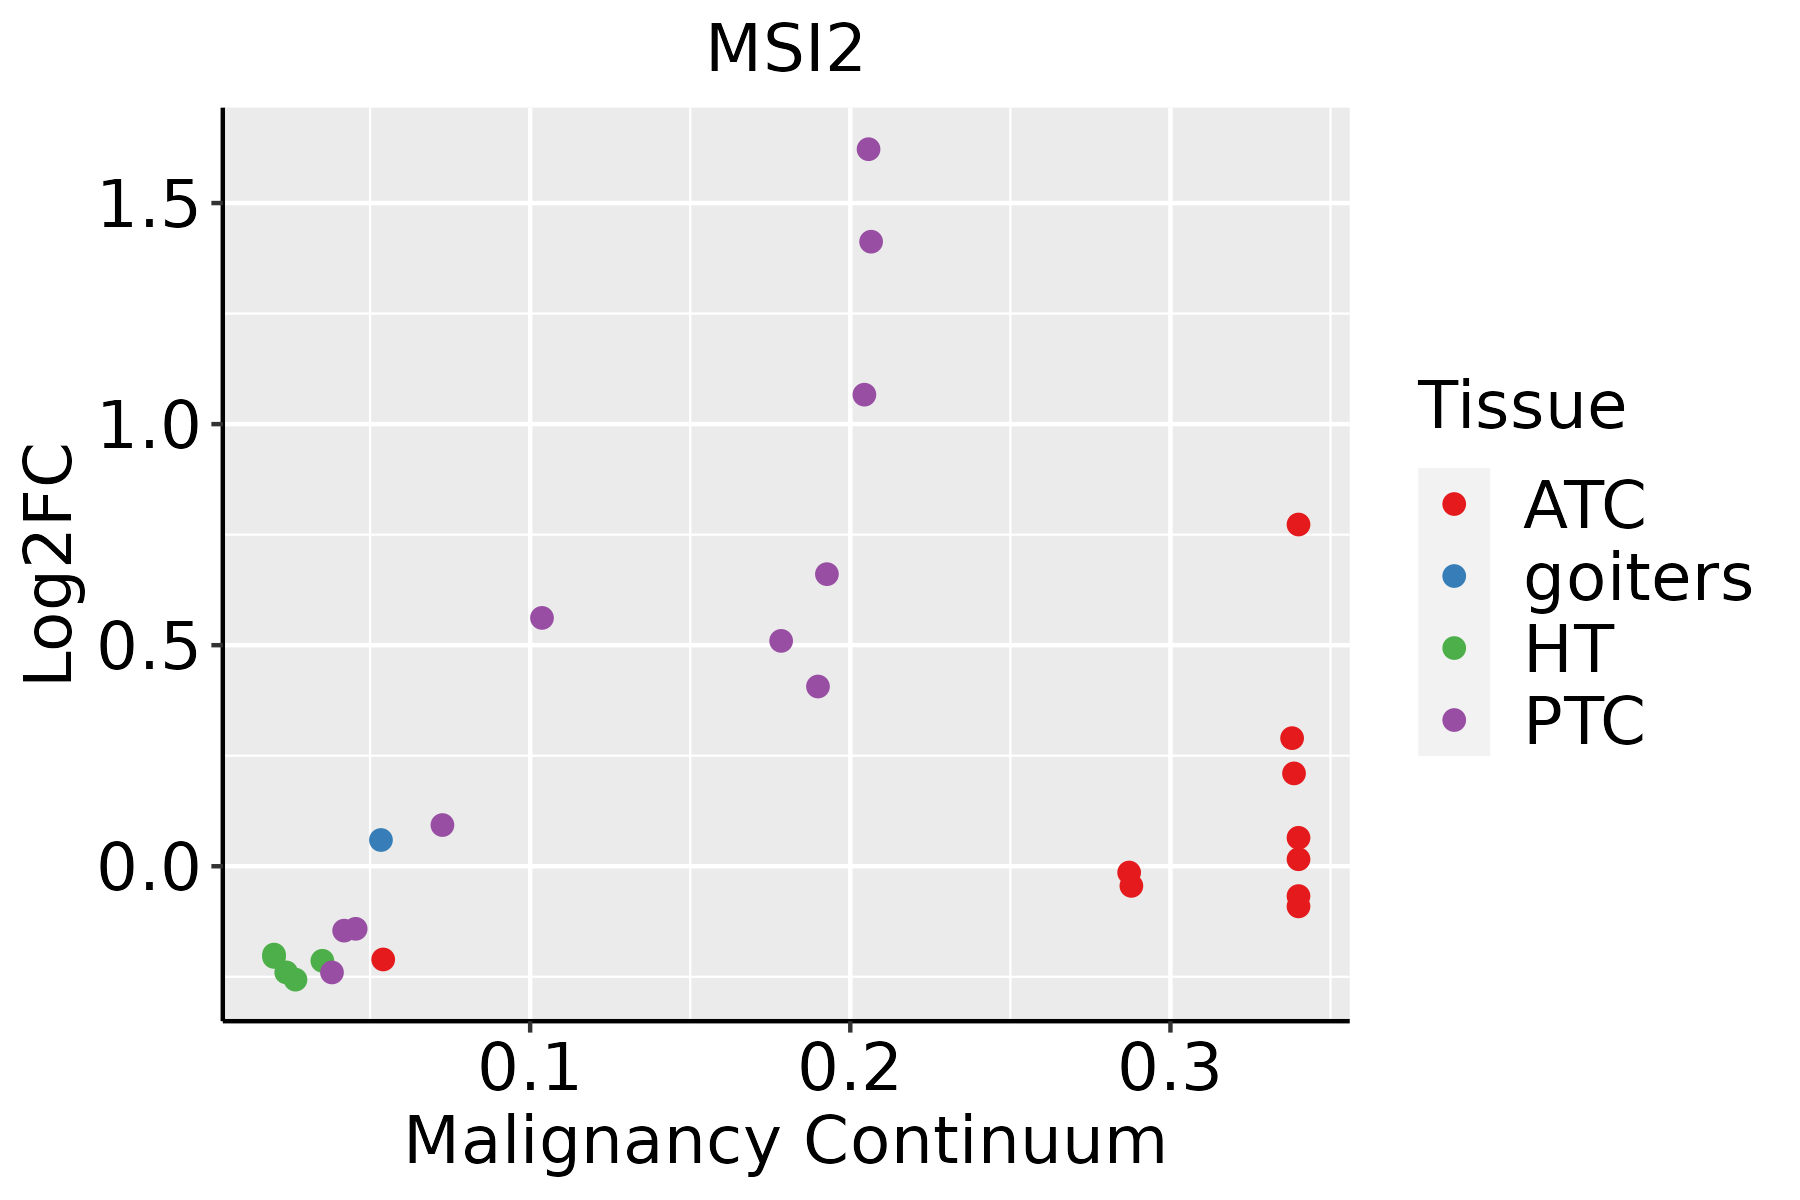 | ATC: Anaplastic thyroid cancer |
| HT: Hashimoto's thyroiditis |
| PTC: Papillary thyroid cancer |
| GO ID | Tissue | Disease Stage | Description | Gene Ratio | Bg Ratio | pvalue | p.adjust | Count |
| GO:00488634 | Cervix | CC | stem cell differentiation | 46/2311 | 206/18723 | 4.11e-05 | 6.36e-04 | 46 |
| GO:0048863 | Colorectum | FAP | stem cell differentiation | 44/2622 | 206/18723 | 2.48e-03 | 1.96e-02 | 44 |
| GO:00488631 | Colorectum | CRC | stem cell differentiation | 39/2078 | 206/18723 | 5.89e-04 | 7.89e-03 | 39 |
| GO:00488635 | Endometrium | AEH | stem cell differentiation | 40/2100 | 206/18723 | 3.67e-04 | 3.99e-03 | 40 |
| GO:004886314 | Endometrium | EEC | stem cell differentiation | 43/2168 | 206/18723 | 8.48e-05 | 1.21e-03 | 43 |
| GO:00488638 | Esophagus | ESCC | stem cell differentiation | 122/8552 | 206/18723 | 5.95e-05 | 4.59e-04 | 122 |
| GO:00488632 | Liver | NAFLD | stem cell differentiation | 33/1882 | 206/18723 | 4.81e-03 | 3.81e-02 | 33 |
| GO:004886311 | Liver | Cirrhotic | stem cell differentiation | 66/4634 | 206/18723 | 1.06e-02 | 4.68e-02 | 66 |
| GO:00488633 | Lung | IAC | stem cell differentiation | 38/2061 | 206/18723 | 9.79e-04 | 1.18e-02 | 38 |
| GO:004886312 | Lung | AIS | stem cell differentiation | 39/1849 | 206/18723 | 5.25e-05 | 1.51e-03 | 39 |
| GO:00488637 | Oral cavity | OSCC | stem cell differentiation | 96/7305 | 206/18723 | 1.55e-02 | 4.99e-02 | 96 |
| GO:004886316 | Oral cavity | NEOLP | stem cell differentiation | 38/2005 | 206/18723 | 5.82e-04 | 5.05e-03 | 38 |
| GO:00488636 | Prostate | BPH | stem cell differentiation | 55/3107 | 206/18723 | 1.56e-04 | 1.36e-03 | 55 |
| GO:004886315 | Prostate | Tumor | stem cell differentiation | 55/3246 | 206/18723 | 4.81e-04 | 3.57e-03 | 55 |
| GO:004886318 | Thyroid | PTC | stem cell differentiation | 85/5968 | 206/18723 | 2.71e-03 | 1.36e-02 | 85 |
| GO:004886321 | Thyroid | ATC | stem cell differentiation | 97/6293 | 206/18723 | 3.88e-05 | 3.15e-04 | 97 |
| Pathway ID | Tissue | Disease Stage | Description | Gene Ratio | Bg Ratio | pvalue | p.adjust | qvalue | Count |
| hsa03015 | Colorectum | AD | mRNA surveillance pathway | 35/2092 | 97/8465 | 7.95e-03 | 3.13e-02 | 2.00e-02 | 35 |
| hsa030151 | Colorectum | AD | mRNA surveillance pathway | 35/2092 | 97/8465 | 7.95e-03 | 3.13e-02 | 2.00e-02 | 35 |
| hsa0301524 | Esophagus | ESCC | mRNA surveillance pathway | 72/4205 | 97/8465 | 6.12e-07 | 4.10e-06 | 2.10e-06 | 72 |
| hsa0301534 | Esophagus | ESCC | mRNA surveillance pathway | 72/4205 | 97/8465 | 6.12e-07 | 4.10e-06 | 2.10e-06 | 72 |
| hsa030154 | Liver | Cirrhotic | mRNA surveillance pathway | 46/2530 | 97/8465 | 1.92e-04 | 1.30e-03 | 8.03e-04 | 46 |
| hsa0301511 | Liver | Cirrhotic | mRNA surveillance pathway | 46/2530 | 97/8465 | 1.92e-04 | 1.30e-03 | 8.03e-04 | 46 |
| hsa0301521 | Liver | HCC | mRNA surveillance pathway | 66/4020 | 97/8465 | 3.16e-05 | 1.88e-04 | 1.04e-04 | 66 |
| hsa0301531 | Liver | HCC | mRNA surveillance pathway | 66/4020 | 97/8465 | 3.16e-05 | 1.88e-04 | 1.04e-04 | 66 |
| hsa030158 | Oral cavity | OSCC | mRNA surveillance pathway | 75/3704 | 97/8465 | 1.30e-11 | 2.01e-10 | 1.02e-10 | 75 |
| hsa0301513 | Oral cavity | OSCC | mRNA surveillance pathway | 75/3704 | 97/8465 | 1.30e-11 | 2.01e-10 | 1.02e-10 | 75 |
| hsa0301523 | Oral cavity | LP | mRNA surveillance pathway | 50/2418 | 97/8465 | 1.39e-06 | 1.50e-05 | 9.66e-06 | 50 |
| hsa0301533 | Oral cavity | LP | mRNA surveillance pathway | 50/2418 | 97/8465 | 1.39e-06 | 1.50e-05 | 9.66e-06 | 50 |
| hsa0301541 | Oral cavity | EOLP | mRNA surveillance pathway | 30/1218 | 97/8465 | 2.26e-05 | 1.20e-04 | 7.07e-05 | 30 |
| hsa0301551 | Oral cavity | EOLP | mRNA surveillance pathway | 30/1218 | 97/8465 | 2.26e-05 | 1.20e-04 | 7.07e-05 | 30 |
| hsa030156 | Oral cavity | NEOLP | mRNA surveillance pathway | 25/1112 | 97/8465 | 5.70e-04 | 3.18e-03 | 2.00e-03 | 25 |
| hsa030157 | Oral cavity | NEOLP | mRNA surveillance pathway | 25/1112 | 97/8465 | 5.70e-04 | 3.18e-03 | 2.00e-03 | 25 |
| hsa030155 | Prostate | BPH | mRNA surveillance pathway | 32/1718 | 97/8465 | 2.20e-03 | 8.63e-03 | 5.34e-03 | 32 |
| hsa0301512 | Prostate | BPH | mRNA surveillance pathway | 32/1718 | 97/8465 | 2.20e-03 | 8.63e-03 | 5.34e-03 | 32 |
| hsa0301522 | Prostate | Tumor | mRNA surveillance pathway | 33/1791 | 97/8465 | 2.18e-03 | 8.60e-03 | 5.33e-03 | 33 |
| hsa0301532 | Prostate | Tumor | mRNA surveillance pathway | 33/1791 | 97/8465 | 2.18e-03 | 8.60e-03 | 5.33e-03 | 33 |
| Hugo Symbol | Variant Class | Variant Classification | dbSNP RS | HGVSc | HGVSp | HGVSp Short | SWISSPROT | BIOTYPE | SIFT | PolyPhen | Tumor Sample Barcode | Tissue | Histology | Sex | Age | Stage | Therapy Types | Drugs | Outcome |
| MSI2 | SNV | Missense_Mutation | | c.475N>A | p.Glu159Lys | p.E159K | Q96DH6 | protein_coding | deleterious(0.04) | benign(0.223) | TCGA-AC-A23H-01 | Breast | breast invasive carcinoma | Female | >=65 | I/II | Unknown | Unknown | PD |
| MSI2 | insertion | In_Frame_Ins | novel | c.986_987insGGAGAATGGAGATCTTTTTTGTCTTTTTTAAAAAAAAAAACA | p.Ter329delinsTrpGluAsnGlyAspLeuPheCysLeuPheTerLysLysLysGln | p.*329delinsWENGDLFCLF*KKKQ | Q96DH6 | protein_coding | | | TCGA-BH-A0B1-01 | Breast | breast invasive carcinoma | Female | >=65 | I/II | Chemotherapy | adriamycin | SD |
| MSI2 | SNV | Missense_Mutation | rs769598215 | c.625N>A | p.Ala209Thr | p.A209T | Q96DH6 | protein_coding | tolerated(0.12) | benign(0.109) | TCGA-2W-A8YY-01 | Cervix | cervical & endocervical cancer | Female | <65 | I/II | Chemotherapy | cisplatin | CR |
| MSI2 | SNV | Missense_Mutation | | c.549N>C | p.Lys183Asn | p.K183N | Q96DH6 | protein_coding | deleterious(0) | probably_damaging(0.987) | TCGA-C5-A1BQ-01 | Cervix | cervical & endocervical cancer | Female | >=65 | III/IV | Chemotherapy | cisplatin | CR |
| MSI2 | SNV | Missense_Mutation | rs772529843 | c.767C>T | p.Ala256Val | p.A256V | Q96DH6 | protein_coding | tolerated(0.06) | benign(0.436) | TCGA-AA-A010-01 | Colorectum | colon adenocarcinoma | Female | <65 | I/II | Chemotherapy | folinic | CR |
| MSI2 | SNV | Missense_Mutation | novel | c.243N>T | p.Gln81His | p.Q81H | Q96DH6 | protein_coding | deleterious(0.04) | benign(0.178) | TCGA-A5-A0G1-01 | Endometrium | uterine corpus endometrioid carcinoma | Female | >=65 | I/II | Unknown | Unknown | SD |
| MSI2 | SNV | Missense_Mutation | novel | c.243N>T | p.Gln81His | p.Q81H | Q96DH6 | protein_coding | deleterious(0.04) | benign(0.178) | TCGA-A5-A0GG-01 | Endometrium | uterine corpus endometrioid carcinoma | Female | >=65 | I/II | Unknown | Unknown | SD |
| MSI2 | SNV | Missense_Mutation | novel | c.944N>A | p.Ala315Asp | p.A315D | Q96DH6 | protein_coding | deleterious_low_confidence(0.02) | possibly_damaging(0.448) | TCGA-A5-A1OF-01 | Endometrium | uterine corpus endometrioid carcinoma | Female | <65 | I/II | Unknown | Unknown | SD |
| MSI2 | SNV | Missense_Mutation | novel | c.902C>T | p.Ala301Val | p.A301V | Q96DH6 | protein_coding | deleterious(0) | probably_damaging(0.974) | TCGA-AX-A06F-01 | Endometrium | uterine corpus endometrioid carcinoma | Female | <65 | III/IV | Chemotherapy | carboplatin | SD |
| MSI2 | SNV | Missense_Mutation | rs766409125 | c.850N>A | p.Asp284Asn | p.D284N | Q96DH6 | protein_coding | tolerated(0.11) | possibly_damaging(0.599) | TCGA-AX-A2HA-01 | Endometrium | uterine corpus endometrioid carcinoma | Female | <65 | I/II | Unknown | Unknown | SD |


