
|
|||||
|
 | |
| |
| |
| |
| |
| |
|
Gene: MSH2 |
Gene summary for MSH2 |
| Gene information | Species | Human | Gene symbol | MSH2 | Gene ID | 4436 |
| Gene name | mutS homolog 2 | |
| Gene Alias | COCA1 | |
| Cytomap | 2p21-p16.3 | |
| Gene Type | protein-coding | GO ID | GO:0000003 | UniProtAcc | P43246 |
Top |
Malignant transformation analysis |
| Identification of the aberrant gene expression in precancerous and cancerous lesions by comparing the gene expression of stem-like cells in diseased tissues with normal stem cells |
| Entrez ID | Symbol | Replicates | Species | Organ | Tissue | Adj P-value | Log2FC | Malignancy |
| 4436 | MSH2 | LZE2T | Human | Esophagus | ESCC | 8.55e-03 | 4.87e-01 | 0.082 |
| 4436 | MSH2 | LZE4T | Human | Esophagus | ESCC | 2.91e-03 | 1.35e-01 | 0.0811 |
| 4436 | MSH2 | LZE7T | Human | Esophagus | ESCC | 6.11e-08 | 5.79e-01 | 0.0667 |
| 4436 | MSH2 | LZE24T | Human | Esophagus | ESCC | 1.02e-09 | 1.99e-01 | 0.0596 |
| 4436 | MSH2 | LZE6T | Human | Esophagus | ESCC | 7.15e-03 | 1.77e-01 | 0.0845 |
| 4436 | MSH2 | P1T-E | Human | Esophagus | ESCC | 1.42e-02 | 2.14e-01 | 0.0875 |
| 4436 | MSH2 | P2T-E | Human | Esophagus | ESCC | 2.77e-41 | 7.71e-01 | 0.1177 |
| 4436 | MSH2 | P4T-E | Human | Esophagus | ESCC | 2.47e-19 | 4.32e-01 | 0.1323 |
| 4436 | MSH2 | P5T-E | Human | Esophagus | ESCC | 7.84e-09 | 2.13e-01 | 0.1327 |
| 4436 | MSH2 | P8T-E | Human | Esophagus | ESCC | 9.46e-10 | 1.99e-01 | 0.0889 |
| 4436 | MSH2 | P9T-E | Human | Esophagus | ESCC | 1.74e-04 | 1.35e-01 | 0.1131 |
| 4436 | MSH2 | P10T-E | Human | Esophagus | ESCC | 3.16e-20 | 4.30e-01 | 0.116 |
| 4436 | MSH2 | P11T-E | Human | Esophagus | ESCC | 2.09e-04 | 2.39e-01 | 0.1426 |
| 4436 | MSH2 | P12T-E | Human | Esophagus | ESCC | 1.20e-17 | 3.69e-01 | 0.1122 |
| 4436 | MSH2 | P15T-E | Human | Esophagus | ESCC | 9.61e-14 | 3.49e-01 | 0.1149 |
| 4436 | MSH2 | P16T-E | Human | Esophagus | ESCC | 1.04e-24 | 5.07e-01 | 0.1153 |
| 4436 | MSH2 | P17T-E | Human | Esophagus | ESCC | 2.49e-02 | 1.14e-01 | 0.1278 |
| 4436 | MSH2 | P19T-E | Human | Esophagus | ESCC | 3.82e-02 | 3.48e-01 | 0.1662 |
| 4436 | MSH2 | P20T-E | Human | Esophagus | ESCC | 4.08e-11 | 1.87e-01 | 0.1124 |
| 4436 | MSH2 | P21T-E | Human | Esophagus | ESCC | 2.60e-14 | 3.33e-01 | 0.1617 |
| Page: 1 2 3 4 |
| Tissue | Expression Dynamics | Abbreviation |
| Esophagus | 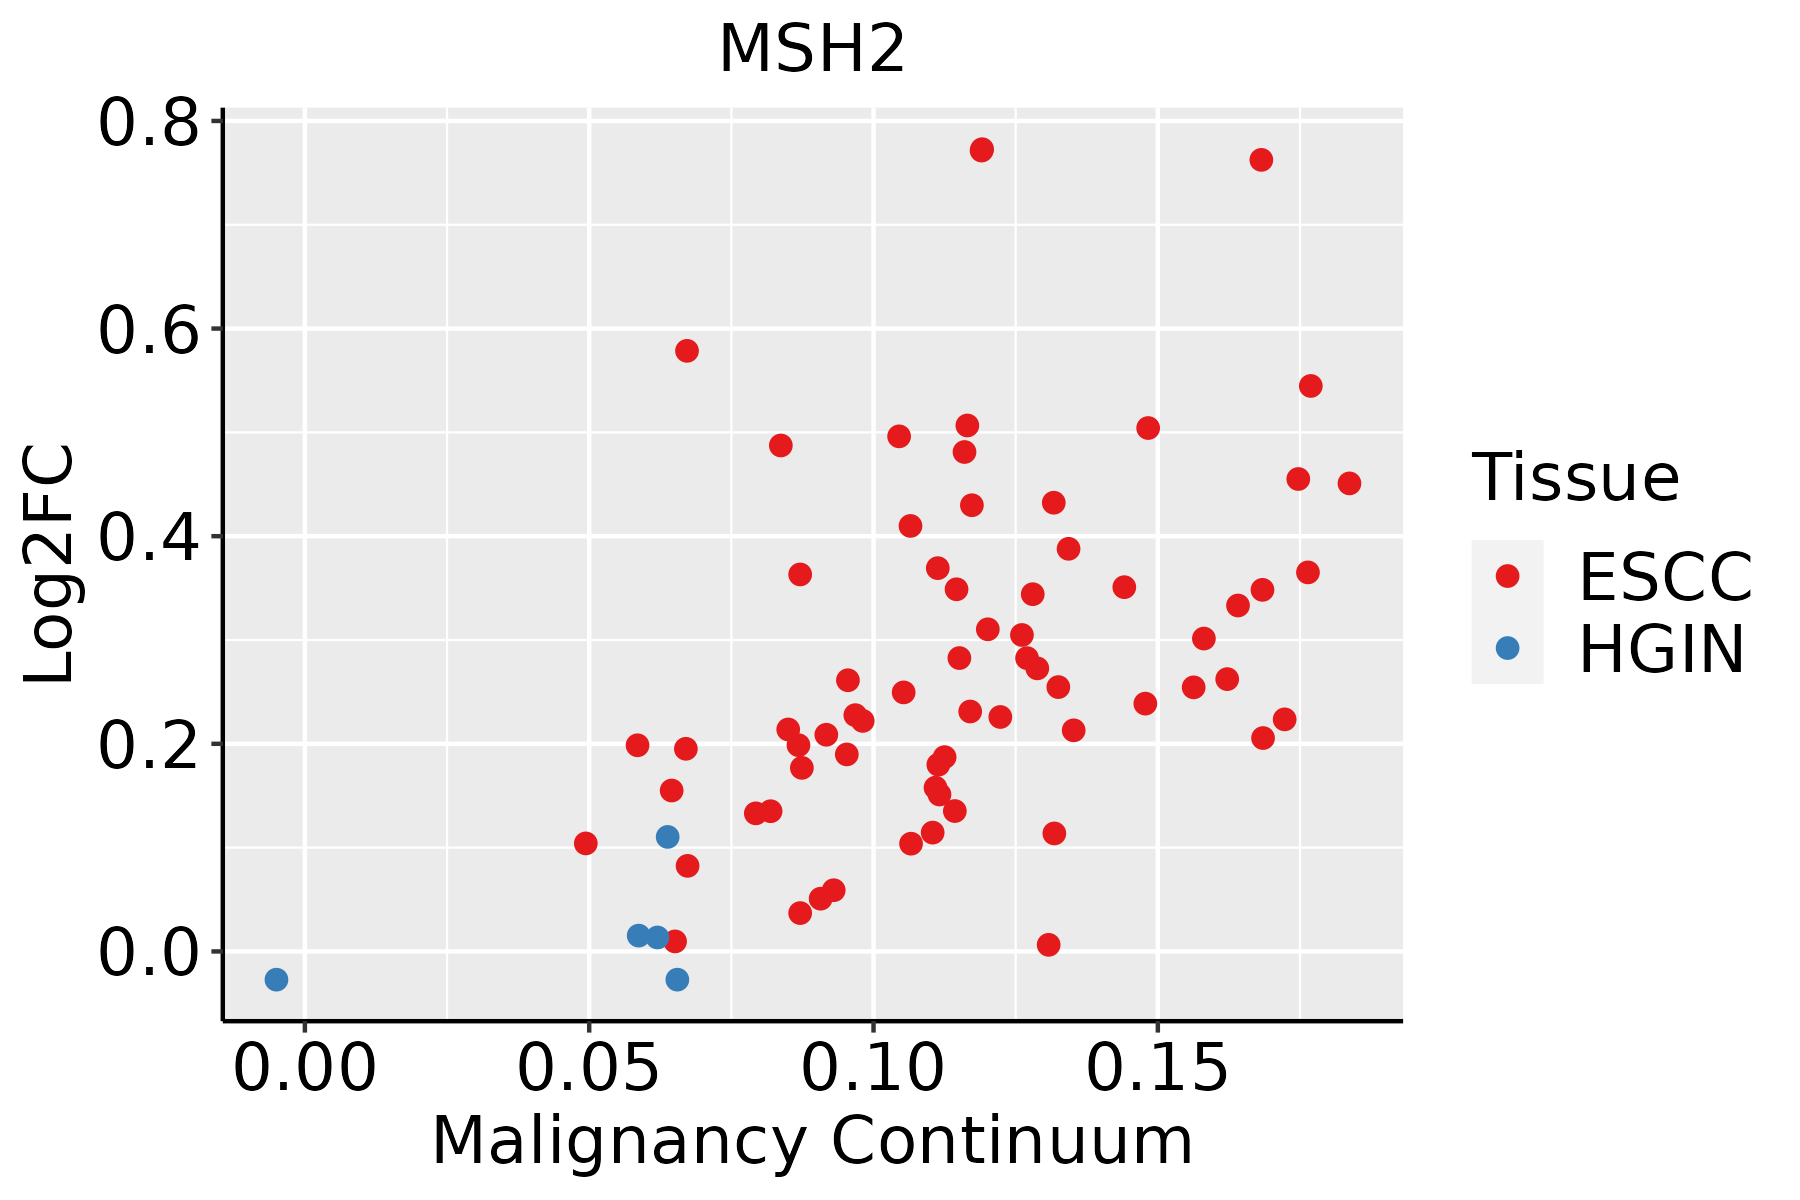 | ESCC: Esophageal squamous cell carcinoma |
| HGIN: High-grade intraepithelial neoplasias | ||
| LGIN: Low-grade intraepithelial neoplasias | ||
| Liver | 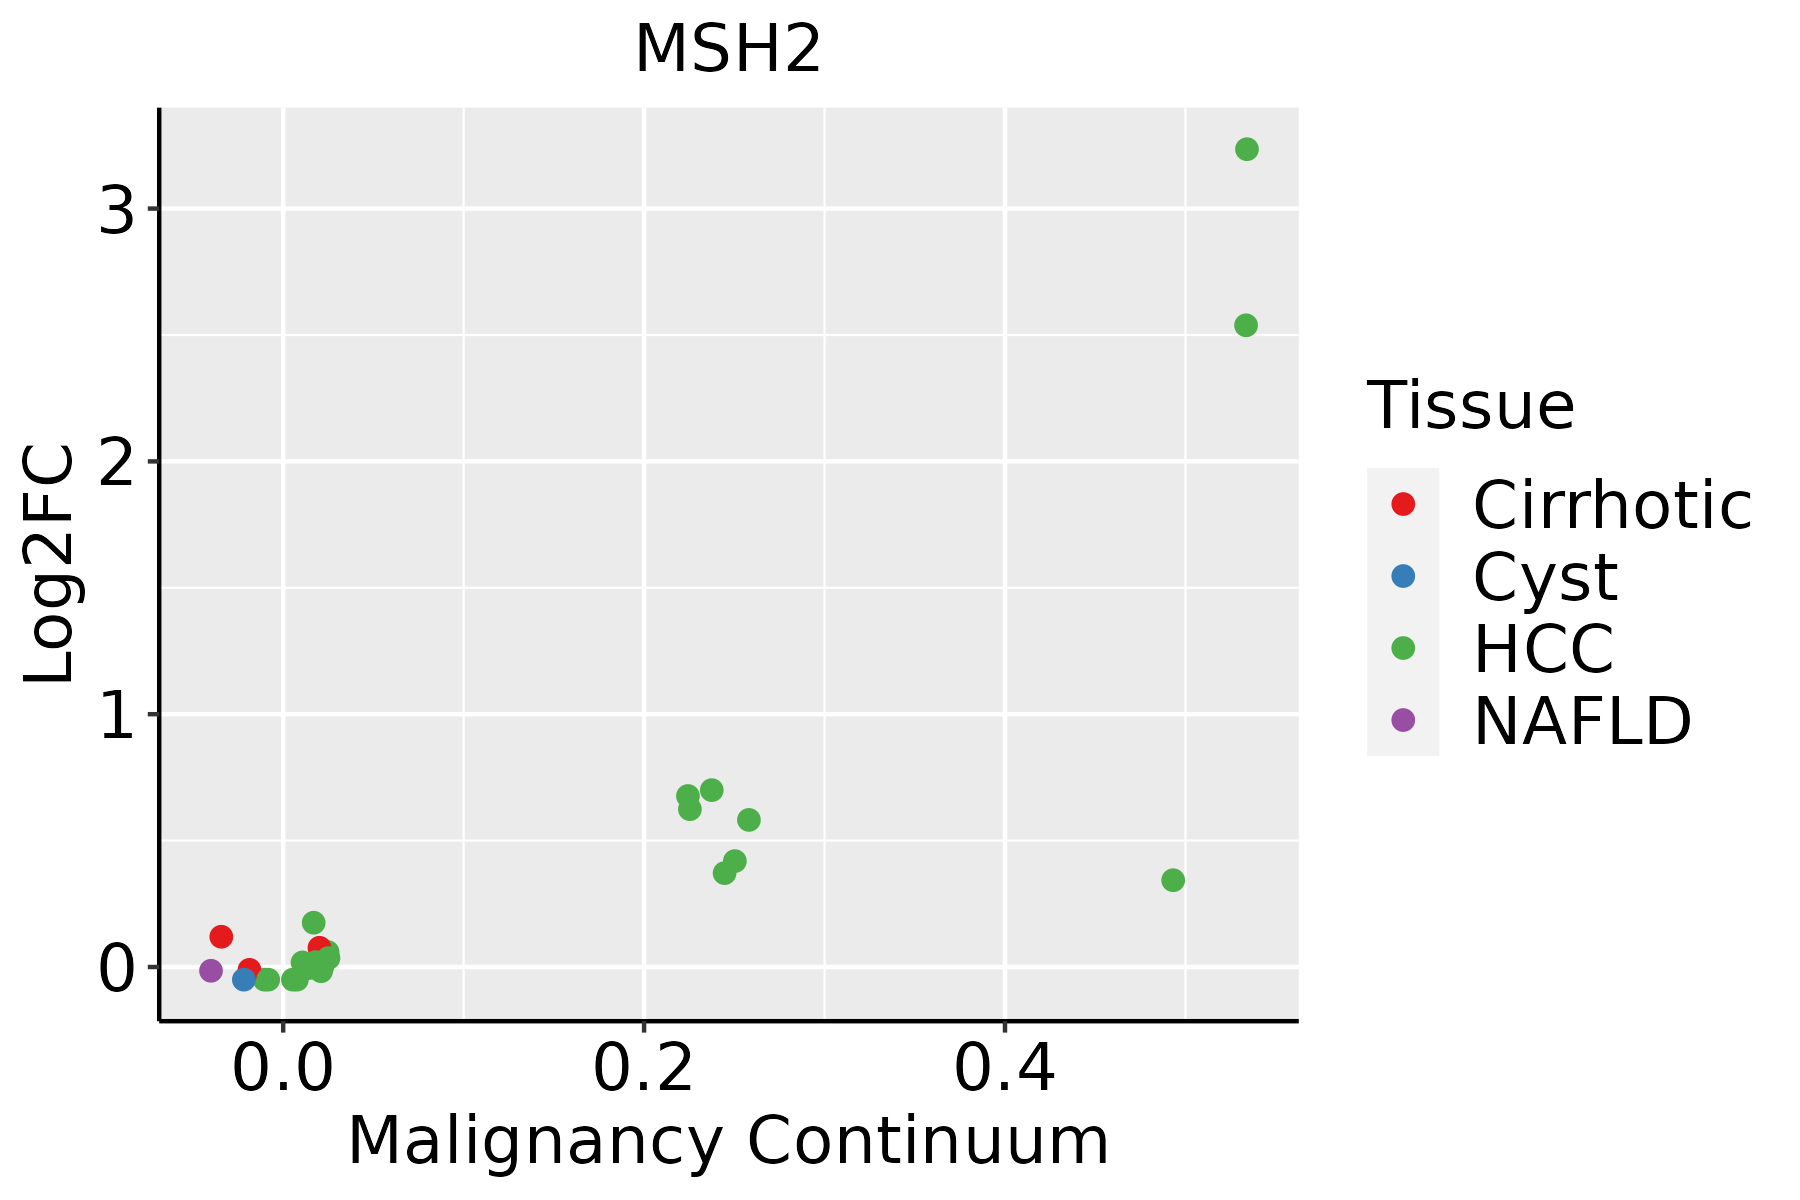 | HCC: Hepatocellular carcinoma |
| NAFLD: Non-alcoholic fatty liver disease | ||
| Oral Cavity |  | EOLP: Erosive Oral lichen planus |
| LP: leukoplakia | ||
| NEOLP: Non-erosive oral lichen planus | ||
| OSCC: Oral squamous cell carcinoma |
| ∗log2FC in expression of this searched gene in stem-like cells from each diseased tissue sample relative to stem-like cells in normal samples in each tissue plotted against the malignancy continuum. Samples are colored based on if they are from different disease stage. |
Top |
Malignant transformation related pathway analysis |
| Find out the enriched GO biological processes and KEGG pathways involved in transition from healthy to precancer to cancer |
| Tissue | Disease Stage | Enriched GO biological Processes |
| Colorectum | AD |  |
| Colorectum | SER |  |
| Colorectum | MSS |  |
| Colorectum | MSI-H |  |
| Colorectum | FAP |  |
| ∗Top 15 enriched GO BP terms are showed in the bar plot of each disease state in each tissue. Each row represents a significant GO biological process which is colored according to the -log10(p.adjust). |
| Page: 1 2 3 4 5 6 7 8 9 |
| GO ID | Tissue | Disease Stage | Description | Gene Ratio | Bg Ratio | pvalue | p.adjust | Count |
| GO:0097193111 | Esophagus | ESCC | intrinsic apoptotic signaling pathway | 222/8552 | 288/18723 | 5.87e-28 | 2.02e-25 | 222 |
| GO:0006091110 | Esophagus | ESCC | generation of precursor metabolites and energy | 331/8552 | 490/18723 | 3.86e-23 | 8.45e-21 | 331 |
| GO:0045333110 | Esophagus | ESCC | cellular respiration | 173/8552 | 230/18723 | 4.53e-20 | 5.99e-18 | 173 |
| GO:0009060110 | Esophagus | ESCC | aerobic respiration | 145/8552 | 189/18723 | 2.16e-18 | 2.21e-16 | 145 |
| GO:0015980110 | Esophagus | ESCC | energy derivation by oxidation of organic compounds | 220/8552 | 318/18723 | 1.20e-17 | 1.09e-15 | 220 |
| GO:000734615 | Esophagus | ESCC | regulation of mitotic cell cycle | 293/8552 | 457/18723 | 8.00e-16 | 5.64e-14 | 293 |
| GO:000170119 | Esophagus | ESCC | in utero embryonic development | 243/8552 | 367/18723 | 1.00e-15 | 6.86e-14 | 243 |
| GO:000941113 | Esophagus | ESCC | response to UV | 115/8552 | 149/18723 | 3.29e-15 | 1.93e-13 | 115 |
| GO:0046034111 | Esophagus | ESCC | ATP metabolic process | 189/8552 | 277/18723 | 1.99e-14 | 1.04e-12 | 189 |
| GO:0072331111 | Esophagus | ESCC | signal transduction by p53 class mediator | 121/8552 | 163/18723 | 9.61e-14 | 4.69e-12 | 121 |
| GO:005105215 | Esophagus | ESCC | regulation of DNA metabolic process | 232/8552 | 359/18723 | 2.40e-13 | 1.13e-11 | 232 |
| GO:0006119111 | Esophagus | ESCC | oxidative phosphorylation | 106/8552 | 141/18723 | 8.19e-13 | 3.63e-11 | 106 |
| GO:001021217 | Esophagus | ESCC | response to ionizing radiation | 110/8552 | 148/18723 | 1.11e-12 | 4.78e-11 | 110 |
| GO:005105417 | Esophagus | ESCC | positive regulation of DNA metabolic process | 139/8552 | 201/18723 | 1.20e-11 | 4.33e-10 | 139 |
| GO:0008630110 | Esophagus | ESCC | intrinsic apoptotic signaling pathway in response to DNA damage | 78/8552 | 99/18723 | 1.43e-11 | 5.08e-10 | 78 |
| GO:190198713 | Esophagus | ESCC | regulation of cell cycle phase transition | 242/8552 | 390/18723 | 3.86e-11 | 1.26e-09 | 242 |
| GO:000931419 | Esophagus | ESCC | response to radiation | 277/8552 | 456/18723 | 4.42e-11 | 1.43e-09 | 277 |
| GO:00457865 | Esophagus | ESCC | negative regulation of cell cycle | 236/8552 | 385/18723 | 3.62e-10 | 9.93e-09 | 236 |
| GO:00000754 | Esophagus | ESCC | cell cycle checkpoint | 117/8552 | 169/18723 | 4.47e-10 | 1.17e-08 | 117 |
| GO:004277014 | Esophagus | ESCC | signal transduction in response to DNA damage | 117/8552 | 172/18723 | 2.38e-09 | 5.32e-08 | 117 |
| Page: 1 2 3 4 5 6 7 8 9 |
| Pathway ID | Tissue | Disease Stage | Description | Gene Ratio | Bg Ratio | pvalue | p.adjust | qvalue | Count |
| hsa0521020 | Esophagus | ESCC | Colorectal cancer | 69/4205 | 86/8465 | 4.06e-09 | 4.13e-08 | 2.11e-08 | 69 |
| hsa015247 | Esophagus | ESCC | Platinum drug resistance | 56/4205 | 73/8465 | 1.85e-06 | 1.13e-05 | 5.78e-06 | 56 |
| hsa034304 | Esophagus | ESCC | Mismatch repair | 21/4205 | 23/8465 | 2.85e-05 | 1.35e-04 | 6.90e-05 | 21 |
| hsa05210110 | Esophagus | ESCC | Colorectal cancer | 69/4205 | 86/8465 | 4.06e-09 | 4.13e-08 | 2.11e-08 | 69 |
| hsa0152414 | Esophagus | ESCC | Platinum drug resistance | 56/4205 | 73/8465 | 1.85e-06 | 1.13e-05 | 5.78e-06 | 56 |
| hsa0343011 | Esophagus | ESCC | Mismatch repair | 21/4205 | 23/8465 | 2.85e-05 | 1.35e-04 | 6.90e-05 | 21 |
| hsa052107 | Liver | Cirrhotic | Colorectal cancer | 39/2530 | 86/8465 | 1.67e-03 | 8.01e-03 | 4.94e-03 | 39 |
| hsa0521012 | Liver | Cirrhotic | Colorectal cancer | 39/2530 | 86/8465 | 1.67e-03 | 8.01e-03 | 4.94e-03 | 39 |
| hsa0521022 | Liver | HCC | Colorectal cancer | 65/4020 | 86/8465 | 8.85e-08 | 1.23e-06 | 6.87e-07 | 65 |
| hsa015242 | Liver | HCC | Platinum drug resistance | 52/4020 | 73/8465 | 3.14e-05 | 1.88e-04 | 1.04e-04 | 52 |
| hsa0521032 | Liver | HCC | Colorectal cancer | 65/4020 | 86/8465 | 8.85e-08 | 1.23e-06 | 6.87e-07 | 65 |
| hsa015243 | Liver | HCC | Platinum drug resistance | 52/4020 | 73/8465 | 3.14e-05 | 1.88e-04 | 1.04e-04 | 52 |
| hsa0521018 | Oral cavity | OSCC | Colorectal cancer | 66/3704 | 86/8465 | 3.99e-10 | 4.95e-09 | 2.52e-09 | 66 |
| hsa015246 | Oral cavity | OSCC | Platinum drug resistance | 51/3704 | 73/8465 | 5.41e-06 | 2.75e-05 | 1.40e-05 | 51 |
| hsa03430 | Oral cavity | OSCC | Mismatch repair | 19/3704 | 23/8465 | 1.55e-04 | 5.34e-04 | 2.72e-04 | 19 |
| hsa0521019 | Oral cavity | OSCC | Colorectal cancer | 66/3704 | 86/8465 | 3.99e-10 | 4.95e-09 | 2.52e-09 | 66 |
| hsa0152413 | Oral cavity | OSCC | Platinum drug resistance | 51/3704 | 73/8465 | 5.41e-06 | 2.75e-05 | 1.40e-05 | 51 |
| hsa034301 | Oral cavity | OSCC | Mismatch repair | 19/3704 | 23/8465 | 1.55e-04 | 5.34e-04 | 2.72e-04 | 19 |
| Page: 1 |
Top |
Cell-cell communication analysis |
| Identification of potential cell-cell interactions between two cell types and their ligand-receptor pairs for different disease states |
| Ligand | Receptor | LRpair | Pathway | Tissue | Disease Stage |
| Page: 1 |
Top |
Single-cell gene regulatory network inference analysis |
| Find out the significant the regulons (TFs) and the target genes of each regulon across cell types for different disease states |
| TF | Cell Type | Tissue | Disease Stage | Target Gene | RSS | Regulon Activity |
| ∗The dot plots of a searched regulon are shown for all cell subpopulations in each disease state of each tissue based on the regulon specific score inferred using pySCENIC and by calculating the average expression. |
| Page: 1 |
Top |
Somatic mutation of malignant transformation related genes |
| Annotation of somatic variants for genes involved in malignant transformation |
| Hugo Symbol | Variant Class | Variant Classification | dbSNP RS | HGVSc | HGVSp | HGVSp Short | SWISSPROT | BIOTYPE | SIFT | PolyPhen | Tumor Sample Barcode | Tissue | Histology | Sex | Age | Stage | Therapy Types | Drugs | Outcome |
| MSH2 | SNV | Missense_Mutation | novel | c.1315N>A | p.Pro439Thr | p.P439T | P43246 | protein_coding | deleterious(0.01) | probably_damaging(0.994) | TCGA-A7-A3RF-01 | Breast | breast invasive carcinoma | Female | >=65 | I/II | Hormone Therapy | anastrozole | PD |
| MSH2 | SNV | Missense_Mutation | c.1351N>G | p.Gln451Glu | p.Q451E | P43246 | protein_coding | tolerated(0.17) | benign(0.14) | TCGA-A8-A09Q-01 | Breast | breast invasive carcinoma | Female | >=65 | III/IV | Hormone Therapy | anastrozole | SD | |
| MSH2 | SNV | Missense_Mutation | c.2573N>C | p.Gly858Ala | p.G858A | P43246 | protein_coding | tolerated(0.19) | benign(0.007) | TCGA-AC-A23H-01 | Breast | breast invasive carcinoma | Female | >=65 | I/II | Unknown | Unknown | PD | |
| MSH2 | SNV | Missense_Mutation | c.1976N>C | p.Lys659Thr | p.K659T | P43246 | protein_coding | deleterious(0) | possibly_damaging(0.833) | TCGA-AR-A24H-01 | Breast | breast invasive carcinoma | Female | >=65 | I/II | Hormone Therapy | tamoxiphen | SD | |
| MSH2 | SNV | Missense_Mutation | c.1228N>A | p.Gly410Ser | p.G410S | P43246 | protein_coding | tolerated(0.17) | benign(0.006) | TCGA-BH-A0BZ-01 | Breast | breast invasive carcinoma | Female | <65 | III/IV | Chemotherapy | doxorubicin | CR | |
| MSH2 | SNV | Missense_Mutation | rs587782355 | c.1530N>C | p.Gln510His | p.Q510H | P43246 | protein_coding | deleterious(0.03) | benign(0.014) | TCGA-D8-A1J9-01 | Breast | breast invasive carcinoma | Female | <65 | I/II | Unknown | Unknown | SD |
| MSH2 | SNV | Missense_Mutation | rs772662439 | c.2197N>A | p.Ala733Thr | p.A733T | P43246 | protein_coding | deleterious(0) | probably_damaging(0.954) | TCGA-DG-A2KL-01 | Cervix | cervical & endocervical cancer | Female | <65 | I/II | Chemotherapy | cisplatin | SD |
| MSH2 | SNV | Missense_Mutation | c.643C>G | p.Gln215Glu | p.Q215E | P43246 | protein_coding | tolerated(0.34) | benign(0.04) | TCGA-DS-A1OB-01 | Cervix | cervical & endocervical cancer | Female | <65 | I/II | Chemotherapy | carboplatin | PD | |
| MSH2 | SNV | Missense_Mutation | rs372189599 | c.174C>G | p.Phe58Leu | p.F58L | P43246 | protein_coding | deleterious(0) | probably_damaging(0.992) | TCGA-EK-A2R7-01 | Cervix | cervical & endocervical cancer | Female | <65 | I/II | Unknown | Unknown | SD |
| MSH2 | insertion | Frame_Shift_Ins | novel | c.2425_2426insCACAT | p.Glu809AlafsTer5 | p.E809Afs*5 | P43246 | protein_coding | TCGA-DS-A1OC-01 | Cervix | cervical & endocervical cancer | Female | <65 | I/II | Chemotherapy | gemcitabine | SD |
| Page: 1 2 3 4 5 6 7 8 9 10 |
Top |
Related drugs of malignant transformation related genes |
| Identification of chemicals and drugs interact with genes involved in malignant transfromation |
| (DGIdb 4.0) |
| Entrez ID | Symbol | Category | Interaction Types | Drug Claim Name | Drug Name | PMIDs |
| 4436 | MSH2 | CLINICALLY ACTIONABLE, DNA REPAIR | ANTI-PD-1 MONOCLONAL ANTIBODY MEDI0680 | 26674132 | ||
| 4436 | MSH2 | CLINICALLY ACTIONABLE, DNA REPAIR | DURVALUMAB | DURVALUMAB | 26674132 |
| Page: 1 |

Copyright 2023-Present -The University of Texas Health Science Center at Houston |