
|
|||||
|
 | |
| |
| |
| |
| |
| |
|
Gene: MSC |
Gene summary for MSC |
| Gene information | Species | Human | Gene symbol | MSC | Gene ID | 9242 |
| Gene name | musculin | |
| Gene Alias | ABF-1 | |
| Cytomap | 8q13.3 | |
| Gene Type | protein-coding | GO ID | GO:0000122 | UniProtAcc | O60682 |
Top |
Malignant transformation analysis |
| Identification of the aberrant gene expression in precancerous and cancerous lesions by comparing the gene expression of stem-like cells in diseased tissues with normal stem cells |
| Entrez ID | Symbol | Replicates | Species | Organ | Tissue | Adj P-value | Log2FC | Malignancy |
| 9242 | MSC | LZE4T | Human | Esophagus | ESCC | 3.92e-12 | 4.03e-01 | 0.0811 |
| 9242 | MSC | P2T-E | Human | Esophagus | ESCC | 1.18e-02 | 1.79e-01 | 0.1177 |
| 9242 | MSC | P5T-E | Human | Esophagus | ESCC | 2.38e-05 | 1.57e-01 | 0.1327 |
| 9242 | MSC | P9T-E | Human | Esophagus | ESCC | 1.12e-09 | 3.84e-01 | 0.1131 |
| 9242 | MSC | P11T-E | Human | Esophagus | ESCC | 6.46e-06 | 3.77e-01 | 0.1426 |
| 9242 | MSC | P15T-E | Human | Esophagus | ESCC | 3.59e-04 | 1.46e-01 | 0.1149 |
| 9242 | MSC | P19T-E | Human | Esophagus | ESCC | 2.42e-03 | 8.01e-01 | 0.1662 |
| 9242 | MSC | P22T-E | Human | Esophagus | ESCC | 5.90e-03 | 1.37e-01 | 0.1236 |
| 9242 | MSC | P30T-E | Human | Esophagus | ESCC | 8.35e-21 | 1.26e+00 | 0.137 |
| 9242 | MSC | P32T-E | Human | Esophagus | ESCC | 4.95e-20 | 4.89e-01 | 0.1666 |
| 9242 | MSC | P42T-E | Human | Esophagus | ESCC | 3.65e-03 | 3.31e-01 | 0.1175 |
| 9242 | MSC | P44T-E | Human | Esophagus | ESCC | 1.39e-08 | 3.69e-01 | 0.1096 |
| 9242 | MSC | P47T-E | Human | Esophagus | ESCC | 2.05e-07 | 2.44e-01 | 0.1067 |
| 9242 | MSC | P49T-E | Human | Esophagus | ESCC | 2.26e-23 | 2.17e+00 | 0.1768 |
| 9242 | MSC | P52T-E | Human | Esophagus | ESCC | 4.14e-18 | 7.12e-01 | 0.1555 |
| 9242 | MSC | P74T-E | Human | Esophagus | ESCC | 3.93e-02 | 7.56e-02 | 0.1479 |
| 9242 | MSC | P83T-E | Human | Esophagus | ESCC | 1.16e-55 | 1.78e+00 | 0.1738 |
| 9242 | MSC | P89T-E | Human | Esophagus | ESCC | 1.08e-14 | 1.13e+00 | 0.1752 |
| 9242 | MSC | P91T-E | Human | Esophagus | ESCC | 3.06e-04 | 4.66e-01 | 0.1828 |
| 9242 | MSC | P107T-E | Human | Esophagus | ESCC | 2.73e-18 | 5.32e-01 | 0.171 |
| Page: 1 2 |
| Tissue | Expression Dynamics | Abbreviation |
| Esophagus | 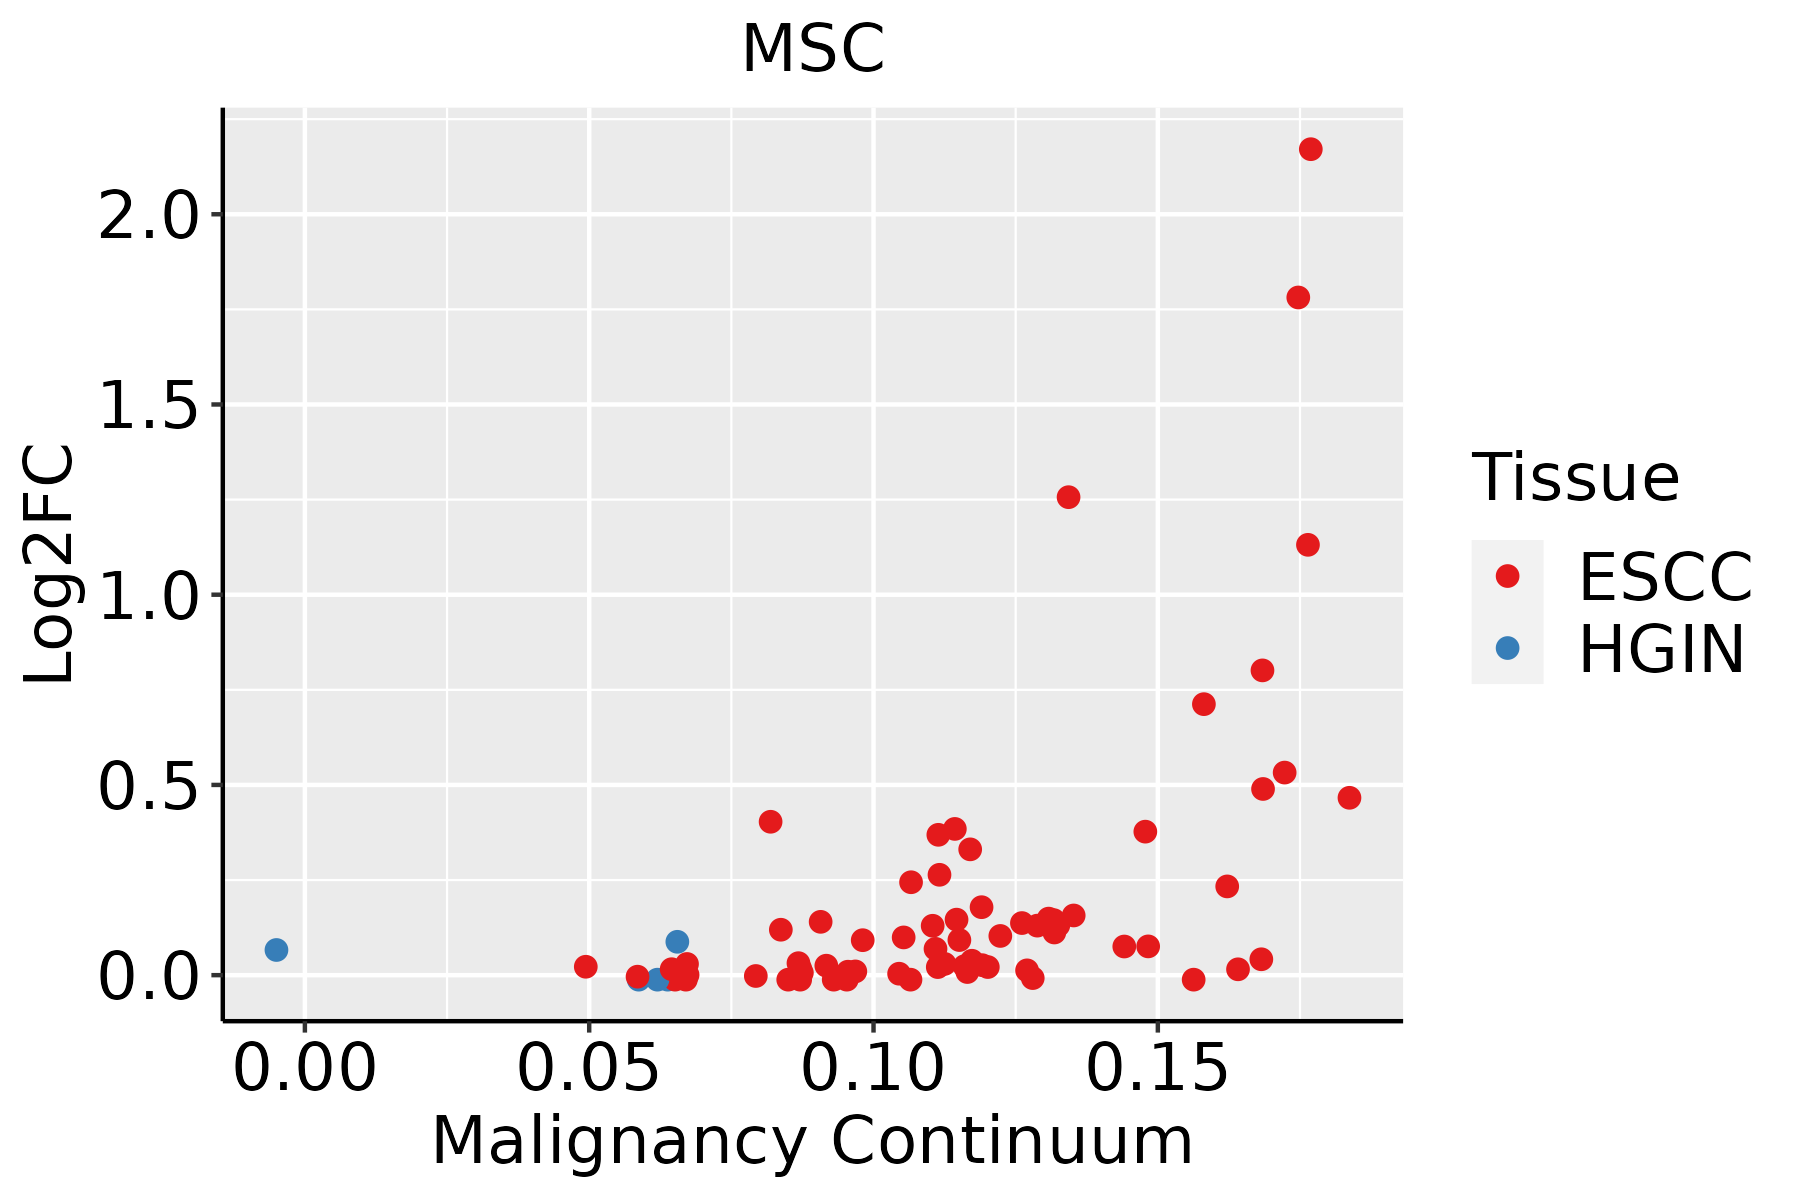 | ESCC: Esophageal squamous cell carcinoma |
| HGIN: High-grade intraepithelial neoplasias | ||
| LGIN: Low-grade intraepithelial neoplasias | ||
| Oral Cavity | 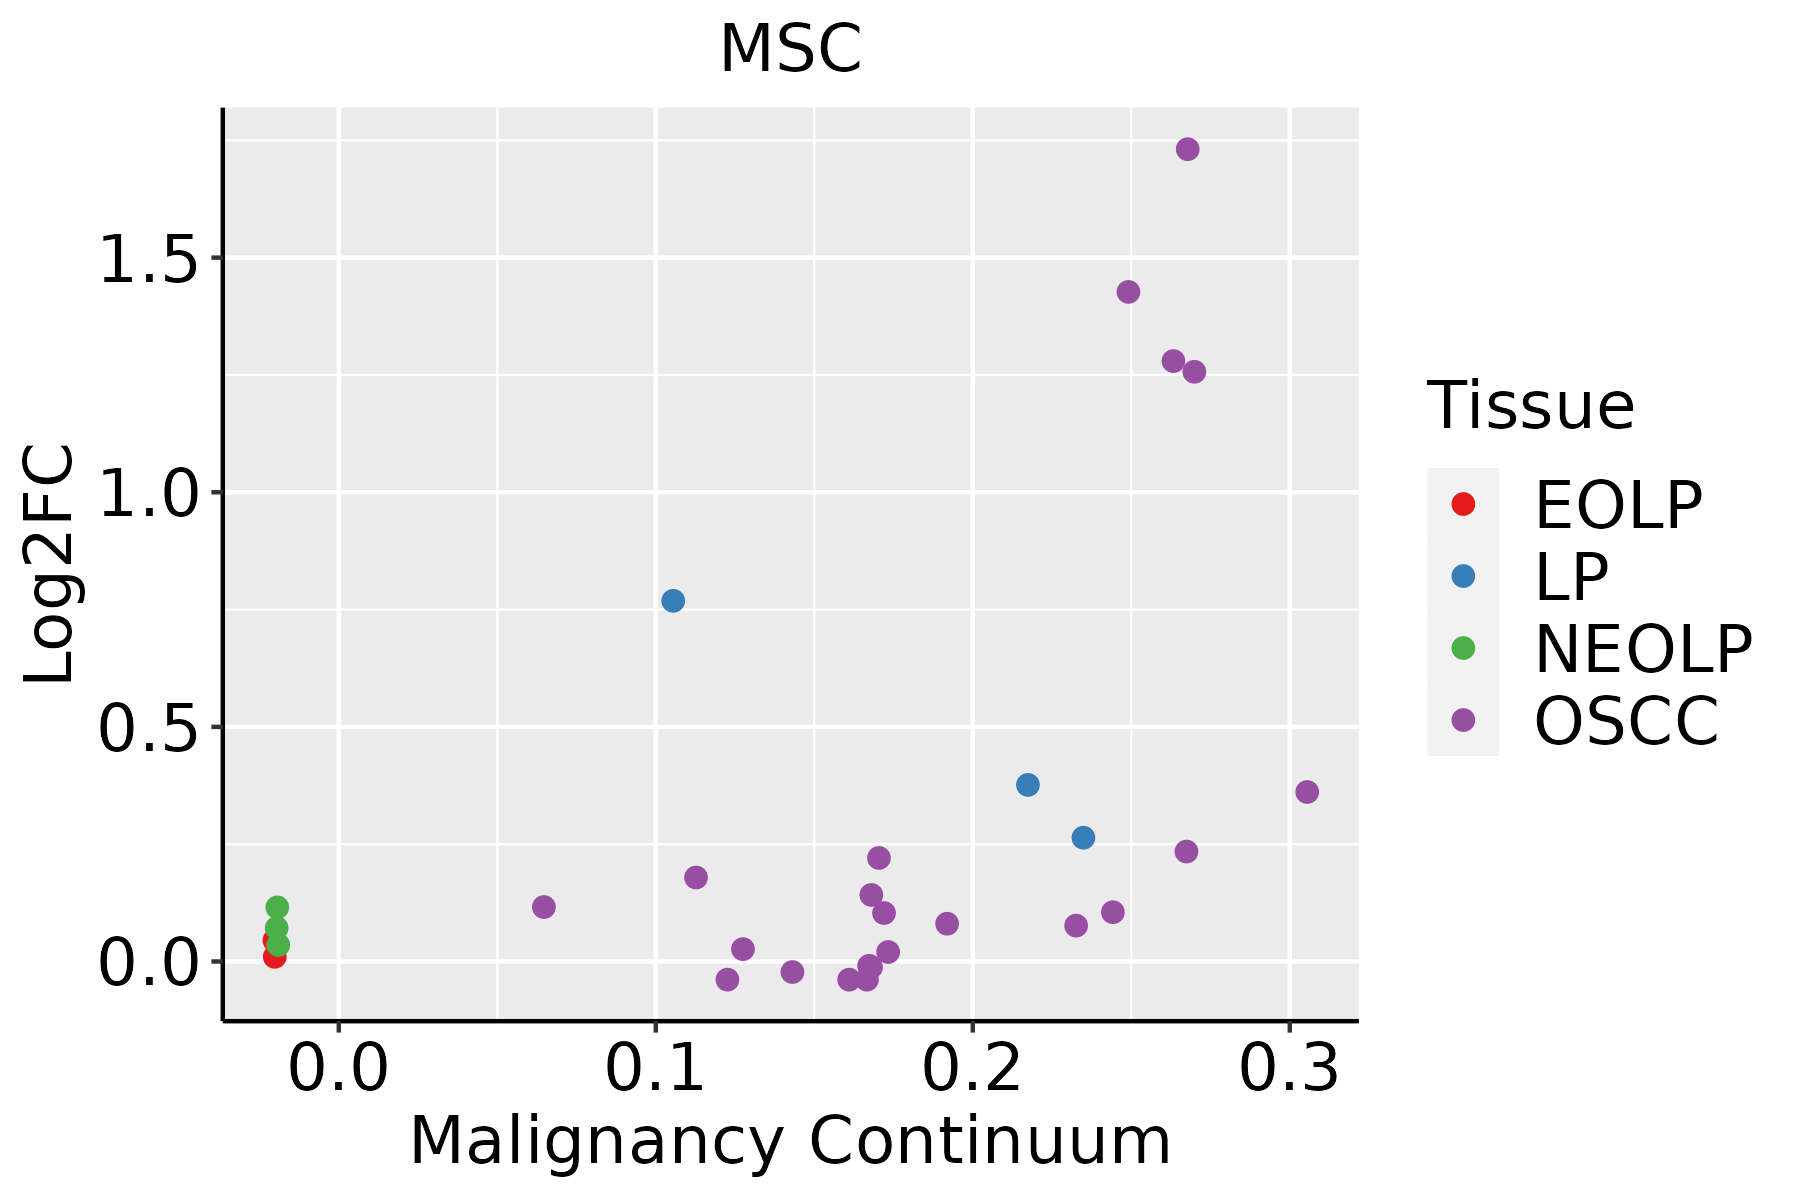 | EOLP: Erosive Oral lichen planus |
| LP: leukoplakia | ||
| NEOLP: Non-erosive oral lichen planus | ||
| OSCC: Oral squamous cell carcinoma |
| ∗log2FC in expression of this searched gene in stem-like cells from each diseased tissue sample relative to stem-like cells in normal samples in each tissue plotted against the malignancy continuum. Samples are colored based on if they are from different disease stage. |
Top |
Malignant transformation related pathway analysis |
| Find out the enriched GO biological processes and KEGG pathways involved in transition from healthy to precancer to cancer |
| Tissue | Disease Stage | Enriched GO biological Processes |
| Colorectum | AD |  |
| Colorectum | SER |  |
| Colorectum | MSS |  |
| Colorectum | MSI-H |  |
| Colorectum | FAP |  |
| ∗Top 15 enriched GO BP terms are showed in the bar plot of each disease state in each tissue. Each row represents a significant GO biological process which is colored according to the -log10(p.adjust). |
| Page: 1 2 3 4 5 6 7 8 9 |
| GO ID | Tissue | Disease Stage | Description | Gene Ratio | Bg Ratio | pvalue | p.adjust | Count |
| GO:00605417 | Esophagus | ESCC | respiratory system development | 123/8552 | 203/18723 | 1.26e-05 | 1.15e-04 | 123 |
| GO:199082316 | Esophagus | ESCC | response to leukemia inhibitory factor | 60/8552 | 95/18723 | 4.41e-04 | 2.48e-03 | 60 |
| GO:199083015 | Esophagus | ESCC | cellular response to leukemia inhibitory factor | 59/8552 | 94/18723 | 6.19e-04 | 3.32e-03 | 59 |
| GO:006053716 | Esophagus | ESCC | muscle tissue development | 211/8552 | 403/18723 | 3.84e-03 | 1.56e-02 | 211 |
| GO:0060021 | Esophagus | ESCC | roof of mouth development | 50/8552 | 85/18723 | 1.00e-02 | 3.42e-02 | 50 |
| GO:001470615 | Esophagus | ESCC | striated muscle tissue development | 197/8552 | 384/18723 | 1.46e-02 | 4.74e-02 | 197 |
| GO:19908237 | Oral cavity | OSCC | response to leukemia inhibitory factor | 58/7305 | 95/18723 | 1.10e-05 | 1.14e-04 | 58 |
| GO:19908307 | Oral cavity | OSCC | cellular response to leukemia inhibitory factor | 57/7305 | 94/18723 | 1.75e-05 | 1.71e-04 | 57 |
| GO:00605416 | Oral cavity | OSCC | respiratory system development | 100/7305 | 203/18723 | 1.83e-03 | 8.60e-03 | 100 |
| GO:00605378 | Oral cavity | OSCC | muscle tissue development | 185/7305 | 403/18723 | 2.60e-03 | 1.14e-02 | 185 |
| GO:00147067 | Oral cavity | OSCC | striated muscle tissue development | 174/7305 | 384/18723 | 6.45e-03 | 2.40e-02 | 174 |
| Page: 1 |
| Pathway ID | Tissue | Disease Stage | Description | Gene Ratio | Bg Ratio | pvalue | p.adjust | qvalue | Count |
| Page: 1 |
Top |
Cell-cell communication analysis |
| Identification of potential cell-cell interactions between two cell types and their ligand-receptor pairs for different disease states |
| Ligand | Receptor | LRpair | Pathway | Tissue | Disease Stage |
| Page: 1 |
Top |
Single-cell gene regulatory network inference analysis |
| Find out the significant the regulons (TFs) and the target genes of each regulon across cell types for different disease states |
| TF | Cell Type | Tissue | Disease Stage | Target Gene | RSS | Regulon Activity |
| MSC | ICAF | Breast | ADJ | SELENOM,TNFAIP6,CXCL8, etc. | 6.85e-01 |  |
| MSC | ICAF | Breast | Healthy | SELENOM,TNFAIP6,CXCL8, etc. | 2.53e-01 |  |
| MSC | ICAF | Breast | Precancer | SELENOM,TNFAIP6,CXCL8, etc. | 4.08e-01 |  |
| MSC | ECM | Cervix | CC | CXCL1,NNMT,CYTOR, etc. | 3.69e-02 |  |
| MSC | ECM | Cervix | HSIL_HPV | CXCL1,NNMT,CYTOR, etc. | 5.15e-02 |  |
| MSC | PRO | Esophagus | HGIN | MSC-AS1,FTL,GPX2, etc. | 3.91e-01 |  |
| MSC | SMC | Liver | HCC | FHL2,ASPN,COLEC11, etc. | 3.02e-01 |  |
| MSC | INCAF | Oral cavity | Healthy | CD44,SOD2,SLC39A14, etc. | 4.98e-01 |  |
| MSC | INCAF | Prostate | Tumor | IL32,CCL2,CCL19, etc. | 2.87e-01 |  |
| MSC | MYOFIB | Skin | AK | IL32,GBP1,POSTN, etc. | 2.52e-01 |  |
| ∗The dot plots of a searched regulon are shown for all cell subpopulations in each disease state of each tissue based on the regulon specific score inferred using pySCENIC and by calculating the average expression. |
| Page: 1 2 |
Top |
Somatic mutation of malignant transformation related genes |
| Annotation of somatic variants for genes involved in malignant transformation |
| Hugo Symbol | Variant Class | Variant Classification | dbSNP RS | HGVSc | HGVSp | HGVSp Short | SWISSPROT | BIOTYPE | SIFT | PolyPhen | Tumor Sample Barcode | Tissue | Histology | Sex | Age | Stage | Therapy Types | Drugs | Outcome |
| MSC | SNV | Missense_Mutation | c.348N>C | p.Glu116Asp | p.E116D | O60682 | protein_coding | deleterious(0) | probably_damaging(0.998) | TCGA-A8-A09K-01 | Breast | breast invasive carcinoma | Female | >=65 | I/II | Unknown | Unknown | SD | |
| MSC | SNV | Missense_Mutation | rs200007708 | c.259G>T | p.Ala87Ser | p.A87S | O60682 | protein_coding | tolerated(0.77) | benign(0.001) | TCGA-BH-A0WA-01 | Breast | breast invasive carcinoma | Female | >=65 | I/II | Unknown | Unknown | SD |
| MSC | SNV | Missense_Mutation | c.587N>T | p.Ser196Phe | p.S196F | O60682 | protein_coding | tolerated(0.07) | possibly_damaging(0.621) | TCGA-GM-A2D9-01 | Breast | breast invasive carcinoma | Female | >=65 | I/II | Hormone Therapy | arimidex | SD | |
| MSC | SNV | Missense_Mutation | novel | c.546N>G | p.Phe182Leu | p.F182L | O60682 | protein_coding | deleterious(0.01) | probably_damaging(0.985) | TCGA-VS-A9UH-01 | Cervix | cervical & endocervical cancer | Female | <65 | I/II | Chemotherapy | cisplatin | CR |
| MSC | SNV | Missense_Mutation | c.199N>A | p.Ala67Thr | p.A67T | O60682 | protein_coding | tolerated(0.58) | benign(0.003) | TCGA-A6-6780-01 | Colorectum | colon adenocarcinoma | Male | >=65 | I/II | Unknown | Unknown | SD | |
| MSC | SNV | Missense_Mutation | c.73N>A | p.Ala25Thr | p.A25T | O60682 | protein_coding | tolerated_low_confidence(0.28) | benign(0.003) | TCGA-AA-3526-01 | Colorectum | colon adenocarcinoma | Male | <65 | I/II | Unknown | Unknown | SD | |
| MSC | SNV | Missense_Mutation | c.582N>C | p.Glu194Asp | p.E194D | O60682 | protein_coding | tolerated(0.62) | benign(0) | TCGA-AA-3715-01 | Colorectum | colon adenocarcinoma | Male | >=65 | I/II | Unknown | Unknown | PD | |
| MSC | SNV | Missense_Mutation | rs759036071 | c.94N>T | p.Arg32Cys | p.R32C | O60682 | protein_coding | deleterious_low_confidence(0.02) | benign(0) | TCGA-AA-3947-01 | Colorectum | colon adenocarcinoma | Female | <65 | I/II | Unknown | Unknown | SD |
| MSC | SNV | Missense_Mutation | rs776388351 | c.563N>T | p.Pro188Leu | p.P188L | O60682 | protein_coding | deleterious(0) | probably_damaging(0.95) | TCGA-AA-A01R-01 | Colorectum | colon adenocarcinoma | Male | <65 | III/IV | Chemotherapy | 5-fluorouracil | PD |
| MSC | SNV | Missense_Mutation | c.350N>A | p.Arg117His | p.R117H | O60682 | protein_coding | deleterious(0) | probably_damaging(0.98) | TCGA-D5-7000-01 | Colorectum | colon adenocarcinoma | Female | >=65 | I/II | Unknown | Unknown | SD |
| Page: 1 2 3 4 5 |
Top |
Related drugs of malignant transformation related genes |
| Identification of chemicals and drugs interact with genes involved in malignant transfromation |
| (DGIdb 4.0) |
| Entrez ID | Symbol | Category | Interaction Types | Drug Claim Name | Drug Name | PMIDs |
| Page: 1 |

Copyright 2023-Present -The University of Texas Health Science Center at Houston |