
|
|||||
|
 | |
| |
| |
| |
| |
| |
|
Gene: MS4A6A |
Gene summary for MS4A6A |
| Gene information | Species | Human | Gene symbol | MS4A6A | Gene ID | 64231 |
| Gene name | membrane spanning 4-domains A6A | |
| Gene Alias | 4SPAN3 | |
| Cytomap | 11q12.2 | |
| Gene Type | protein-coding | GO ID | GO:0005575 | UniProtAcc | B4DUN6 |
Top |
Malignant transformation analysis |
| Identification of the aberrant gene expression in precancerous and cancerous lesions by comparing the gene expression of stem-like cells in diseased tissues with normal stem cells |
| Entrez ID | Symbol | Replicates | Species | Organ | Tissue | Adj P-value | Log2FC | Malignancy |
| 64231 | MS4A6A | HCC1_Meng | Human | Liver | HCC | 8.08e-08 | -2.24e-01 | 0.0246 |
| 64231 | MS4A6A | HCC2_Meng | Human | Liver | HCC | 2.16e-04 | -3.33e-01 | 0.0107 |
| 64231 | MS4A6A | cirrhotic1 | Human | Liver | Cirrhotic | 3.48e-02 | -2.83e-01 | 0.0202 |
| 64231 | MS4A6A | cirrhotic2 | Human | Liver | Cirrhotic | 4.35e-03 | -2.31e-01 | 0.0201 |
| 64231 | MS4A6A | cirrhotic3 | Human | Liver | Cirrhotic | 4.87e-05 | -2.51e-01 | 0.0215 |
| 64231 | MS4A6A | HCC1 | Human | Liver | HCC | 1.41e-05 | -1.26e-01 | 0.5336 |
| 64231 | MS4A6A | Pt13.a | Human | Liver | HCC | 9.52e-14 | 3.53e-01 | 0.021 |
| 64231 | MS4A6A | Pt13.b | Human | Liver | HCC | 1.59e-04 | -1.43e-01 | 0.0251 |
| 64231 | MS4A6A | Pt13.c | Human | Liver | HCC | 2.31e-06 | 5.14e-01 | 0.0076 |
| 64231 | MS4A6A | Pt14.d | Human | Liver | HCC | 1.08e-23 | 6.49e-01 | 0.0143 |
| 64231 | MS4A6A | S016 | Human | Liver | HCC | 1.64e-02 | -3.28e-01 | 0.2243 |
| Page: 1 |
| Tissue | Expression Dynamics | Abbreviation |
| Liver | 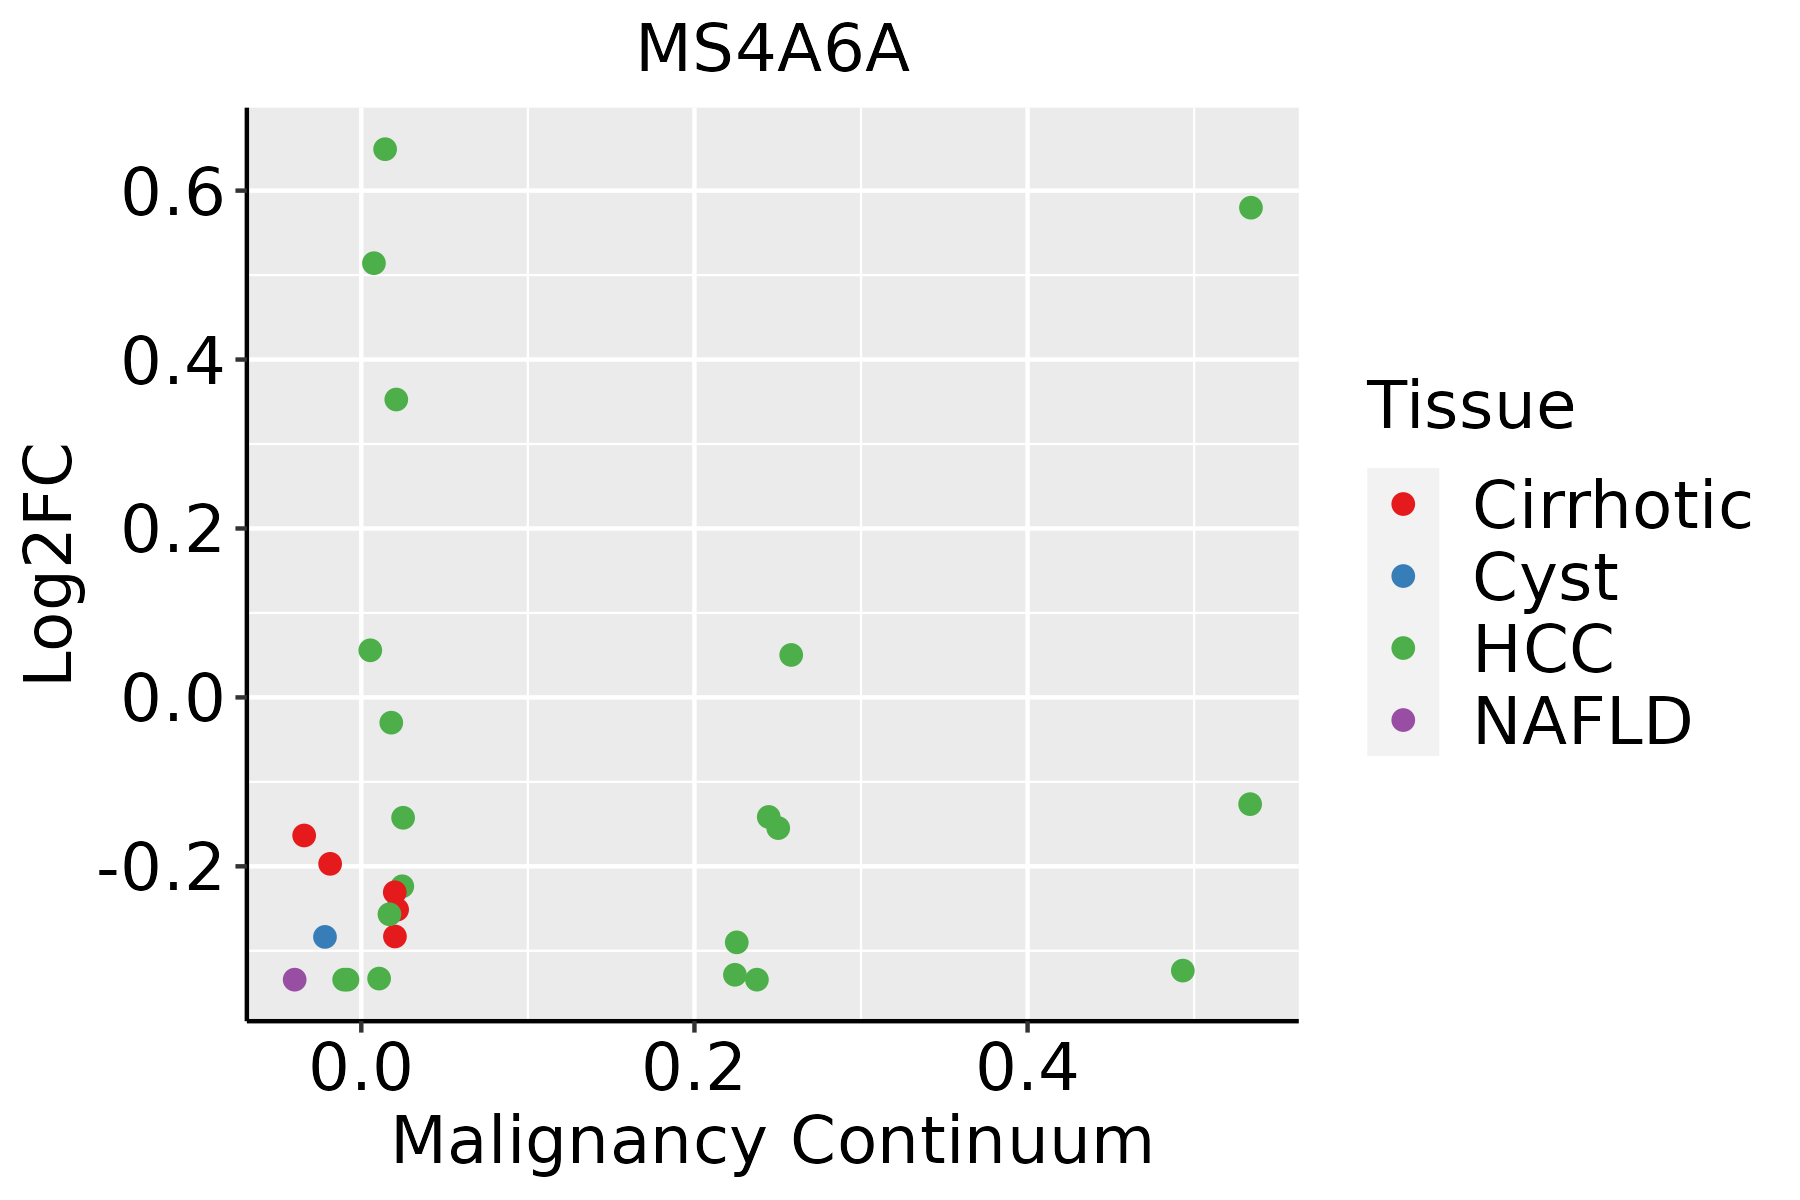 | HCC: Hepatocellular carcinoma |
| NAFLD: Non-alcoholic fatty liver disease |
| ∗log2FC in expression of this searched gene in stem-like cells from each diseased tissue sample relative to stem-like cells in normal samples in each tissue plotted against the malignancy continuum. Samples are colored based on if they are from different disease stage. |
Top |
Malignant transformation related pathway analysis |
| Find out the enriched GO biological processes and KEGG pathways involved in transition from healthy to precancer to cancer |
| Tissue | Disease Stage | Enriched GO biological Processes |
| Colorectum | AD |  |
| Colorectum | SER |  |
| Colorectum | MSS |  |
| Colorectum | MSI-H |  |
| Colorectum | FAP |  |
| ∗Top 15 enriched GO BP terms are showed in the bar plot of each disease state in each tissue. Each row represents a significant GO biological process which is colored according to the -log10(p.adjust). |
| Page: 1 2 3 4 5 6 7 8 9 |
| GO ID | Tissue | Disease Stage | Description | Gene Ratio | Bg Ratio | pvalue | p.adjust | Count |
| Page: 1 |
| Pathway ID | Tissue | Disease Stage | Description | Gene Ratio | Bg Ratio | pvalue | p.adjust | qvalue | Count |
| Page: 1 |
Top |
Cell-cell communication analysis |
| Identification of potential cell-cell interactions between two cell types and their ligand-receptor pairs for different disease states |
| Ligand | Receptor | LRpair | Pathway | Tissue | Disease Stage |
| Page: 1 |
Top |
Single-cell gene regulatory network inference analysis |
| Find out the significant the regulons (TFs) and the target genes of each regulon across cell types for different disease states |
| TF | Cell Type | Tissue | Disease Stage | Target Gene | RSS | Regulon Activity |
| ∗The dot plots of a searched regulon are shown for all cell subpopulations in each disease state of each tissue based on the regulon specific score inferred using pySCENIC and by calculating the average expression. |
| Page: 1 |
Top |
Somatic mutation of malignant transformation related genes |
| Annotation of somatic variants for genes involved in malignant transformation |
| Hugo Symbol | Variant Class | Variant Classification | dbSNP RS | HGVSc | HGVSp | HGVSp Short | SWISSPROT | BIOTYPE | SIFT | PolyPhen | Tumor Sample Barcode | Tissue | Histology | Sex | Age | Stage | Therapy Types | Drugs | Outcome |
| MS4A6A | SNV | Missense_Mutation | c.742C>G | p.Leu248Val | p.L248V | protein_coding | deleterious(0.03) | benign(0.061) | TCGA-BH-A0DI-01 | Breast | breast invasive carcinoma | Female | <65 | I/II | Chemotherapy | adriamycin | CR | ||
| MS4A6A | SNV | Missense_Mutation | c.664C>A | p.Leu222Met | p.L222M | protein_coding | deleterious(0.03) | possibly_damaging(0.526) | TCGA-FU-A3HY-01 | Cervix | cervical & endocervical cancer | Female | <65 | I/II | Chemotherapy | cisplatin | CR | ||
| MS4A6A | SNV | Missense_Mutation | novel | c.572N>A | p.Ser191Tyr | p.S191Y | protein_coding | tolerated(1) | benign(0.003) | TCGA-ZJ-AAXJ-01 | Cervix | cervical & endocervical cancer | Female | <65 | I/II | Unknown | Unknown | SD | |
| MS4A6A | SNV | Missense_Mutation | novel | c.827C>A | p.Ser276Tyr | p.S276Y | protein_coding | deleterious(0) | benign(0.231) | TCGA-F5-6814-01 | Colorectum | rectum adenocarcinoma | Male | <65 | I/II | Unknown | Unknown | SD | |
| MS4A6A | SNV | Missense_Mutation | novel | c.714N>T | p.Gln238His | p.Q238H | protein_coding | deleterious(0.04) | benign(0.1) | TCGA-A5-A0G2-01 | Endometrium | uterine corpus endometrioid carcinoma | Female | <65 | III/IV | Unknown | Unknown | SD | |
| MS4A6A | SNV | Missense_Mutation | c.202C>T | p.His68Tyr | p.H68Y | protein_coding | tolerated(1) | benign(0) | TCGA-A5-A0GJ-01 | Endometrium | uterine corpus endometrioid carcinoma | Female | <65 | I/II | Chemotherapy | carboplatin | SD | ||
| MS4A6A | SNV | Missense_Mutation | novel | c.628C>G | p.Leu210Val | p.L210V | protein_coding | tolerated(0.09) | possibly_damaging(0.823) | TCGA-AJ-A2QM-01 | Endometrium | uterine corpus endometrioid carcinoma | Female | >=65 | I/II | Chemotherapy | carboplatin | CR | |
| MS4A6A | SNV | Missense_Mutation | c.310N>G | p.Thr104Ala | p.T104A | protein_coding | tolerated(0.05) | benign(0.396) | TCGA-AP-A0LD-01 | Endometrium | uterine corpus endometrioid carcinoma | Female | <65 | I/II | Unknown | Unknown | SD | ||
| MS4A6A | SNV | Missense_Mutation | rs371493203 | c.703N>T | p.Arg235Trp | p.R235W | protein_coding | tolerated(1) | benign(0) | TCGA-AP-A1DV-01 | Endometrium | uterine corpus endometrioid carcinoma | Female | <65 | I/II | Unknown | Unknown | SD | |
| MS4A6A | SNV | Missense_Mutation | novel | c.458C>T | p.Ala153Val | p.A153V | protein_coding | tolerated(1) | benign(0.1) | TCGA-AX-A06F-01 | Endometrium | uterine corpus endometrioid carcinoma | Female | <65 | III/IV | Chemotherapy | carboplatin | SD |
| Page: 1 2 3 4 5 |
Top |
Related drugs of malignant transformation related genes |
| Identification of chemicals and drugs interact with genes involved in malignant transfromation |
| (DGIdb 4.0) |
| Entrez ID | Symbol | Category | Interaction Types | Drug Claim Name | Drug Name | PMIDs |
| Page: 1 |

Copyright 2023-Present -The University of Texas Health Science Center at Houston |