
|
|||||
|
 | |
| |
| |
| |
| |
| |
|
Gene: MRTFB |
Gene summary for MRTFB |
| Gene information | Species | Human | Gene symbol | MRTFB | Gene ID | 57496 |
| Gene name | myocardin related transcription factor B | |
| Gene Alias | MKL2 | |
| Cytomap | 16p13.12 | |
| Gene Type | protein-coding | GO ID | GO:0006139 | UniProtAcc | Q9ULH7 |
Top |
Malignant transformation analysis |
| Identification of the aberrant gene expression in precancerous and cancerous lesions by comparing the gene expression of stem-like cells in diseased tissues with normal stem cells |
| Entrez ID | Symbol | Replicates | Species | Organ | Tissue | Adj P-value | Log2FC | Malignancy |
| 57496 | MRTFB | CCI_1 | Human | Cervix | CC | 2.51e-07 | 7.19e-01 | 0.528 |
| 57496 | MRTFB | CCI_2 | Human | Cervix | CC | 7.51e-07 | 1.12e+00 | 0.5249 |
| 57496 | MRTFB | CCI_3 | Human | Cervix | CC | 2.39e-12 | 9.83e-01 | 0.516 |
| 57496 | MRTFB | Tumor | Human | Cervix | CC | 3.40e-02 | -9.40e-02 | 0.1241 |
| 57496 | MRTFB | HTA11_3410_2000001011 | Human | Colorectum | AD | 2.23e-18 | 3.38e-01 | 0.0155 |
| 57496 | MRTFB | HTA11_2487_2000001011 | Human | Colorectum | SER | 1.45e-16 | 4.25e-01 | -0.1808 |
| 57496 | MRTFB | HTA11_2951_2000001011 | Human | Colorectum | AD | 2.49e-08 | 3.63e-01 | 0.0216 |
| 57496 | MRTFB | HTA11_1938_2000001011 | Human | Colorectum | AD | 7.67e-28 | 7.86e-01 | -0.0811 |
| 57496 | MRTFB | HTA11_78_2000001011 | Human | Colorectum | AD | 3.30e-29 | 6.78e-01 | -0.1088 |
| 57496 | MRTFB | HTA11_347_2000001011 | Human | Colorectum | AD | 2.94e-66 | 1.09e+00 | -0.1954 |
| 57496 | MRTFB | HTA11_411_2000001011 | Human | Colorectum | SER | 1.35e-12 | 7.74e-01 | -0.2602 |
| 57496 | MRTFB | HTA11_2112_2000001011 | Human | Colorectum | SER | 1.08e-06 | 3.96e-01 | -0.2196 |
| 57496 | MRTFB | HTA11_3361_2000001011 | Human | Colorectum | AD | 3.86e-11 | 3.40e-01 | -0.1207 |
| 57496 | MRTFB | HTA11_83_2000001011 | Human | Colorectum | SER | 1.40e-25 | 7.53e-01 | -0.1526 |
| 57496 | MRTFB | HTA11_696_2000001011 | Human | Colorectum | AD | 2.14e-33 | 6.16e-01 | -0.1464 |
| 57496 | MRTFB | HTA11_866_2000001011 | Human | Colorectum | AD | 1.94e-44 | 7.20e-01 | -0.1001 |
| 57496 | MRTFB | HTA11_1391_2000001011 | Human | Colorectum | AD | 4.37e-31 | 7.63e-01 | -0.059 |
| 57496 | MRTFB | HTA11_2992_2000001011 | Human | Colorectum | SER | 2.54e-11 | 5.46e-01 | -0.1706 |
| 57496 | MRTFB | HTA11_5212_2000001011 | Human | Colorectum | AD | 1.67e-10 | 4.59e-01 | -0.2061 |
| 57496 | MRTFB | HTA11_5216_2000001011 | Human | Colorectum | SER | 2.17e-09 | 5.15e-01 | -0.1462 |
| Page: 1 2 3 4 5 |
| Tissue | Expression Dynamics | Abbreviation |
| Cervix | 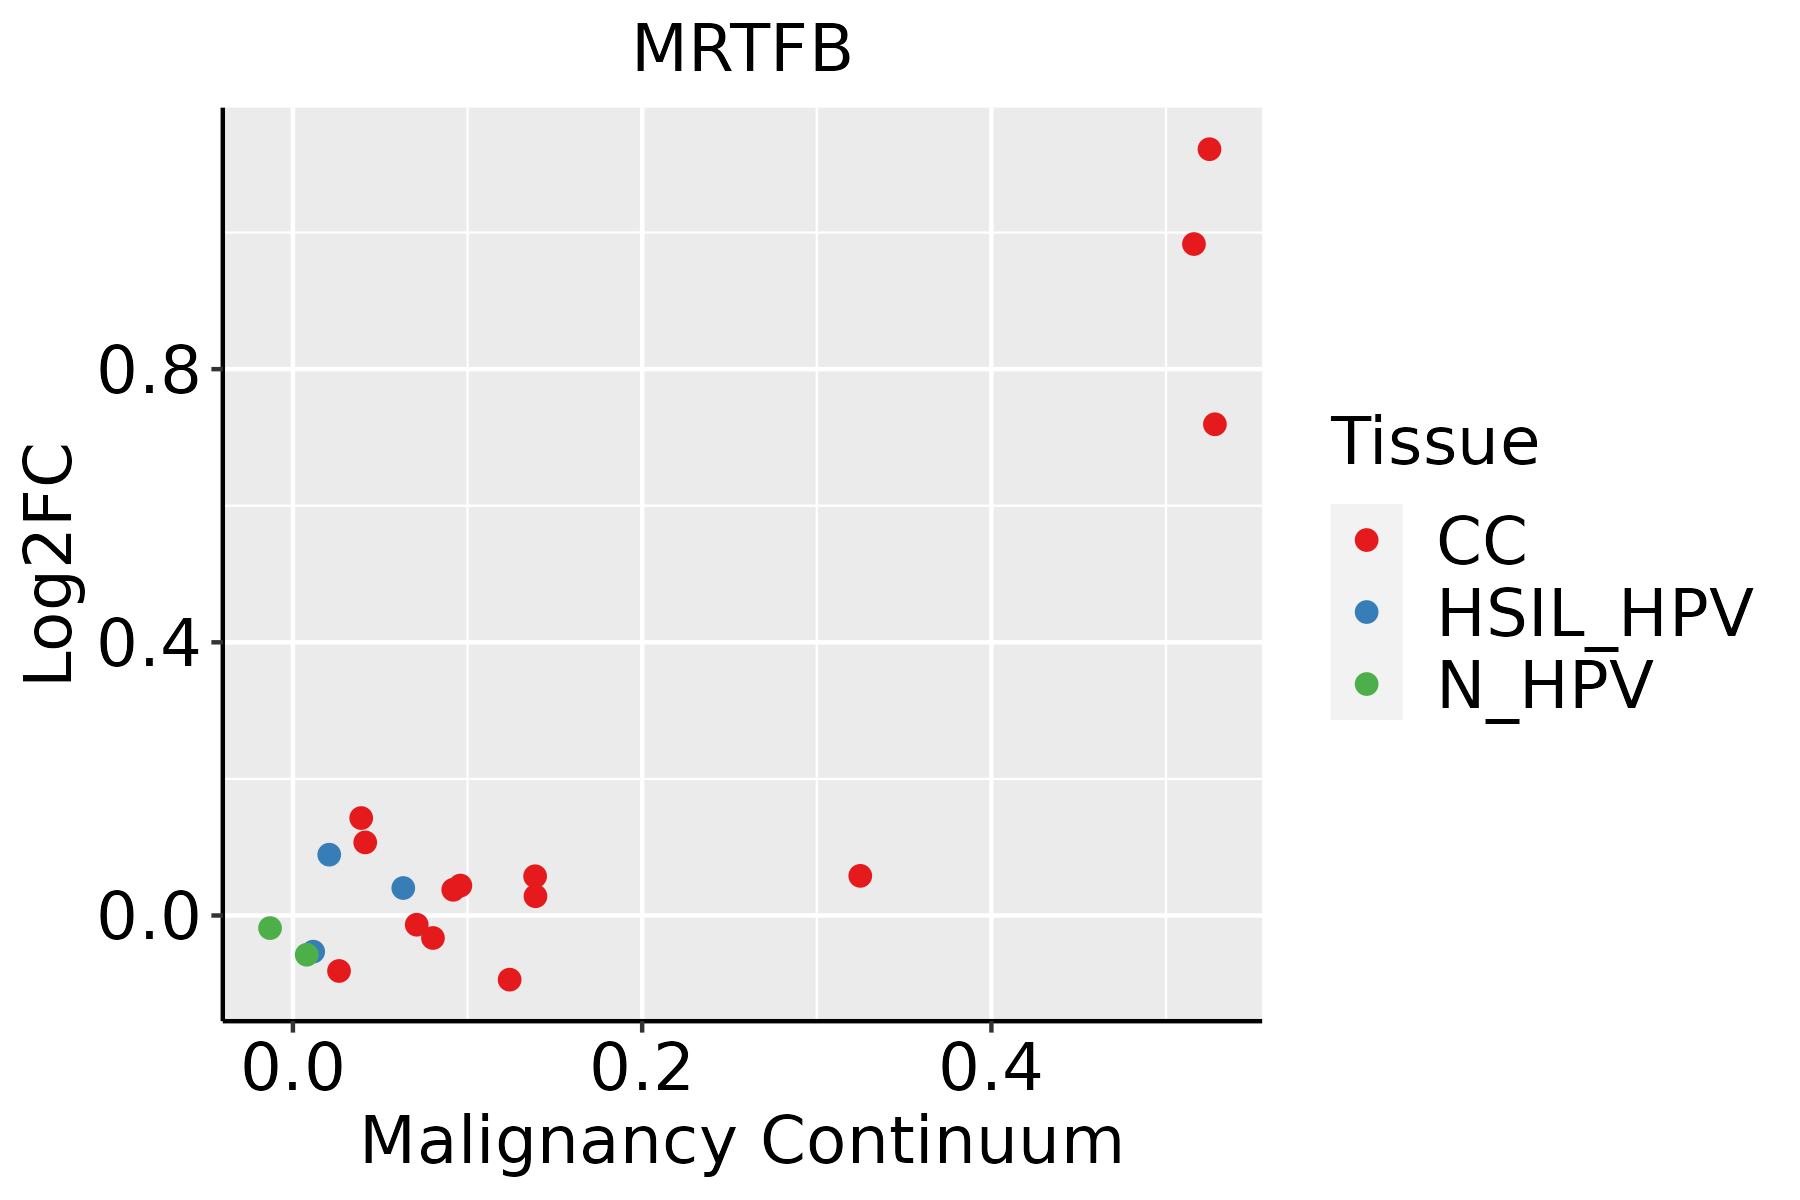 | CC: Cervix cancer |
| HSIL_HPV: HPV-infected high-grade squamous intraepithelial lesions | ||
| N_HPV: HPV-infected normal cervix | ||
| Colorectum (GSE201348) |  | FAP: Familial adenomatous polyposis |
| CRC: Colorectal cancer | ||
| Colorectum (HTA11) |  | AD: Adenomas |
| SER: Sessile serrated lesions | ||
| MSI-H: Microsatellite-high colorectal cancer | ||
| MSS: Microsatellite stable colorectal cancer | ||
| Endometrium |  | AEH: Atypical endometrial hyperplasia |
| EEC: Endometrioid Cancer | ||
| Lung |  | AAH: Atypical adenomatous hyperplasia |
| AIS: Adenocarcinoma in situ | ||
| IAC: Invasive lung adenocarcinoma | ||
| MIA: Minimally invasive adenocarcinoma | ||
| Prostate | 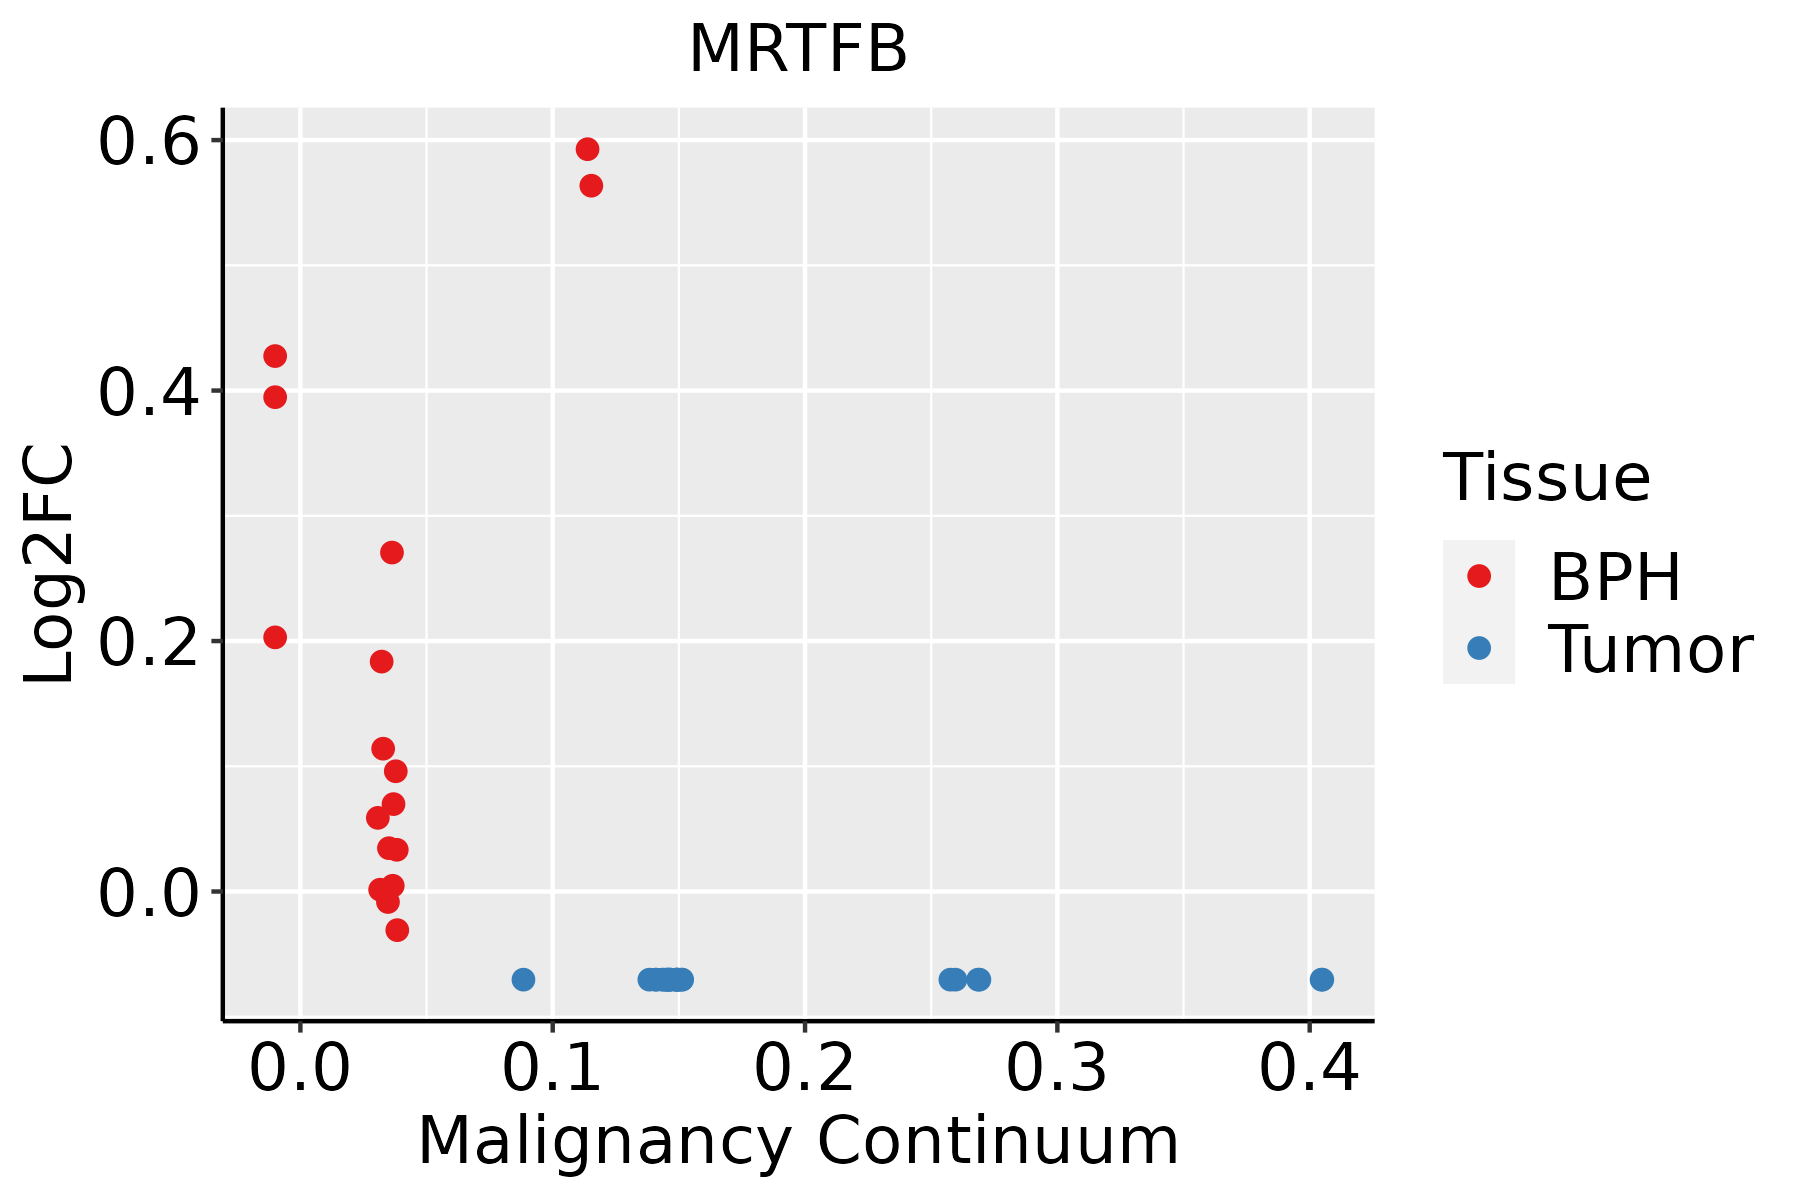 | BPH: Benign Prostatic Hyperplasia |
| ∗log2FC in expression of this searched gene in stem-like cells from each diseased tissue sample relative to stem-like cells in normal samples in each tissue plotted against the malignancy continuum. Samples are colored based on if they are from different disease stage. |
Top |
Malignant transformation related pathway analysis |
| Find out the enriched GO biological processes and KEGG pathways involved in transition from healthy to precancer to cancer |
| Tissue | Disease Stage | Enriched GO biological Processes |
| Colorectum | AD |  |
| Colorectum | SER |  |
| Colorectum | MSS |  |
| Colorectum | MSI-H |  |
| Colorectum | FAP |  |
| ∗Top 15 enriched GO BP terms are showed in the bar plot of each disease state in each tissue. Each row represents a significant GO biological process which is colored according to the -log10(p.adjust). |
| Page: 1 2 3 4 5 6 7 8 9 |
| GO ID | Tissue | Disease Stage | Description | Gene Ratio | Bg Ratio | pvalue | p.adjust | Count |
| GO:00616148 | Cervix | CC | pri-miRNA transcription by RNA polymerase II | 20/2311 | 55/18723 | 4.22e-06 | 1.09e-04 | 20 |
| GO:19028938 | Cervix | CC | regulation of pri-miRNA transcription by RNA polymerase II | 19/2311 | 54/18723 | 1.27e-05 | 2.60e-04 | 19 |
| GO:19028955 | Cervix | CC | positive regulation of pri-miRNA transcription by RNA polymerase II | 15/2311 | 42/18723 | 8.42e-05 | 1.13e-03 | 15 |
| GO:00605375 | Cervix | CC | muscle tissue development | 76/2311 | 403/18723 | 9.76e-05 | 1.27e-03 | 76 |
| GO:00147064 | Cervix | CC | striated muscle tissue development | 72/2311 | 384/18723 | 1.76e-04 | 2.07e-03 | 72 |
| GO:00426924 | Cervix | CC | muscle cell differentiation | 69/2311 | 384/18723 | 8.12e-04 | 7.09e-03 | 69 |
| GO:00075173 | Cervix | CC | muscle organ development | 58/2311 | 327/18723 | 2.73e-03 | 1.85e-02 | 58 |
| GO:0061614 | Colorectum | AD | pri-miRNA transcription by RNA polymerase II | 24/3918 | 55/18723 | 1.22e-04 | 1.78e-03 | 24 |
| GO:1902893 | Colorectum | AD | regulation of pri-miRNA transcription by RNA polymerase II | 23/3918 | 54/18723 | 2.60e-04 | 3.25e-03 | 23 |
| GO:1902895 | Colorectum | AD | positive regulation of pri-miRNA transcription by RNA polymerase II | 17/3918 | 42/18723 | 3.10e-03 | 2.30e-02 | 17 |
| GO:00616141 | Colorectum | SER | pri-miRNA transcription by RNA polymerase II | 18/2897 | 55/18723 | 1.11e-03 | 1.28e-02 | 18 |
| GO:19028931 | Colorectum | SER | regulation of pri-miRNA transcription by RNA polymerase II | 17/2897 | 54/18723 | 2.42e-03 | 2.30e-02 | 17 |
| GO:00605376 | Endometrium | AEH | muscle tissue development | 83/2100 | 403/18723 | 2.57e-08 | 1.50e-06 | 83 |
| GO:00616149 | Endometrium | AEH | pri-miRNA transcription by RNA polymerase II | 20/2100 | 55/18723 | 9.36e-07 | 3.24e-05 | 20 |
| GO:00147065 | Endometrium | AEH | striated muscle tissue development | 75/2100 | 384/18723 | 1.06e-06 | 3.62e-05 | 75 |
| GO:19028939 | Endometrium | AEH | regulation of pri-miRNA transcription by RNA polymerase II | 19/2100 | 54/18723 | 3.09e-06 | 8.55e-05 | 19 |
| GO:19028956 | Endometrium | AEH | positive regulation of pri-miRNA transcription by RNA polymerase II | 16/2100 | 42/18723 | 5.66e-06 | 1.41e-04 | 16 |
| GO:00075174 | Endometrium | AEH | muscle organ development | 60/2100 | 327/18723 | 8.19e-05 | 1.22e-03 | 60 |
| GO:00426925 | Endometrium | AEH | muscle cell differentiation | 68/2100 | 384/18723 | 8.88e-05 | 1.30e-03 | 68 |
| GO:006053713 | Endometrium | EEC | muscle tissue development | 82/2168 | 403/18723 | 2.14e-07 | 9.38e-06 | 82 |
| Page: 1 2 3 |
| Pathway ID | Tissue | Disease Stage | Description | Gene Ratio | Bg Ratio | pvalue | p.adjust | qvalue | Count |
| Page: 1 |
Top |
Cell-cell communication analysis |
| Identification of potential cell-cell interactions between two cell types and their ligand-receptor pairs for different disease states |
| Ligand | Receptor | LRpair | Pathway | Tissue | Disease Stage |
| Page: 1 |
Top |
Single-cell gene regulatory network inference analysis |
| Find out the significant the regulons (TFs) and the target genes of each regulon across cell types for different disease states |
| TF | Cell Type | Tissue | Disease Stage | Target Gene | RSS | Regulon Activity |
| ∗The dot plots of a searched regulon are shown for all cell subpopulations in each disease state of each tissue based on the regulon specific score inferred using pySCENIC and by calculating the average expression. |
| Page: 1 |
Top |
Somatic mutation of malignant transformation related genes |
| Annotation of somatic variants for genes involved in malignant transformation |
| Hugo Symbol | Variant Class | Variant Classification | dbSNP RS | HGVSc | HGVSp | HGVSp Short | SWISSPROT | BIOTYPE | SIFT | PolyPhen | Tumor Sample Barcode | Tissue | Histology | Sex | Age | Stage | Therapy Types | Drugs | Outcome |
| Page: 1 |
Top |
Related drugs of malignant transformation related genes |
| Identification of chemicals and drugs interact with genes involved in malignant transfromation |
| (DGIdb 4.0) |
| Entrez ID | Symbol | Category | Interaction Types | Drug Claim Name | Drug Name | PMIDs |
| Page: 1 |

Copyright 2023-Present -The University of Texas Health Science Center at Houston |