
|
|||||
|
 | |
| |
| |
| |
| |
| |
|
Gene: MRS2 |
Gene summary for MRS2 |
| Gene information | Species | Human | Gene symbol | MRS2 | Gene ID | 57380 |
| Gene name | magnesium transporter MRS2 | |
| Gene Alias | HPT | |
| Cytomap | 6p22.3 | |
| Gene Type | protein-coding | GO ID | GO:0006082 | UniProtAcc | Q9HD23 |
Top |
Malignant transformation analysis |
| Identification of the aberrant gene expression in precancerous and cancerous lesions by comparing the gene expression of stem-like cells in diseased tissues with normal stem cells |
| Entrez ID | Symbol | Replicates | Species | Organ | Tissue | Adj P-value | Log2FC | Malignancy |
| 57380 | MRS2 | LZE4T | Human | Esophagus | ESCC | 1.69e-08 | 2.26e-01 | 0.0811 |
| 57380 | MRS2 | LZE7T | Human | Esophagus | ESCC | 2.91e-09 | 5.61e-01 | 0.0667 |
| 57380 | MRS2 | LZE8T | Human | Esophagus | ESCC | 3.84e-07 | 2.20e-01 | 0.067 |
| 57380 | MRS2 | LZE20T | Human | Esophagus | ESCC | 3.18e-03 | 1.52e-01 | 0.0662 |
| 57380 | MRS2 | LZE24T | Human | Esophagus | ESCC | 1.18e-16 | 4.84e-01 | 0.0596 |
| 57380 | MRS2 | LZE21T | Human | Esophagus | ESCC | 2.31e-03 | 2.32e-01 | 0.0655 |
| 57380 | MRS2 | LZE6T | Human | Esophagus | ESCC | 6.80e-04 | 3.52e-01 | 0.0845 |
| 57380 | MRS2 | P1T-E | Human | Esophagus | ESCC | 1.16e-04 | 3.03e-01 | 0.0875 |
| 57380 | MRS2 | P2T-E | Human | Esophagus | ESCC | 2.06e-28 | 4.38e-01 | 0.1177 |
| 57380 | MRS2 | P4T-E | Human | Esophagus | ESCC | 9.10e-22 | 5.50e-01 | 0.1323 |
| 57380 | MRS2 | P5T-E | Human | Esophagus | ESCC | 2.32e-16 | 2.86e-01 | 0.1327 |
| 57380 | MRS2 | P8T-E | Human | Esophagus | ESCC | 1.77e-23 | 2.97e-01 | 0.0889 |
| 57380 | MRS2 | P9T-E | Human | Esophagus | ESCC | 1.43e-12 | 2.82e-01 | 0.1131 |
| 57380 | MRS2 | P10T-E | Human | Esophagus | ESCC | 1.57e-17 | 3.03e-01 | 0.116 |
| 57380 | MRS2 | P11T-E | Human | Esophagus | ESCC | 2.87e-10 | 4.21e-01 | 0.1426 |
| 57380 | MRS2 | P12T-E | Human | Esophagus | ESCC | 4.64e-23 | 4.08e-01 | 0.1122 |
| 57380 | MRS2 | P15T-E | Human | Esophagus | ESCC | 7.95e-16 | 3.75e-01 | 0.1149 |
| 57380 | MRS2 | P16T-E | Human | Esophagus | ESCC | 1.80e-18 | 3.93e-01 | 0.1153 |
| 57380 | MRS2 | P19T-E | Human | Esophagus | ESCC | 8.72e-08 | 6.28e-01 | 0.1662 |
| 57380 | MRS2 | P20T-E | Human | Esophagus | ESCC | 5.49e-19 | 4.68e-01 | 0.1124 |
| Page: 1 2 3 4 5 |
| Tissue | Expression Dynamics | Abbreviation |
| Esophagus | 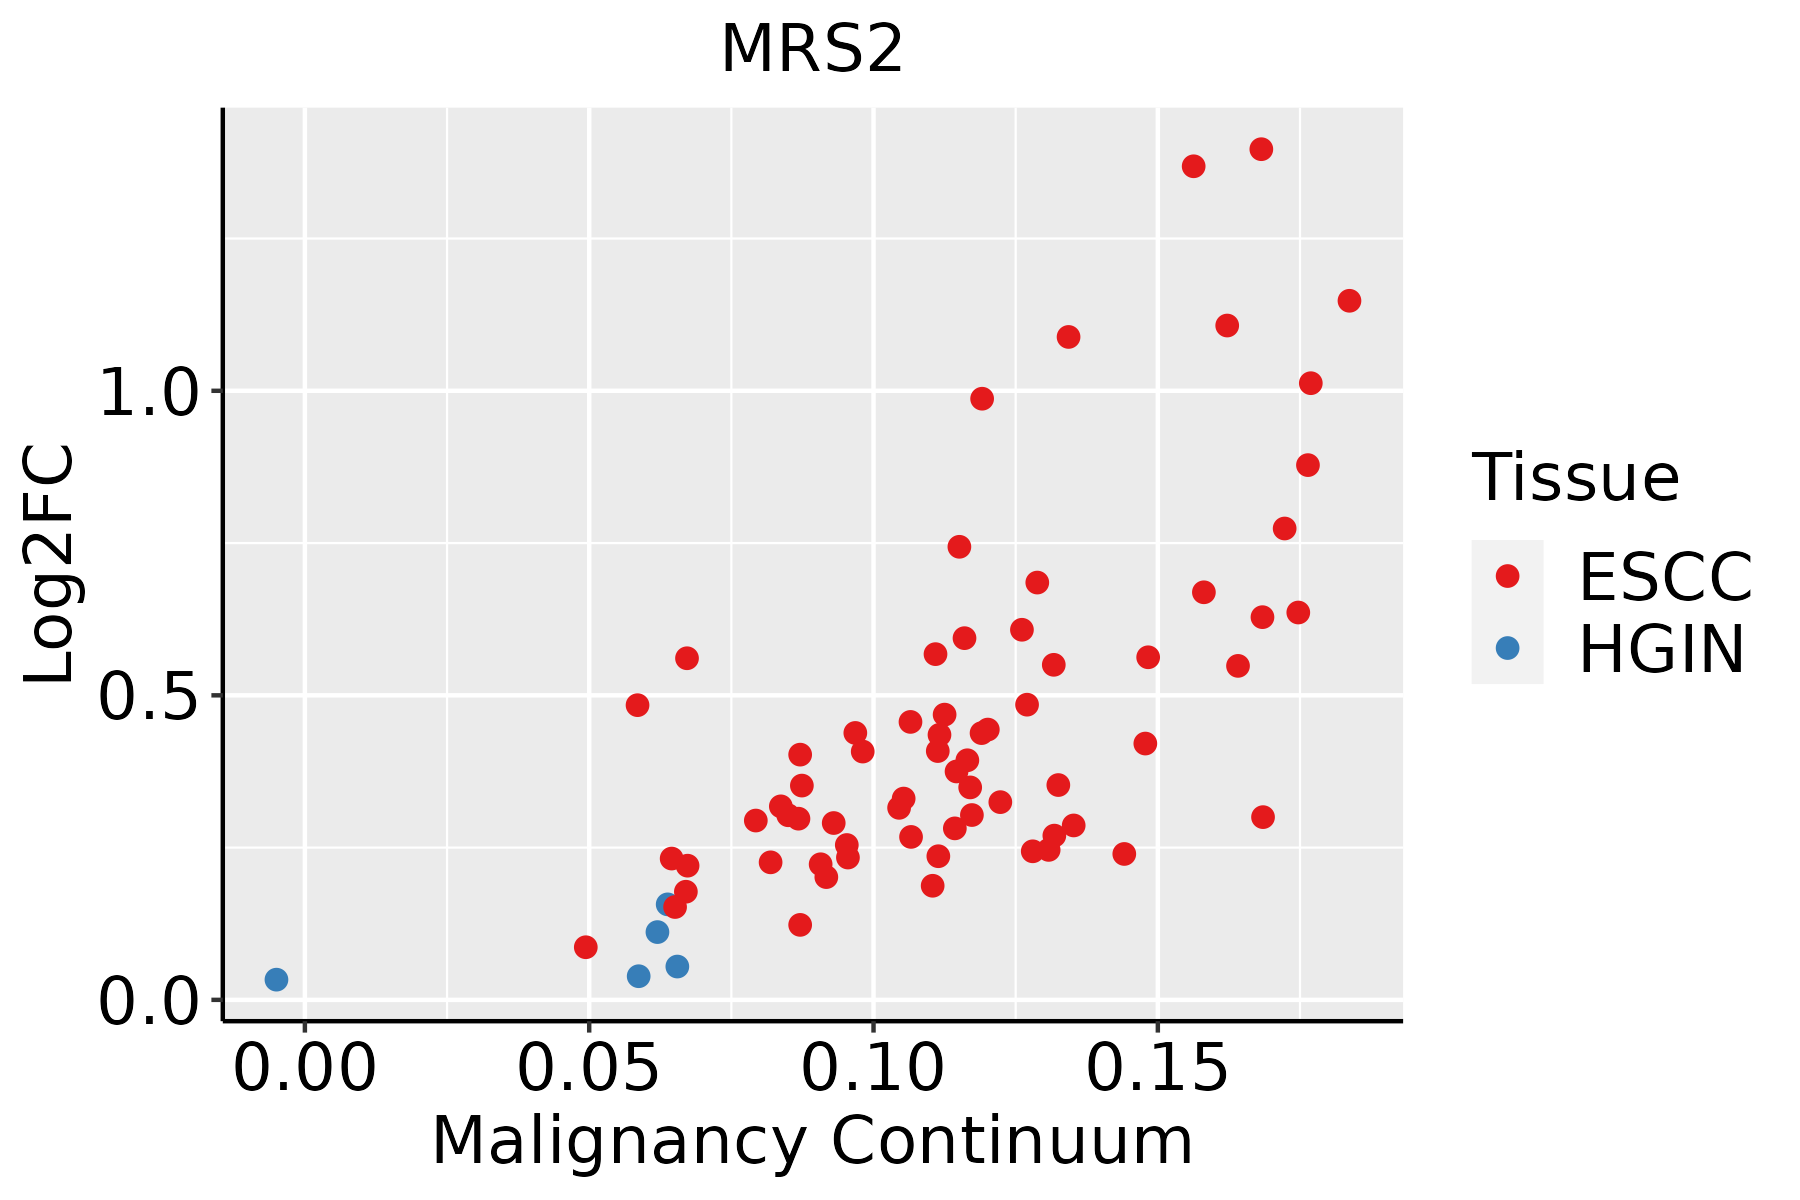 | ESCC: Esophageal squamous cell carcinoma |
| HGIN: High-grade intraepithelial neoplasias | ||
| LGIN: Low-grade intraepithelial neoplasias | ||
| Liver | 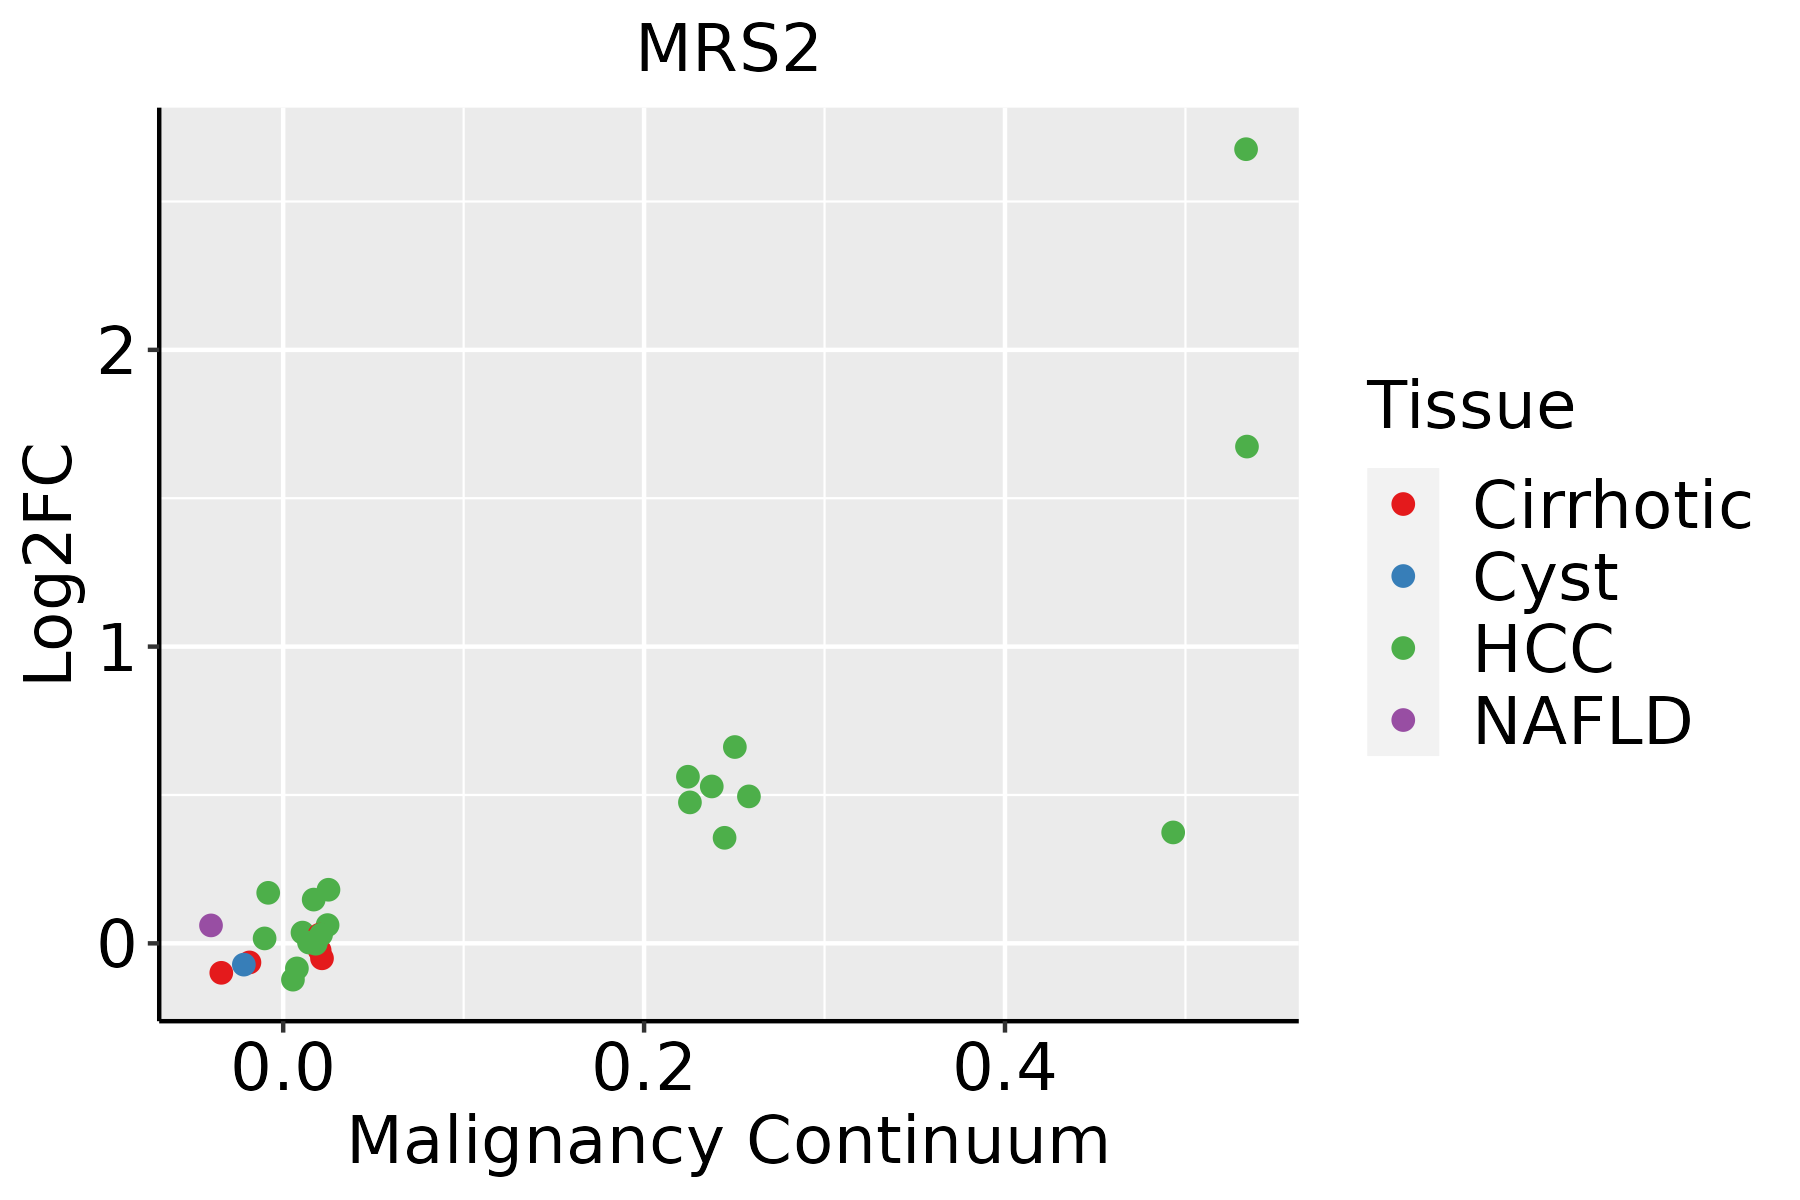 | HCC: Hepatocellular carcinoma |
| NAFLD: Non-alcoholic fatty liver disease | ||
| Oral Cavity | 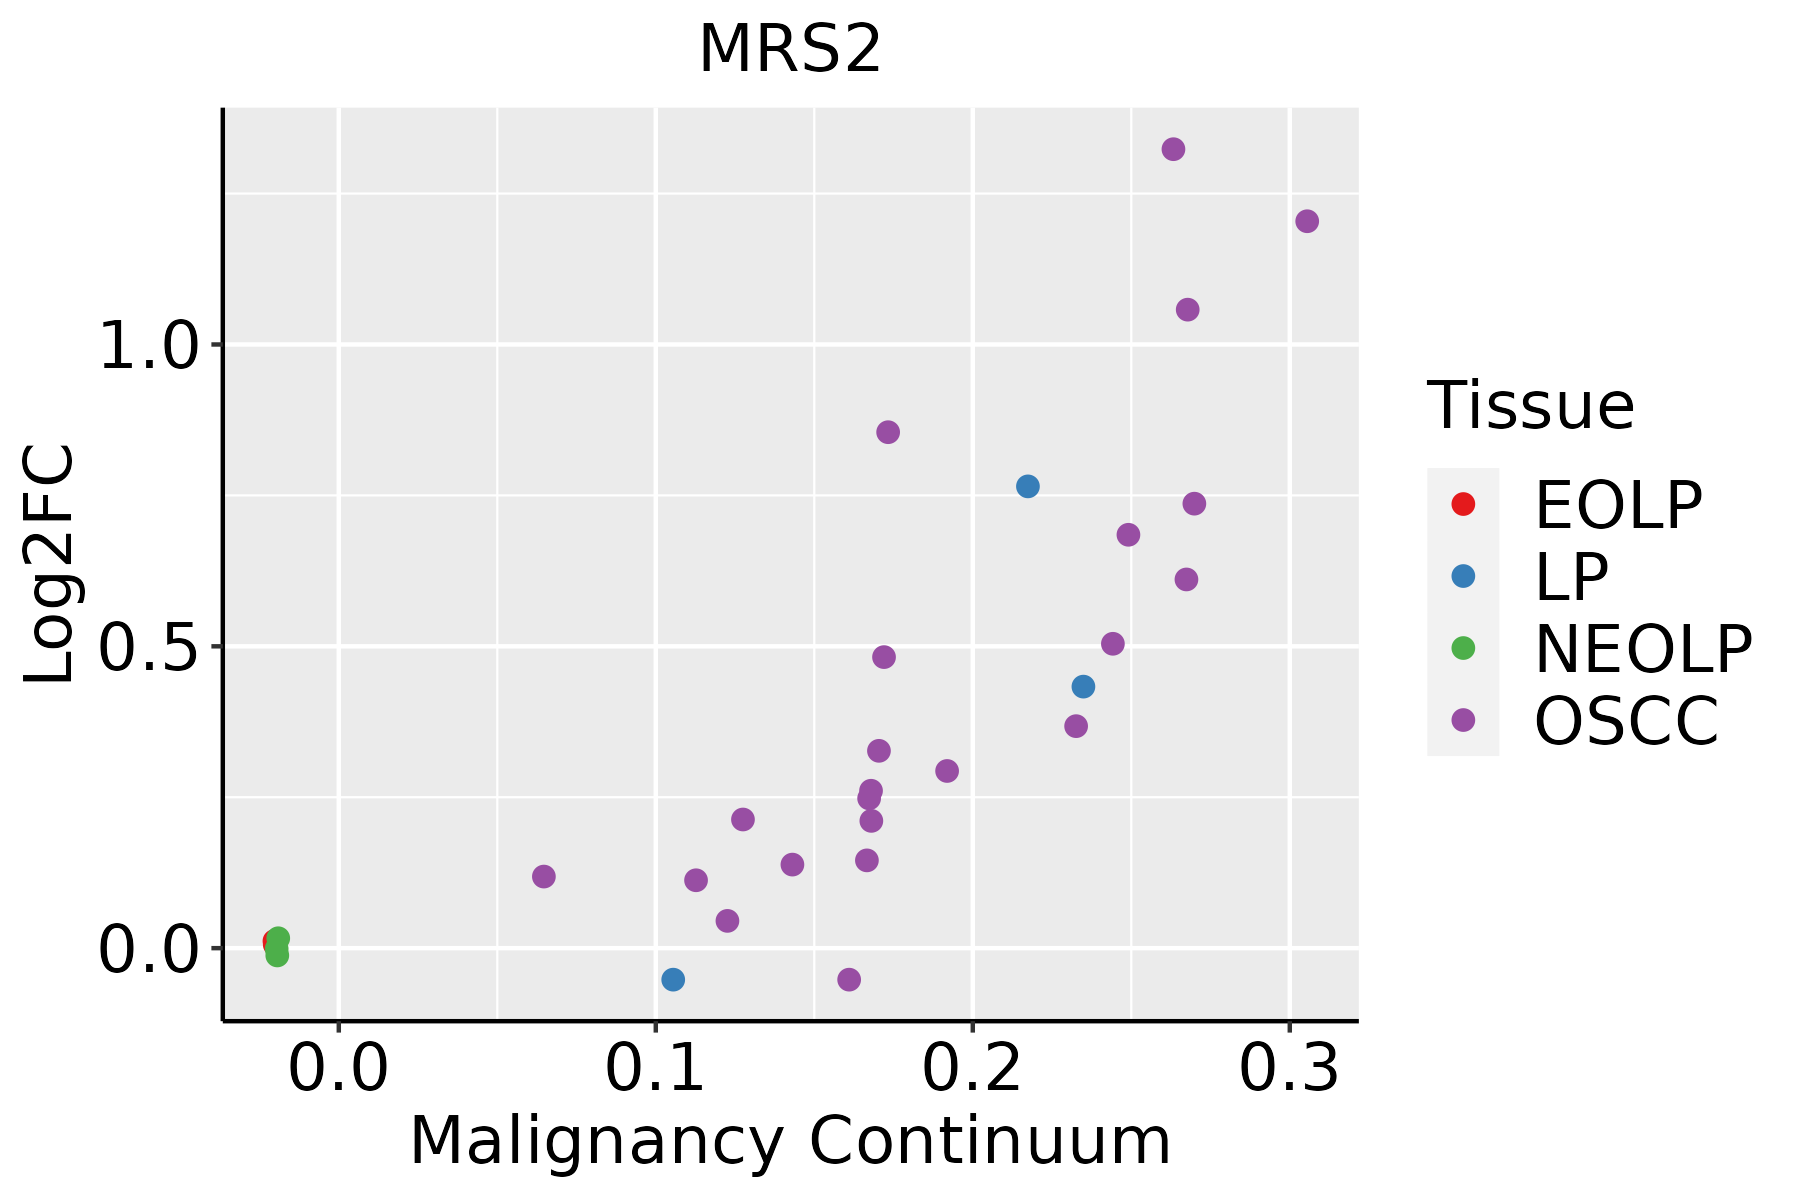 | EOLP: Erosive Oral lichen planus |
| LP: leukoplakia | ||
| NEOLP: Non-erosive oral lichen planus | ||
| OSCC: Oral squamous cell carcinoma | ||
| Skin | 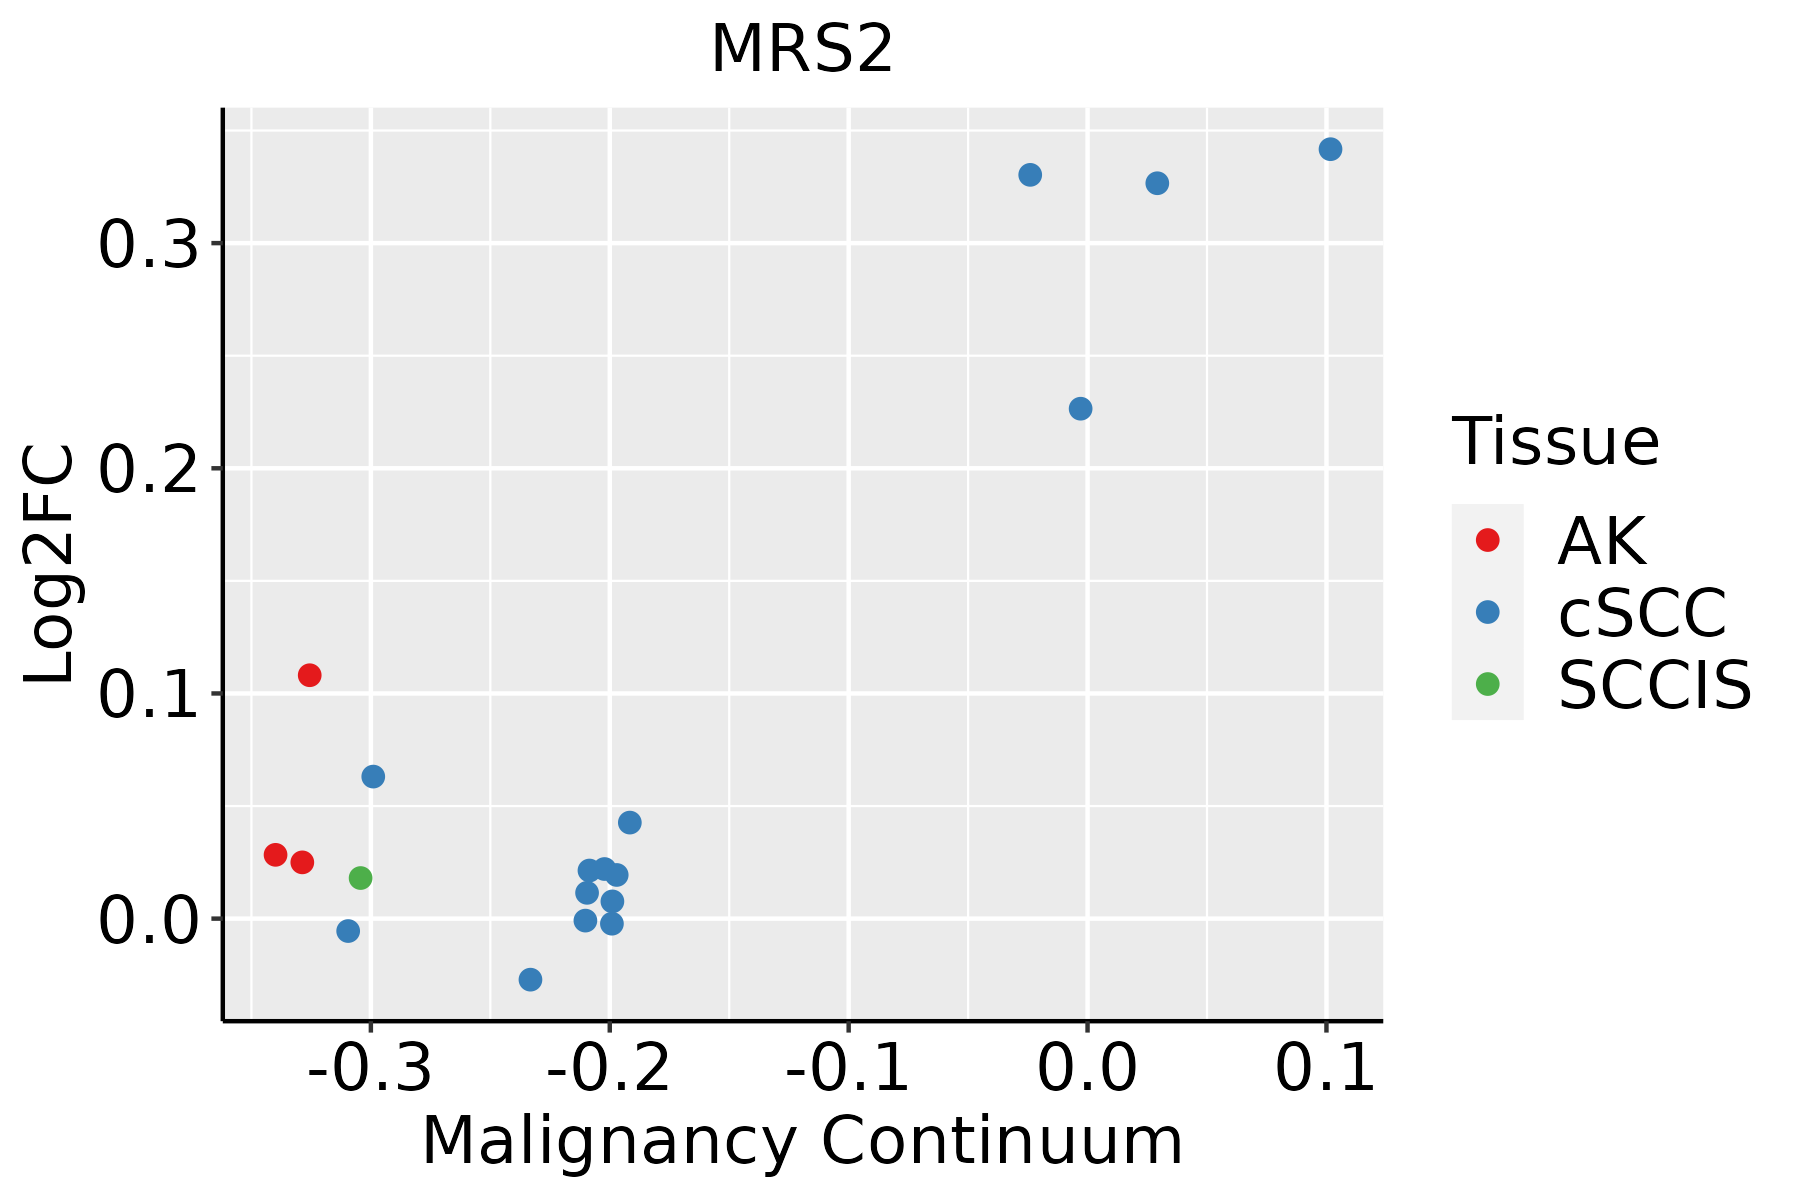 | AK: Actinic keratosis |
| cSCC: Cutaneous squamous cell carcinoma | ||
| SCCIS:squamous cell carcinoma in situ | ||
| Thyroid | 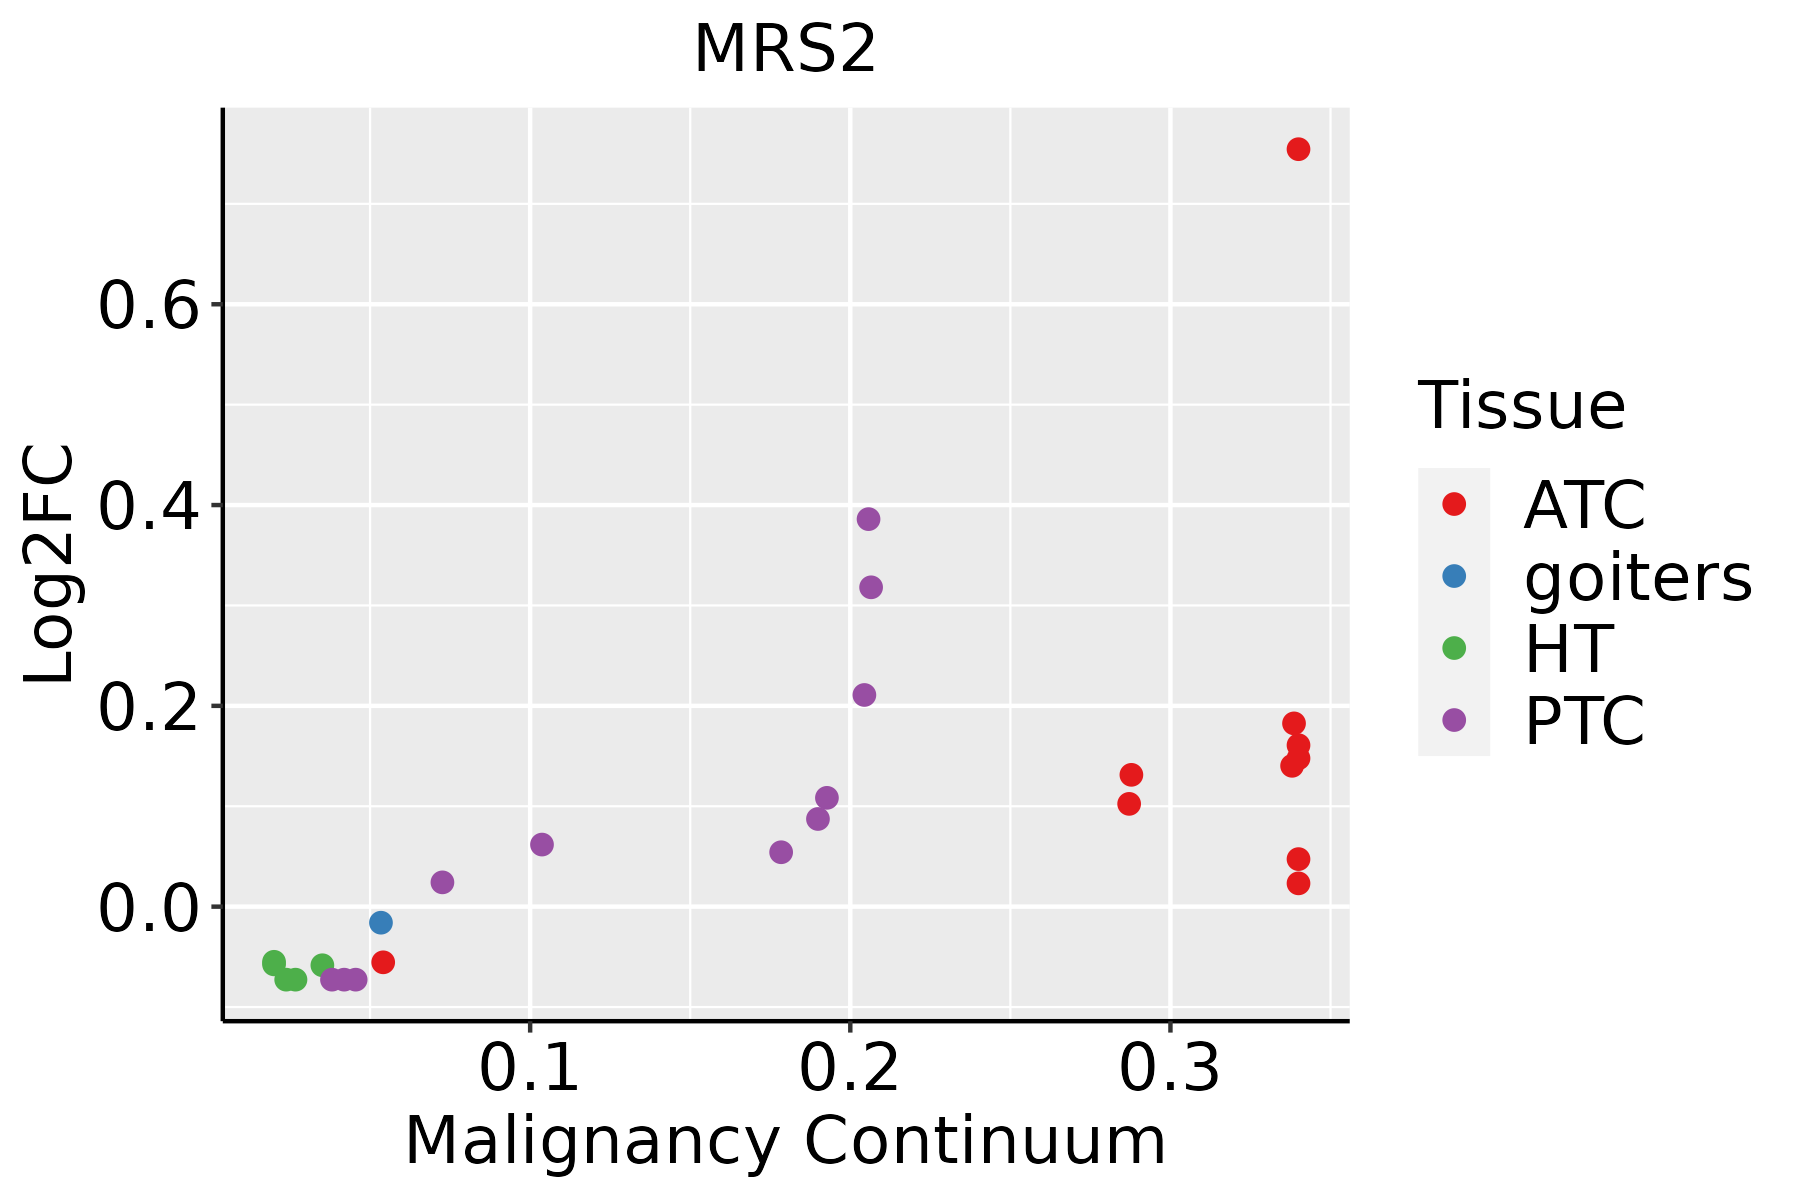 | ATC: Anaplastic thyroid cancer |
| HT: Hashimoto's thyroiditis | ||
| PTC: Papillary thyroid cancer |
| ∗log2FC in expression of this searched gene in stem-like cells from each diseased tissue sample relative to stem-like cells in normal samples in each tissue plotted against the malignancy continuum. Samples are colored based on if they are from different disease stage. |
Top |
Malignant transformation related pathway analysis |
| Find out the enriched GO biological processes and KEGG pathways involved in transition from healthy to precancer to cancer |
| Tissue | Disease Stage | Enriched GO biological Processes |
| Colorectum | AD |  |
| Colorectum | SER |  |
| Colorectum | MSS |  |
| Colorectum | MSI-H |  |
| Colorectum | FAP |  |
| ∗Top 15 enriched GO BP terms are showed in the bar plot of each disease state in each tissue. Each row represents a significant GO biological process which is colored according to the -log10(p.adjust). |
| Page: 1 2 3 4 5 6 7 8 9 |
| GO ID | Tissue | Disease Stage | Description | Gene Ratio | Bg Ratio | pvalue | p.adjust | Count |
| GO:0006839110 | Esophagus | ESCC | mitochondrial transport | 187/8552 | 254/18723 | 8.35e-20 | 9.81e-18 | 187 |
| GO:1990542110 | Esophagus | ESCC | mitochondrial transmembrane transport | 72/8552 | 102/18723 | 2.94e-07 | 4.23e-06 | 72 |
| GO:000683912 | Liver | HCC | mitochondrial transport | 184/7958 | 254/18723 | 2.30e-22 | 3.83e-20 | 184 |
| GO:199054212 | Liver | HCC | mitochondrial transmembrane transport | 78/7958 | 102/18723 | 2.73e-12 | 1.26e-10 | 78 |
| GO:000683918 | Oral cavity | OSCC | mitochondrial transport | 162/7305 | 254/18723 | 8.96e-16 | 6.52e-14 | 162 |
| GO:199054218 | Oral cavity | OSCC | mitochondrial transmembrane transport | 56/7305 | 102/18723 | 8.06e-04 | 4.32e-03 | 56 |
| GO:000683919 | Oral cavity | LP | mitochondrial transport | 119/4623 | 254/18723 | 1.06e-14 | 1.33e-12 | 119 |
| GO:199054219 | Oral cavity | LP | mitochondrial transmembrane transport | 37/4623 | 102/18723 | 5.93e-03 | 3.53e-02 | 37 |
| GO:000683927 | Skin | cSCC | mitochondrial transport | 124/4864 | 254/18723 | 3.54e-15 | 2.81e-13 | 124 |
| GO:199054224 | Skin | cSCC | mitochondrial transmembrane transport | 43/4864 | 102/18723 | 2.68e-04 | 2.16e-03 | 43 |
| GO:000683928 | Thyroid | PTC | mitochondrial transport | 150/5968 | 254/18723 | 2.76e-19 | 3.34e-17 | 150 |
| GO:199054225 | Thyroid | PTC | mitochondrial transmembrane transport | 57/5968 | 102/18723 | 4.49e-07 | 7.38e-06 | 57 |
| GO:000683929 | Thyroid | ATC | mitochondrial transport | 151/6293 | 254/18723 | 2.07e-17 | 2.14e-15 | 151 |
| GO:199054226 | Thyroid | ATC | mitochondrial transmembrane transport | 57/6293 | 102/18723 | 3.05e-06 | 3.49e-05 | 57 |
| Page: 1 |
| Pathway ID | Tissue | Disease Stage | Description | Gene Ratio | Bg Ratio | pvalue | p.adjust | qvalue | Count |
| Page: 1 |
Top |
Cell-cell communication analysis |
| Identification of potential cell-cell interactions between two cell types and their ligand-receptor pairs for different disease states |
| Ligand | Receptor | LRpair | Pathway | Tissue | Disease Stage |
| Page: 1 |
Top |
Single-cell gene regulatory network inference analysis |
| Find out the significant the regulons (TFs) and the target genes of each regulon across cell types for different disease states |
| TF | Cell Type | Tissue | Disease Stage | Target Gene | RSS | Regulon Activity |
| ∗The dot plots of a searched regulon are shown for all cell subpopulations in each disease state of each tissue based on the regulon specific score inferred using pySCENIC and by calculating the average expression. |
| Page: 1 |
Top |
Somatic mutation of malignant transformation related genes |
| Annotation of somatic variants for genes involved in malignant transformation |
| Hugo Symbol | Variant Class | Variant Classification | dbSNP RS | HGVSc | HGVSp | HGVSp Short | SWISSPROT | BIOTYPE | SIFT | PolyPhen | Tumor Sample Barcode | Tissue | Histology | Sex | Age | Stage | Therapy Types | Drugs | Outcome |
| MRS2 | SNV | Missense_Mutation | novel | c.1052N>G | p.Ser351Cys | p.S351C | Q9HD23 | protein_coding | deleterious(0.03) | probably_damaging(0.999) | TCGA-5L-AAT1-01 | Breast | breast invasive carcinoma | Female | <65 | III/IV | Hormone Therapy | letrozol | SD |
| MRS2 | SNV | Missense_Mutation | c.808G>C | p.Glu270Gln | p.E270Q | Q9HD23 | protein_coding | deleterious(0.03) | possibly_damaging(0.897) | TCGA-AR-A0TX-01 | Breast | breast invasive carcinoma | Female | <65 | I/II | Unknown | Unknown | SD | |
| MRS2 | SNV | Missense_Mutation | c.1023N>C | p.Leu341Phe | p.L341F | Q9HD23 | protein_coding | tolerated(0.21) | probably_damaging(0.99) | TCGA-E2-A1LH-01 | Breast | breast invasive carcinoma | Female | <65 | I/II | Chemotherapy | adriamycin | SD | |
| MRS2 | insertion | Frame_Shift_Ins | novel | c.912_913insGCAG | p.Leu305AlafsTer4 | p.L305Afs*4 | Q9HD23 | protein_coding | TCGA-BH-A0AY-01 | Breast | breast invasive carcinoma | Female | <65 | I/II | Chemotherapy | SD | |||
| MRS2 | insertion | Nonsense_Mutation | novel | c.913_914insATCGTATCTAATTCAATGTAATTCTATGAGTATGCATAC | p.Arg304_Leu305insTyrArgIleTerPheAsnValIleLeuTerValCysIle | p.R304_L305insYRI*FNVIL*VCI | Q9HD23 | protein_coding | TCGA-BH-A0AY-01 | Breast | breast invasive carcinoma | Female | <65 | I/II | Chemotherapy | SD | |||
| MRS2 | SNV | Missense_Mutation | c.1251N>C | p.Lys417Asn | p.K417N | Q9HD23 | protein_coding | deleterious_low_confidence(0) | benign(0.046) | TCGA-Q1-A73P-01 | Cervix | cervical & endocervical cancer | Female | <65 | I/II | Unknown | Unknown | SD | |
| MRS2 | SNV | Missense_Mutation | rs765832035 | c.1124G>T | p.Arg375Ile | p.R375I | Q9HD23 | protein_coding | tolerated(0.23) | benign(0.175) | TCGA-AA-3977-01 | Colorectum | colon adenocarcinoma | Male | >=65 | I/II | Unknown | Unknown | SD |
| MRS2 | SNV | Missense_Mutation | rs765832035 | c.1124N>T | p.Arg375Ile | p.R375I | Q9HD23 | protein_coding | tolerated(0.23) | benign(0.175) | TCGA-AG-A002-01 | Colorectum | rectum adenocarcinoma | Male | <65 | I/II | Unknown | Unknown | SD |
| MRS2 | deletion | Frame_Shift_Del | c.1246delN | p.Lys417ArgfsTer11 | p.K417Rfs*11 | Q9HD23 | protein_coding | TCGA-AA-3966-01 | Colorectum | colon adenocarcinoma | Female | >=65 | I/II | Unknown | Unknown | SD | |||
| MRS2 | deletion | Frame_Shift_Del | c.1246delN | p.Lys417ArgfsTer11 | p.K417Rfs*11 | Q9HD23 | protein_coding | TCGA-F4-6570-01 | Colorectum | colon adenocarcinoma | Female | >=65 | I/II | Unknown | Unknown | SD |
| Page: 1 2 3 4 |
Top |
Related drugs of malignant transformation related genes |
| Identification of chemicals and drugs interact with genes involved in malignant transfromation |
| (DGIdb 4.0) |
| Entrez ID | Symbol | Category | Interaction Types | Drug Claim Name | Drug Name | PMIDs |
| Page: 1 |

Copyright 2023-Present -The University of Texas Health Science Center at Houston |