
|
|||||
|
 | |
| |
| |
| |
| |
| |
|
Gene: MRRF |
Gene summary for MRRF |
| Gene information | Species | Human | Gene symbol | MRRF | Gene ID | 92399 |
| Gene name | mitochondrial ribosome recycling factor | |
| Gene Alias | MRFF | |
| Cytomap | 9q33.2 | |
| Gene Type | protein-coding | GO ID | GO:0006412 | UniProtAcc | Q96E11 |
Top |
Malignant transformation analysis |
| Identification of the aberrant gene expression in precancerous and cancerous lesions by comparing the gene expression of stem-like cells in diseased tissues with normal stem cells |
| Entrez ID | Symbol | Replicates | Species | Organ | Tissue | Adj P-value | Log2FC | Malignancy |
| 92399 | MRRF | HTA11_347_2000001011 | Human | Colorectum | AD | 2.82e-03 | 3.19e-01 | -0.1954 |
| 92399 | MRRF | HTA11_99999965062_69753 | Human | Colorectum | MSI-H | 5.64e-03 | 8.66e-01 | 0.3487 |
| 92399 | MRRF | HTA11_99999965104_69814 | Human | Colorectum | MSS | 2.58e-03 | 5.20e-01 | 0.281 |
| 92399 | MRRF | HTA11_99999974143_84620 | Human | Colorectum | MSS | 2.01e-04 | -2.81e-01 | 0.3005 |
| 92399 | MRRF | A015-C-203 | Human | Colorectum | FAP | 1.20e-18 | -3.53e-01 | -0.1294 |
| 92399 | MRRF | A015-C-204 | Human | Colorectum | FAP | 7.01e-04 | -2.55e-01 | -0.0228 |
| 92399 | MRRF | A014-C-040 | Human | Colorectum | FAP | 2.57e-02 | -3.81e-01 | -0.1184 |
| 92399 | MRRF | A002-C-201 | Human | Colorectum | FAP | 2.74e-11 | -3.60e-01 | 0.0324 |
| 92399 | MRRF | A001-C-119 | Human | Colorectum | FAP | 9.40e-09 | -4.47e-01 | -0.1557 |
| 92399 | MRRF | A001-C-108 | Human | Colorectum | FAP | 2.59e-12 | -3.08e-01 | -0.0272 |
| 92399 | MRRF | A002-C-205 | Human | Colorectum | FAP | 1.57e-15 | -3.87e-01 | -0.1236 |
| 92399 | MRRF | A001-C-104 | Human | Colorectum | FAP | 4.98e-04 | -2.60e-01 | 0.0184 |
| 92399 | MRRF | A015-C-006 | Human | Colorectum | FAP | 1.98e-09 | -2.93e-01 | -0.0994 |
| 92399 | MRRF | A015-C-106 | Human | Colorectum | FAP | 2.76e-08 | -2.48e-01 | -0.0511 |
| 92399 | MRRF | A002-C-114 | Human | Colorectum | FAP | 1.96e-12 | -3.94e-01 | -0.1561 |
| 92399 | MRRF | A015-C-104 | Human | Colorectum | FAP | 1.15e-23 | -3.95e-01 | -0.1899 |
| 92399 | MRRF | A001-C-014 | Human | Colorectum | FAP | 4.25e-12 | -3.12e-01 | 0.0135 |
| 92399 | MRRF | A002-C-016 | Human | Colorectum | FAP | 1.38e-12 | -3.30e-01 | 0.0521 |
| 92399 | MRRF | A015-C-002 | Human | Colorectum | FAP | 4.51e-07 | -3.06e-01 | -0.0763 |
| 92399 | MRRF | A001-C-203 | Human | Colorectum | FAP | 6.30e-09 | -2.36e-01 | -0.0481 |
| Page: 1 2 3 4 5 6 |
| Tissue | Expression Dynamics | Abbreviation |
| Colorectum (GSE201348) | 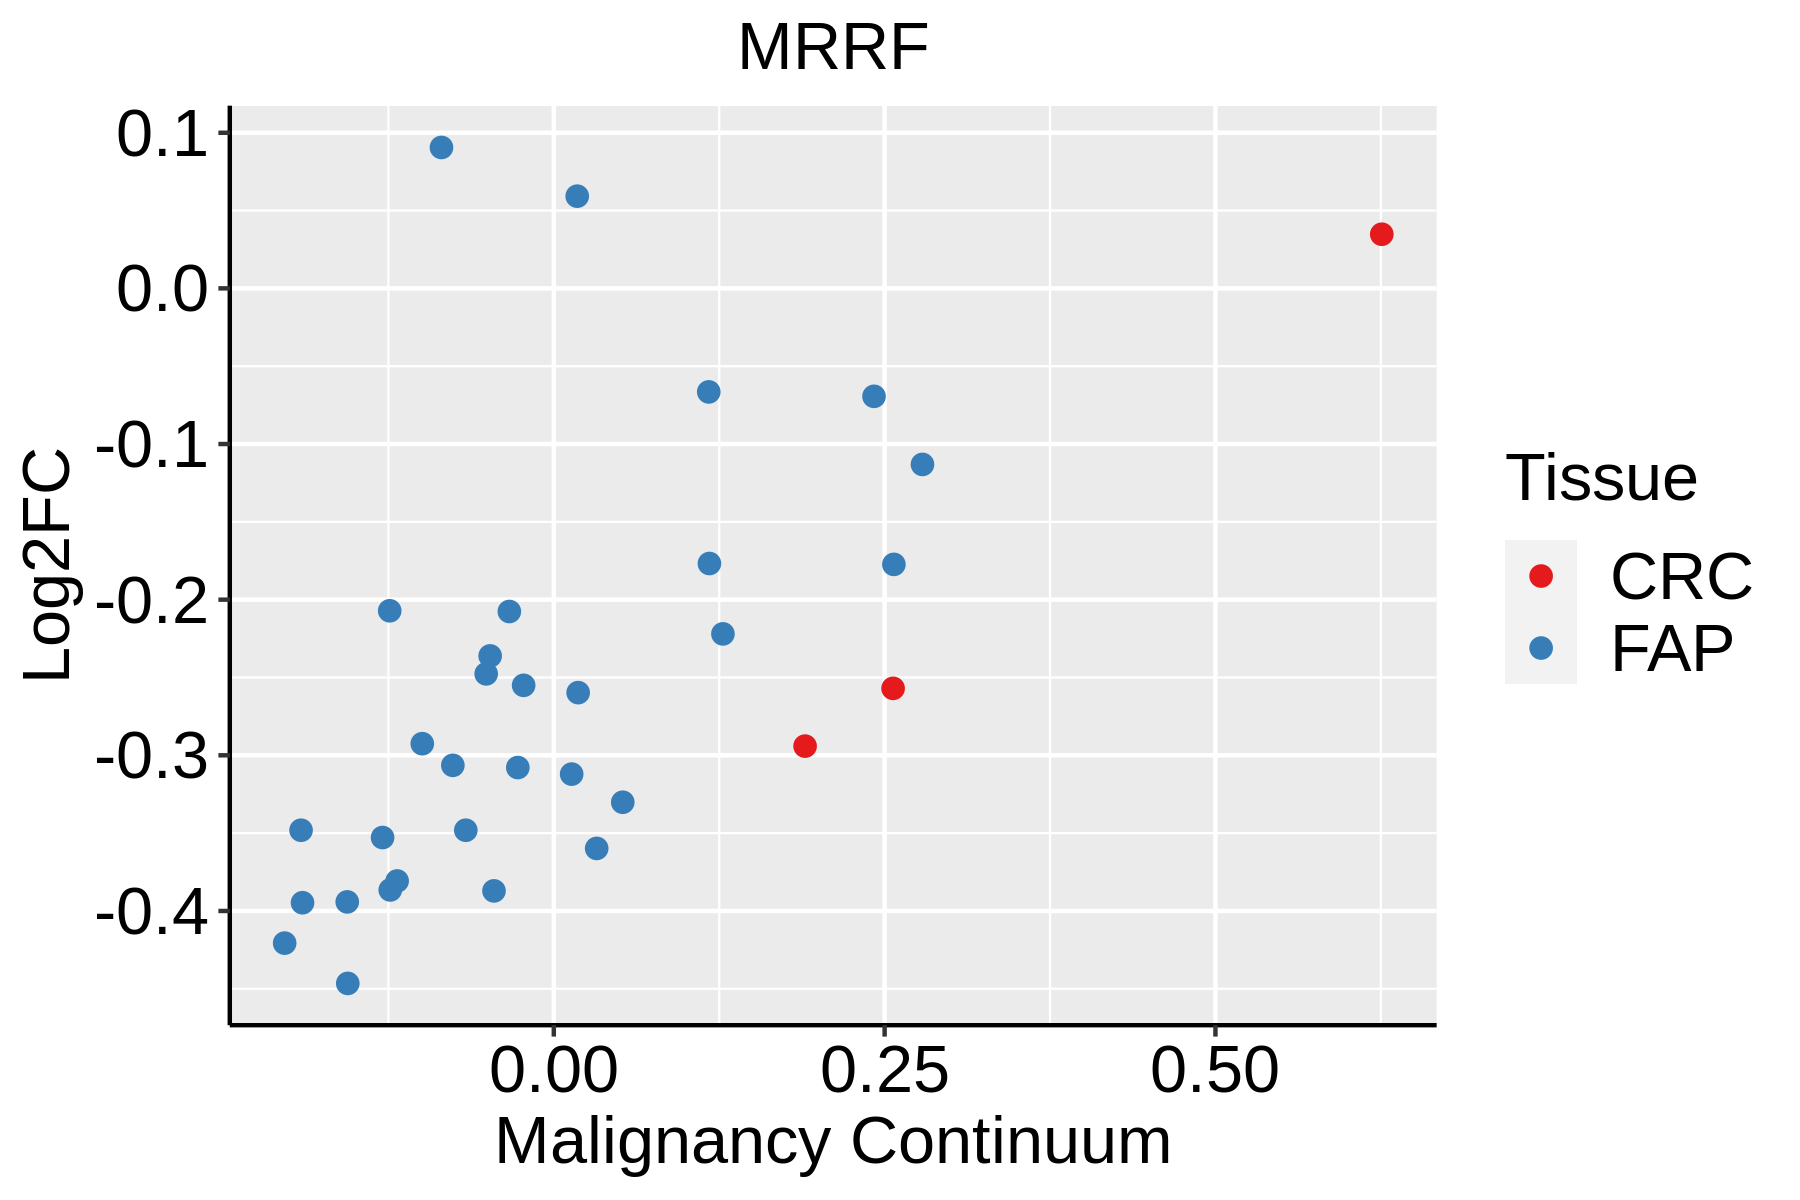 | FAP: Familial adenomatous polyposis |
| CRC: Colorectal cancer | ||
| Colorectum (HTA11) |  | AD: Adenomas |
| SER: Sessile serrated lesions | ||
| MSI-H: Microsatellite-high colorectal cancer | ||
| MSS: Microsatellite stable colorectal cancer | ||
| Esophagus |  | ESCC: Esophageal squamous cell carcinoma |
| HGIN: High-grade intraepithelial neoplasias | ||
| LGIN: Low-grade intraepithelial neoplasias | ||
| Liver | 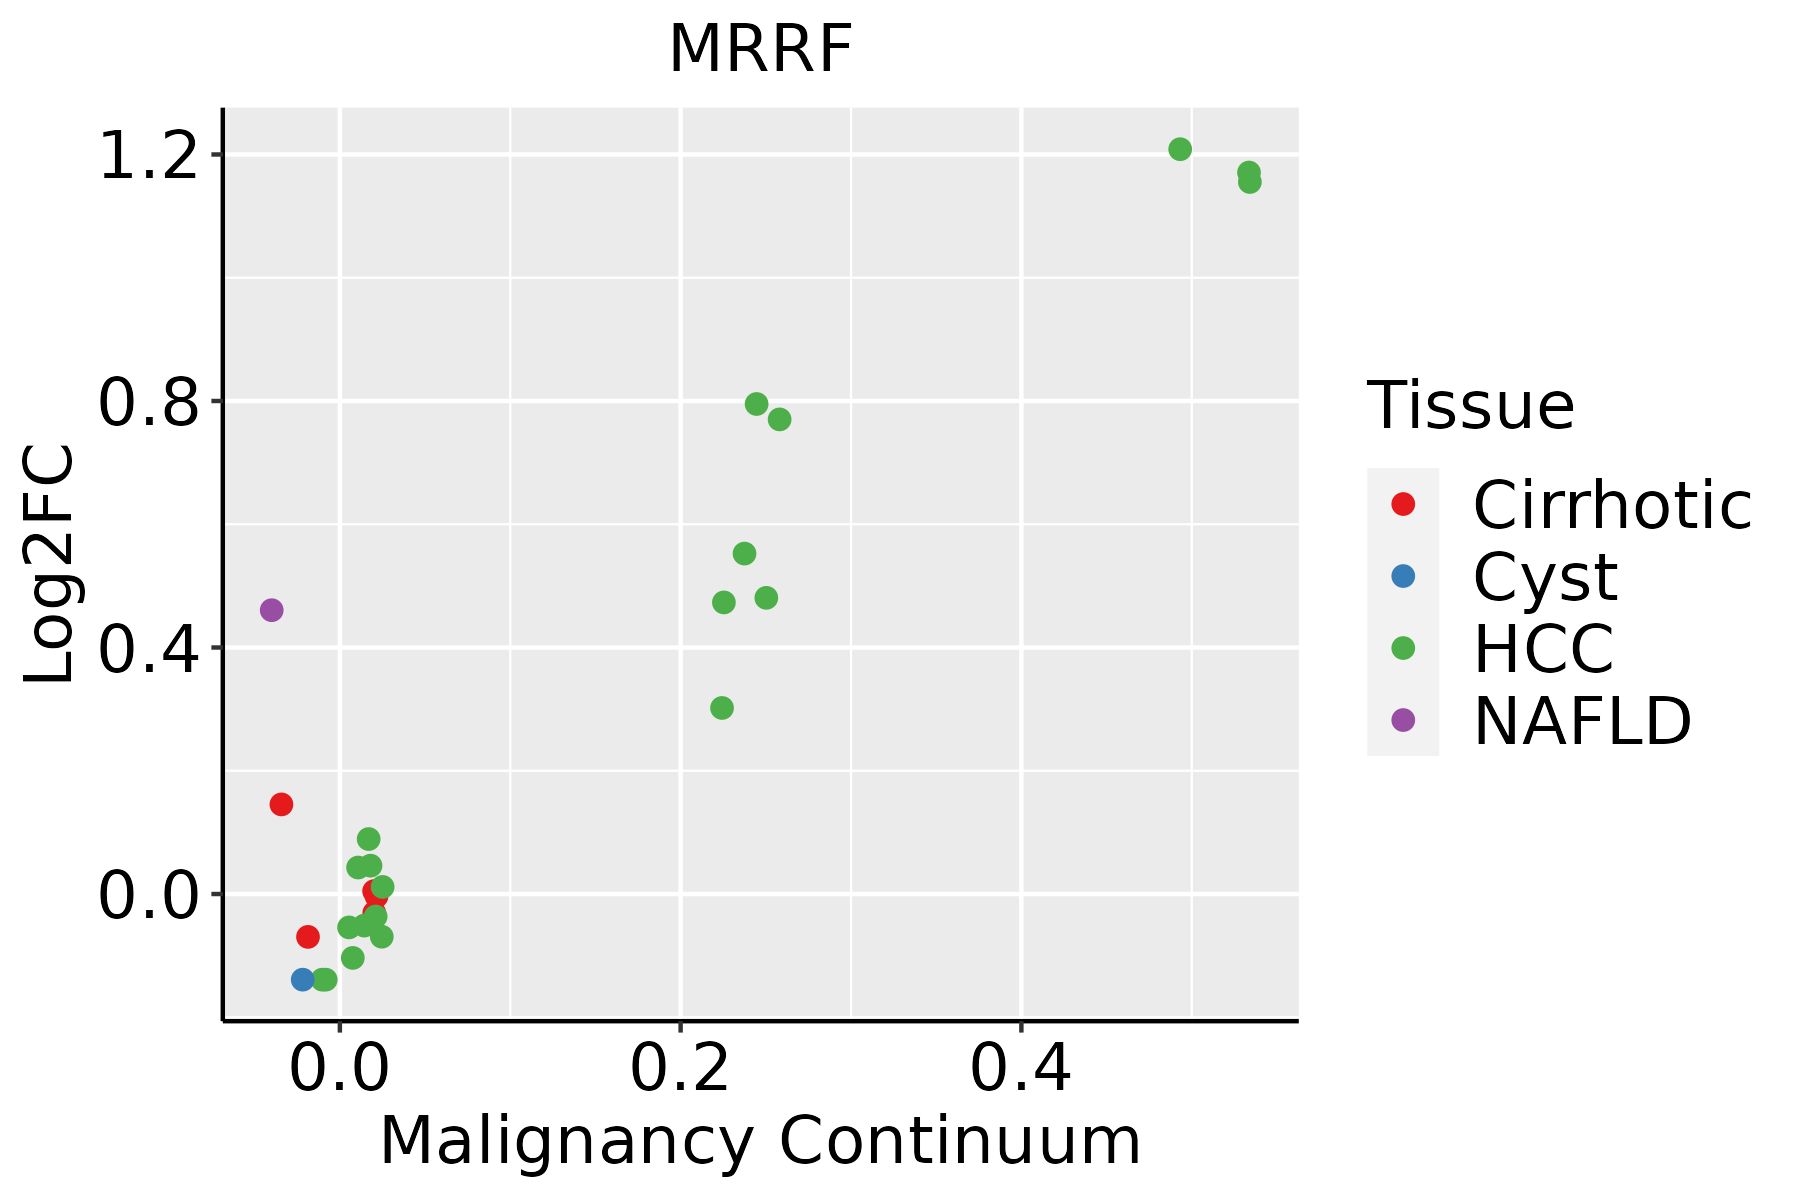 | HCC: Hepatocellular carcinoma |
| NAFLD: Non-alcoholic fatty liver disease | ||
| Oral Cavity | 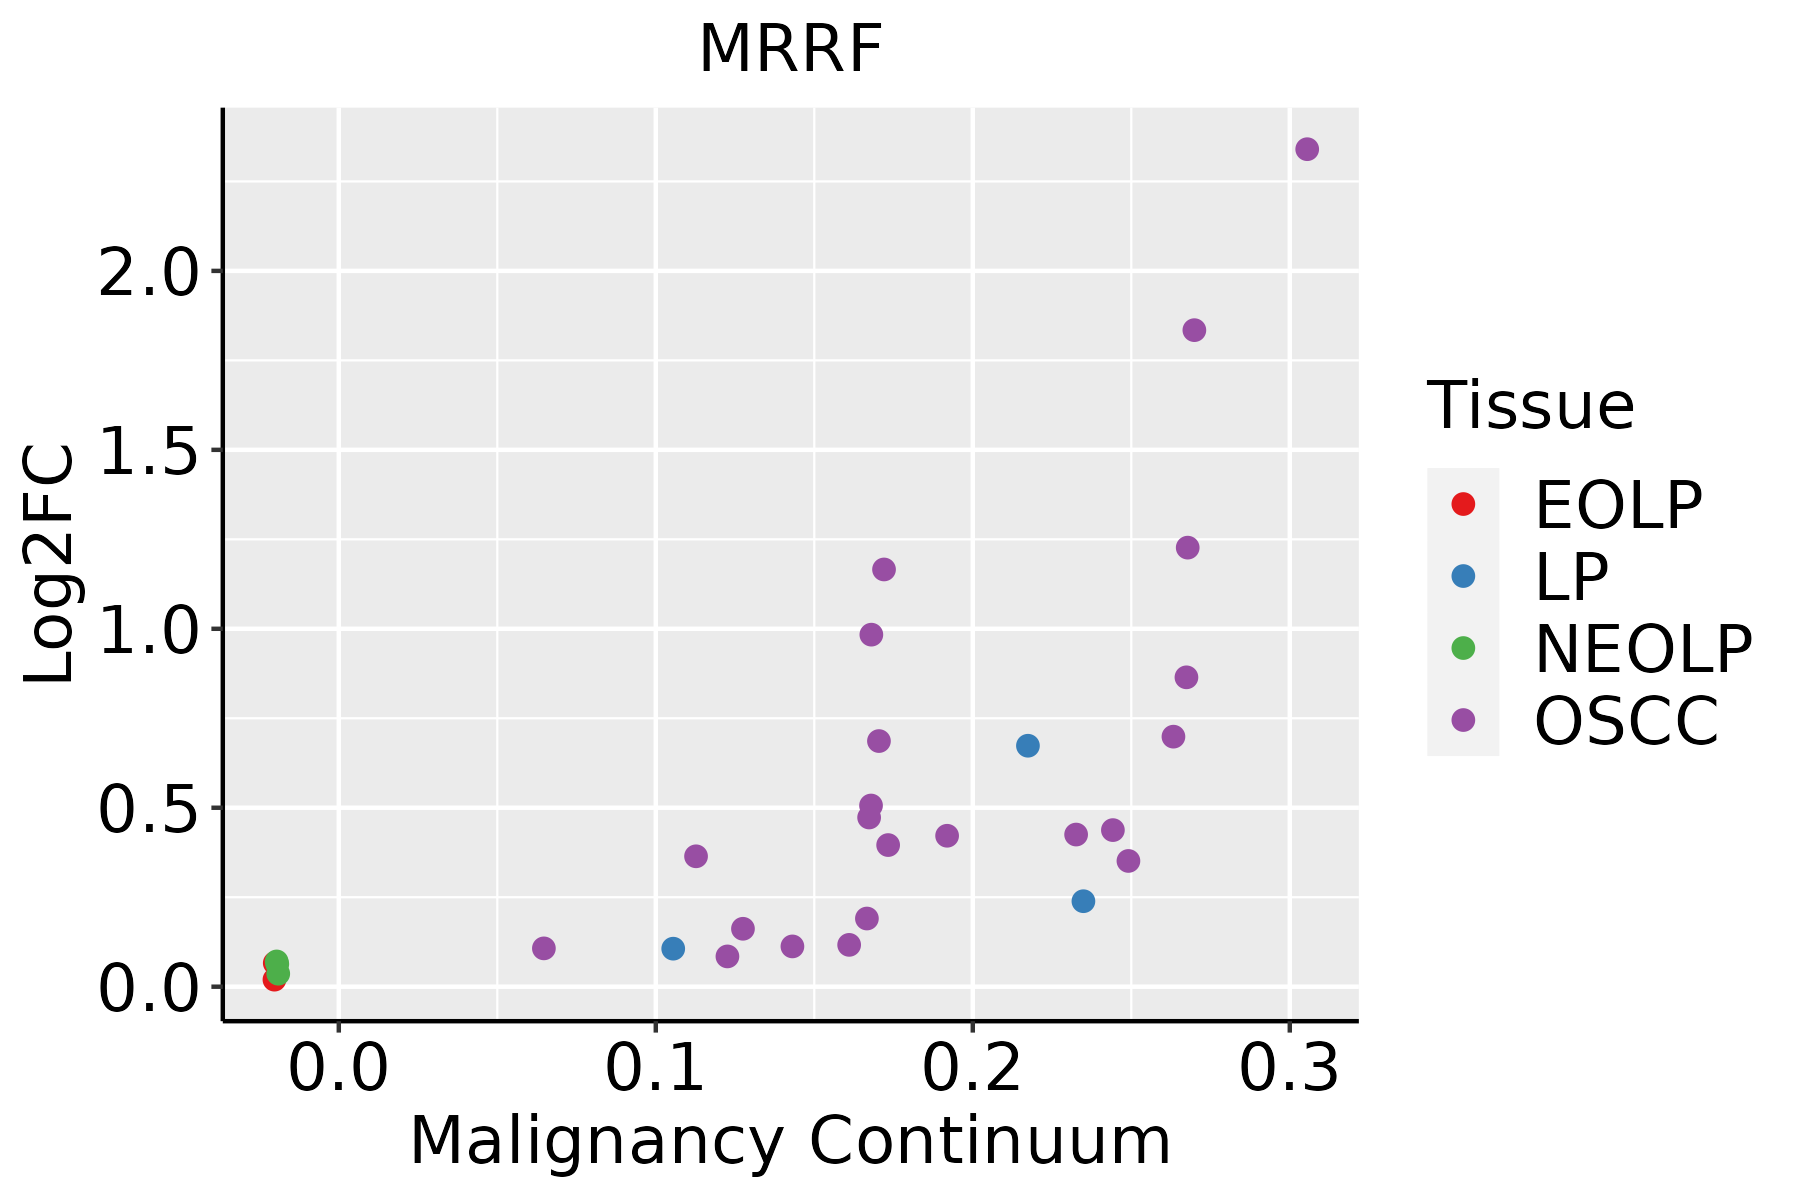 | EOLP: Erosive Oral lichen planus |
| LP: leukoplakia | ||
| NEOLP: Non-erosive oral lichen planus | ||
| OSCC: Oral squamous cell carcinoma | ||
| Skin | 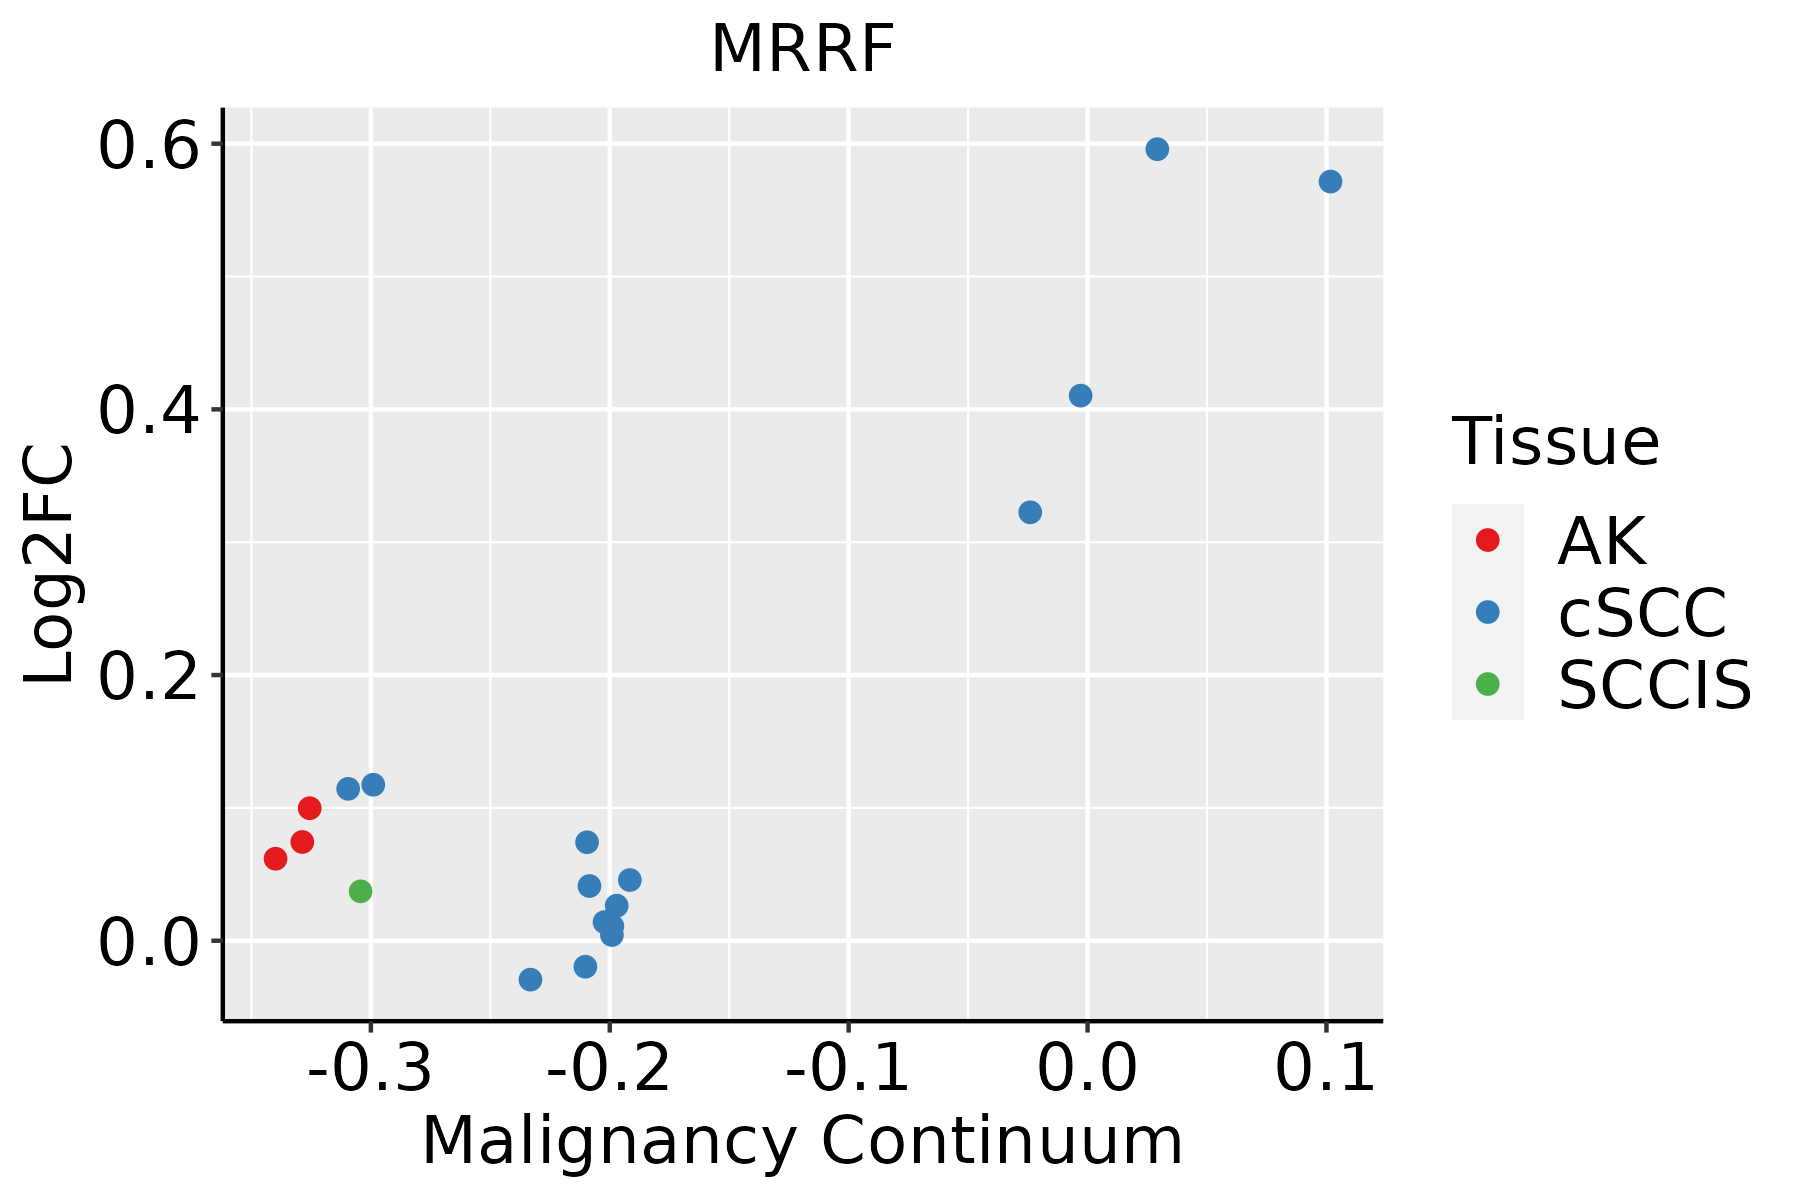 | AK: Actinic keratosis |
| cSCC: Cutaneous squamous cell carcinoma | ||
| SCCIS:squamous cell carcinoma in situ |
| ∗log2FC in expression of this searched gene in stem-like cells from each diseased tissue sample relative to stem-like cells in normal samples in each tissue plotted against the malignancy continuum. Samples are colored based on if they are from different disease stage. |
Top |
Malignant transformation related pathway analysis |
| Find out the enriched GO biological processes and KEGG pathways involved in transition from healthy to precancer to cancer |
| Tissue | Disease Stage | Enriched GO biological Processes |
| Colorectum | AD |  |
| Colorectum | SER |  |
| Colorectum | MSS |  |
| Colorectum | MSI-H |  |
| Colorectum | FAP |  |
| ∗Top 15 enriched GO BP terms are showed in the bar plot of each disease state in each tissue. Each row represents a significant GO biological process which is colored according to the -log10(p.adjust). |
| Page: 1 2 3 4 5 6 7 8 9 |
| GO ID | Tissue | Disease Stage | Description | Gene Ratio | Bg Ratio | pvalue | p.adjust | Count |
| GO:0022411 | Colorectum | AD | cellular component disassembly | 147/3918 | 443/18723 | 8.53e-10 | 6.76e-08 | 147 |
| GO:1903008 | Colorectum | AD | organelle disassembly | 46/3918 | 114/18723 | 1.81e-06 | 5.48e-05 | 46 |
| GO:00224112 | Colorectum | MSS | cellular component disassembly | 130/3467 | 443/18723 | 1.44e-08 | 8.46e-07 | 130 |
| GO:19030082 | Colorectum | MSS | organelle disassembly | 42/3467 | 114/18723 | 2.98e-06 | 8.91e-05 | 42 |
| GO:00224113 | Colorectum | MSI-H | cellular component disassembly | 47/1319 | 443/18723 | 3.26e-03 | 3.99e-02 | 47 |
| GO:00224114 | Colorectum | FAP | cellular component disassembly | 97/2622 | 443/18723 | 3.44e-06 | 1.23e-04 | 97 |
| GO:19030083 | Colorectum | FAP | organelle disassembly | 30/2622 | 114/18723 | 3.71e-04 | 4.63e-03 | 30 |
| GO:00224115 | Colorectum | CRC | cellular component disassembly | 75/2078 | 443/18723 | 1.26e-04 | 2.42e-03 | 75 |
| GO:002241120 | Esophagus | HGIN | cellular component disassembly | 102/2587 | 443/18723 | 8.31e-08 | 4.33e-06 | 102 |
| GO:19030089 | Esophagus | HGIN | organelle disassembly | 36/2587 | 114/18723 | 8.60e-07 | 3.58e-05 | 36 |
| GO:0022411111 | Esophagus | ESCC | cellular component disassembly | 305/8552 | 443/18723 | 1.94e-23 | 4.57e-21 | 305 |
| GO:190300816 | Esophagus | ESCC | organelle disassembly | 89/8552 | 114/18723 | 1.36e-12 | 5.80e-11 | 89 |
| GO:002241112 | Liver | HCC | cellular component disassembly | 282/7958 | 443/18723 | 1.02e-19 | 1.38e-17 | 282 |
| GO:190300811 | Liver | HCC | organelle disassembly | 89/7958 | 114/18723 | 8.68e-15 | 5.73e-13 | 89 |
| GO:002241119 | Oral cavity | OSCC | cellular component disassembly | 283/7305 | 443/18723 | 9.57e-27 | 3.37e-24 | 283 |
| GO:19030088 | Oral cavity | OSCC | organelle disassembly | 85/7305 | 114/18723 | 1.15e-14 | 6.93e-13 | 85 |
| GO:0022411110 | Oral cavity | LP | cellular component disassembly | 173/4623 | 443/18723 | 9.97e-12 | 7.44e-10 | 173 |
| GO:190300815 | Oral cavity | LP | organelle disassembly | 60/4623 | 114/18723 | 1.28e-10 | 7.30e-09 | 60 |
| GO:0022411112 | Skin | cSCC | cellular component disassembly | 201/4864 | 443/18723 | 4.09e-19 | 5.69e-17 | 201 |
| GO:190300817 | Skin | cSCC | organelle disassembly | 65/4864 | 114/18723 | 2.03e-12 | 1.12e-10 | 65 |
| Page: 1 |
| Pathway ID | Tissue | Disease Stage | Description | Gene Ratio | Bg Ratio | pvalue | p.adjust | qvalue | Count |
| Page: 1 |
Top |
Cell-cell communication analysis |
| Identification of potential cell-cell interactions between two cell types and their ligand-receptor pairs for different disease states |
| Ligand | Receptor | LRpair | Pathway | Tissue | Disease Stage |
| Page: 1 |
Top |
Single-cell gene regulatory network inference analysis |
| Find out the significant the regulons (TFs) and the target genes of each regulon across cell types for different disease states |
| TF | Cell Type | Tissue | Disease Stage | Target Gene | RSS | Regulon Activity |
| ∗The dot plots of a searched regulon are shown for all cell subpopulations in each disease state of each tissue based on the regulon specific score inferred using pySCENIC and by calculating the average expression. |
| Page: 1 |
Top |
Somatic mutation of malignant transformation related genes |
| Annotation of somatic variants for genes involved in malignant transformation |
| Hugo Symbol | Variant Class | Variant Classification | dbSNP RS | HGVSc | HGVSp | HGVSp Short | SWISSPROT | BIOTYPE | SIFT | PolyPhen | Tumor Sample Barcode | Tissue | Histology | Sex | Age | Stage | Therapy Types | Drugs | Outcome |
| MRRF | insertion | Frame_Shift_Ins | novel | c.85_86insAAAATATTAT | p.Val29GlufsTer11 | p.V29Efs*11 | Q96E11 | protein_coding | TCGA-A7-A26I-01 | Breast | breast invasive carcinoma | Female | >=65 | I/II | Chemotherapy | cytoxan | SD | ||
| MRRF | SNV | Missense_Mutation | rs757960281 | c.419C>T | p.Ser140Leu | p.S140L | Q96E11 | protein_coding | deleterious(0.03) | benign(0.056) | TCGA-AA-A00N-01 | Colorectum | colon adenocarcinoma | Male | >=65 | I/II | Unknown | Unknown | PD |
| MRRF | SNV | Missense_Mutation | novel | c.305A>C | p.Asn102Thr | p.N102T | Q96E11 | protein_coding | deleterious(0) | benign(0.412) | TCGA-CA-6717-01 | Colorectum | colon adenocarcinoma | Male | <65 | I/II | Chemotherapy | oxaliplatin | CR |
| MRRF | SNV | Missense_Mutation | novel | c.722N>A | p.Met241Lys | p.M241K | Q96E11 | protein_coding | deleterious(0) | probably_damaging(0.934) | TCGA-AG-3999-01 | Colorectum | rectum adenocarcinoma | Female | <65 | III/IV | Unspecific | PD | |
| MRRF | deletion | Frame_Shift_Del | rs748870392 | c.596_597delNN | p.Asn200HisfsTer32 | p.N200Hfs*32 | Q96E11 | protein_coding | TCGA-AA-3811-01 | Colorectum | colon adenocarcinoma | Female | >=65 | III/IV | Unknown | Unknown | PD | ||
| MRRF | insertion | Frame_Shift_Ins | novel | c.291_292insAATTATAAAACATTATC | p.Ala98AsnfsTer18 | p.A98Nfs*18 | Q96E11 | protein_coding | TCGA-AM-5820-01 | Colorectum | colon adenocarcinoma | Female | <65 | I/II | Unknown | Unknown | SD | ||
| MRRF | SNV | Missense_Mutation | novel | c.154N>A | p.Val52Ile | p.V52I | Q96E11 | protein_coding | tolerated(0.59) | benign(0) | TCGA-AJ-A2QO-01 | Endometrium | uterine corpus endometrioid carcinoma | Female | >=65 | I/II | Unknown | Unknown | SD |
| MRRF | SNV | Missense_Mutation | novel | c.245N>C | p.Ile82Thr | p.I82T | Q96E11 | protein_coding | deleterious(0) | possibly_damaging(0.879) | TCGA-AJ-A3EL-01 | Endometrium | uterine corpus endometrioid carcinoma | Female | <65 | I/II | Unknown | Unknown | SD |
| MRRF | SNV | Missense_Mutation | novel | c.182N>G | p.Lys61Arg | p.K61R | Q96E11 | protein_coding | deleterious(0.04) | probably_damaging(0.996) | TCGA-AX-A06F-01 | Endometrium | uterine corpus endometrioid carcinoma | Female | <65 | III/IV | Chemotherapy | carboplatin | SD |
| MRRF | SNV | Missense_Mutation | novel | c.478N>G | p.Lys160Glu | p.K160E | Q96E11 | protein_coding | tolerated(0.07) | possibly_damaging(0.559) | TCGA-AX-A1C5-01 | Endometrium | uterine corpus endometrioid carcinoma | Female | <65 | III/IV | Unspecific | Carboplatin | SD |
| Page: 1 2 3 |
Top |
Related drugs of malignant transformation related genes |
| Identification of chemicals and drugs interact with genes involved in malignant transfromation |
| (DGIdb 4.0) |
| Entrez ID | Symbol | Category | Interaction Types | Drug Claim Name | Drug Name | PMIDs |
| Page: 1 |

Copyright 2023-Present -The University of Texas Health Science Center at Houston |