
|
|||||
|
 | |
| |
| |
| |
| |
| |
|
Gene: MRPS7 |
Gene summary for MRPS7 |
| Gene information | Species | Human | Gene symbol | MRPS7 | Gene ID | 51081 |
| Gene name | mitochondrial ribosomal protein S7 | |
| Gene Alias | COXPD34 | |
| Cytomap | 17q25.1 | |
| Gene Type | protein-coding | GO ID | GO:0000028 | UniProtAcc | A0A024R8L0 |
Top |
Malignant transformation analysis |
| Identification of the aberrant gene expression in precancerous and cancerous lesions by comparing the gene expression of stem-like cells in diseased tissues with normal stem cells |
| Entrez ID | Symbol | Replicates | Species | Organ | Tissue | Adj P-value | Log2FC | Malignancy |
| 51081 | MRPS7 | LZE2T | Human | Esophagus | ESCC | 6.77e-07 | 1.24e+00 | 0.082 |
| 51081 | MRPS7 | LZE4T | Human | Esophagus | ESCC | 2.91e-21 | 6.59e-01 | 0.0811 |
| 51081 | MRPS7 | LZE5T | Human | Esophagus | ESCC | 4.60e-03 | 4.17e-01 | 0.0514 |
| 51081 | MRPS7 | LZE7T | Human | Esophagus | ESCC | 9.82e-16 | 9.26e-01 | 0.0667 |
| 51081 | MRPS7 | LZE8T | Human | Esophagus | ESCC | 1.02e-20 | 7.70e-01 | 0.067 |
| 51081 | MRPS7 | LZE20T | Human | Esophagus | ESCC | 2.37e-09 | 4.40e-01 | 0.0662 |
| 51081 | MRPS7 | LZE22D1 | Human | Esophagus | HGIN | 1.38e-09 | 3.28e-01 | 0.0595 |
| 51081 | MRPS7 | LZE22T | Human | Esophagus | ESCC | 2.18e-08 | 7.10e-01 | 0.068 |
| 51081 | MRPS7 | LZE24T | Human | Esophagus | ESCC | 2.24e-40 | 1.21e+00 | 0.0596 |
| 51081 | MRPS7 | LZE22D3 | Human | Esophagus | HGIN | 1.05e-03 | 7.48e-01 | 0.0653 |
| 51081 | MRPS7 | LZE21T | Human | Esophagus | ESCC | 2.16e-09 | 8.69e-01 | 0.0655 |
| 51081 | MRPS7 | LZE6T | Human | Esophagus | ESCC | 3.32e-11 | 8.46e-01 | 0.0845 |
| 51081 | MRPS7 | P1T-E | Human | Esophagus | ESCC | 2.35e-15 | 7.76e-01 | 0.0875 |
| 51081 | MRPS7 | P2T-E | Human | Esophagus | ESCC | 7.22e-71 | 1.17e+00 | 0.1177 |
| 51081 | MRPS7 | P4T-E | Human | Esophagus | ESCC | 2.69e-46 | 1.15e+00 | 0.1323 |
| 51081 | MRPS7 | P5T-E | Human | Esophagus | ESCC | 1.75e-41 | 8.40e-01 | 0.1327 |
| 51081 | MRPS7 | P8T-E | Human | Esophagus | ESCC | 2.13e-44 | 1.01e+00 | 0.0889 |
| 51081 | MRPS7 | P9T-E | Human | Esophagus | ESCC | 1.92e-41 | 1.00e+00 | 0.1131 |
| 51081 | MRPS7 | P10T-E | Human | Esophagus | ESCC | 1.04e-66 | 1.24e+00 | 0.116 |
| 51081 | MRPS7 | P11T-E | Human | Esophagus | ESCC | 2.26e-32 | 1.45e+00 | 0.1426 |
| Page: 1 2 3 4 5 6 7 |
| Tissue | Expression Dynamics | Abbreviation |
| Esophagus | 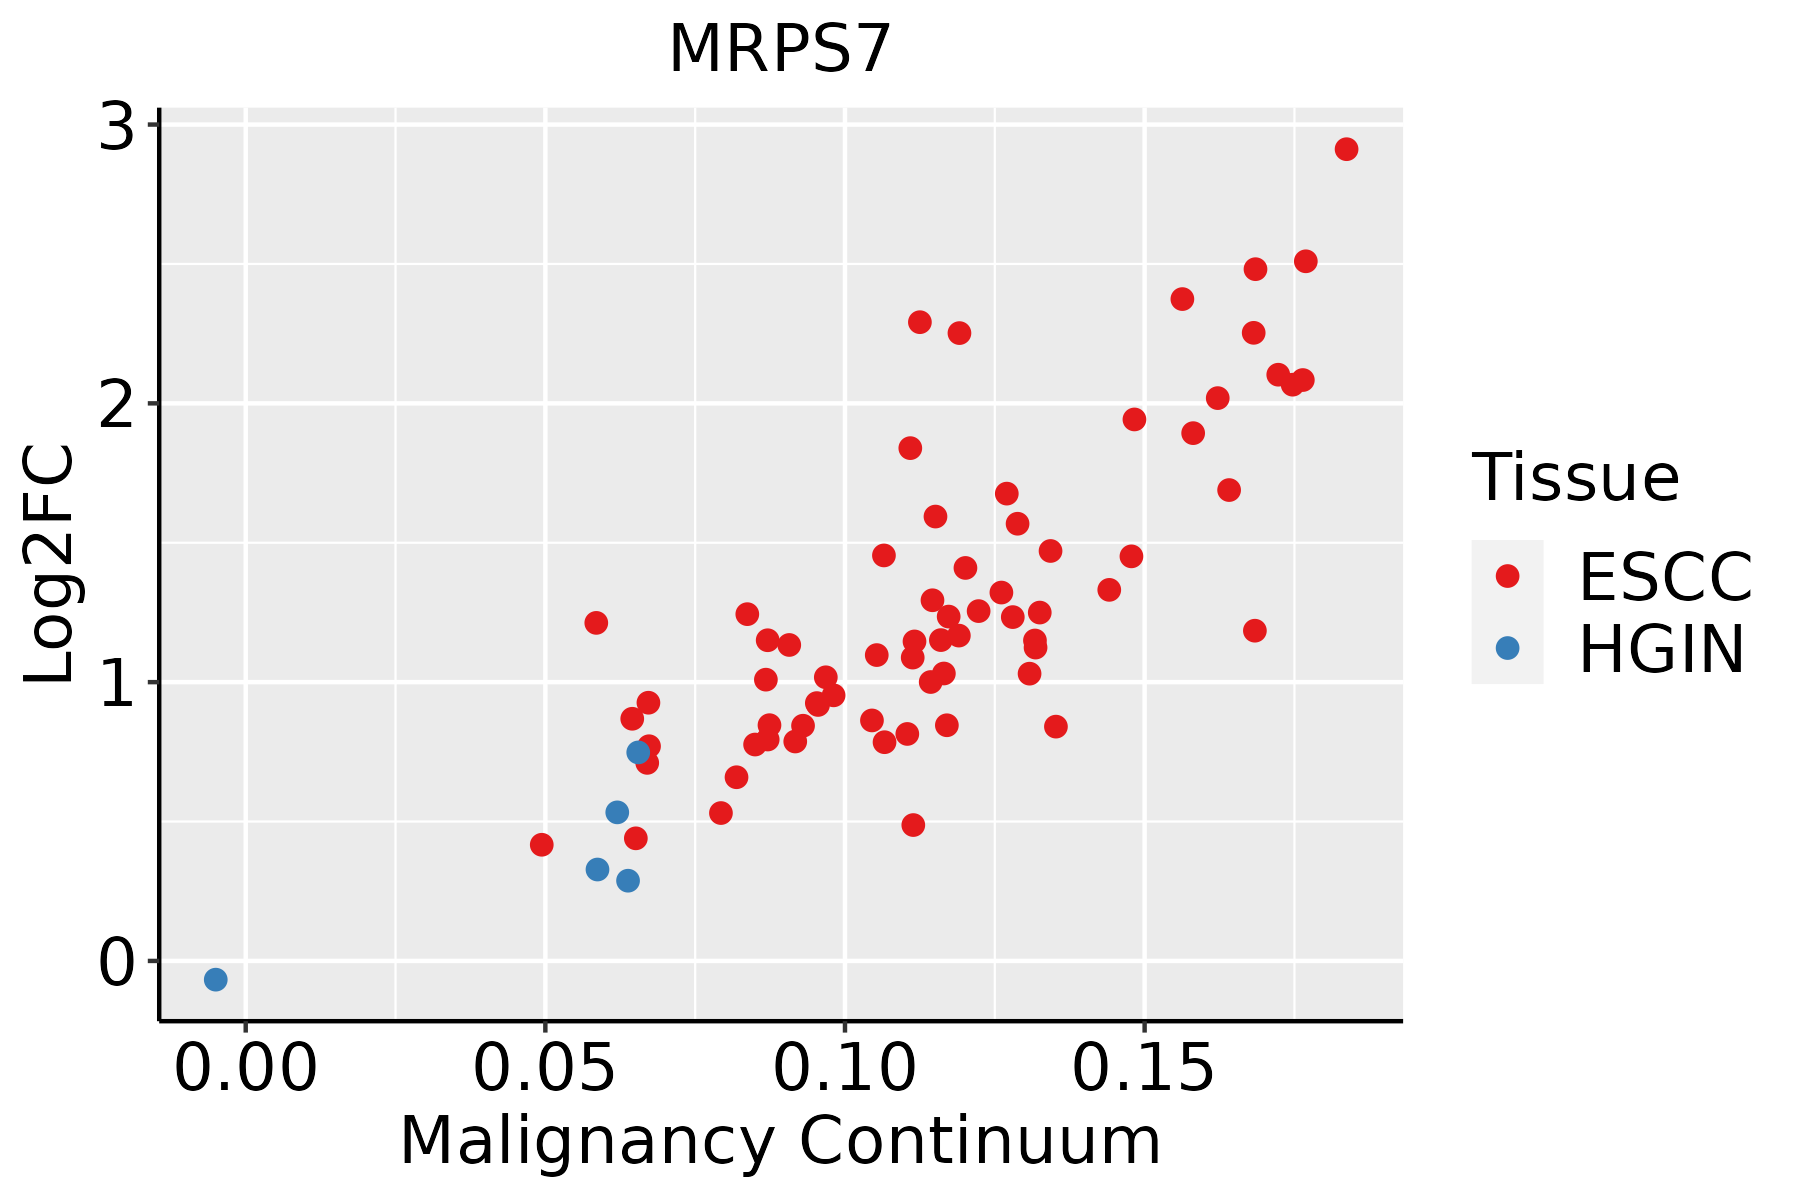 | ESCC: Esophageal squamous cell carcinoma |
| HGIN: High-grade intraepithelial neoplasias | ||
| LGIN: Low-grade intraepithelial neoplasias | ||
| Liver | 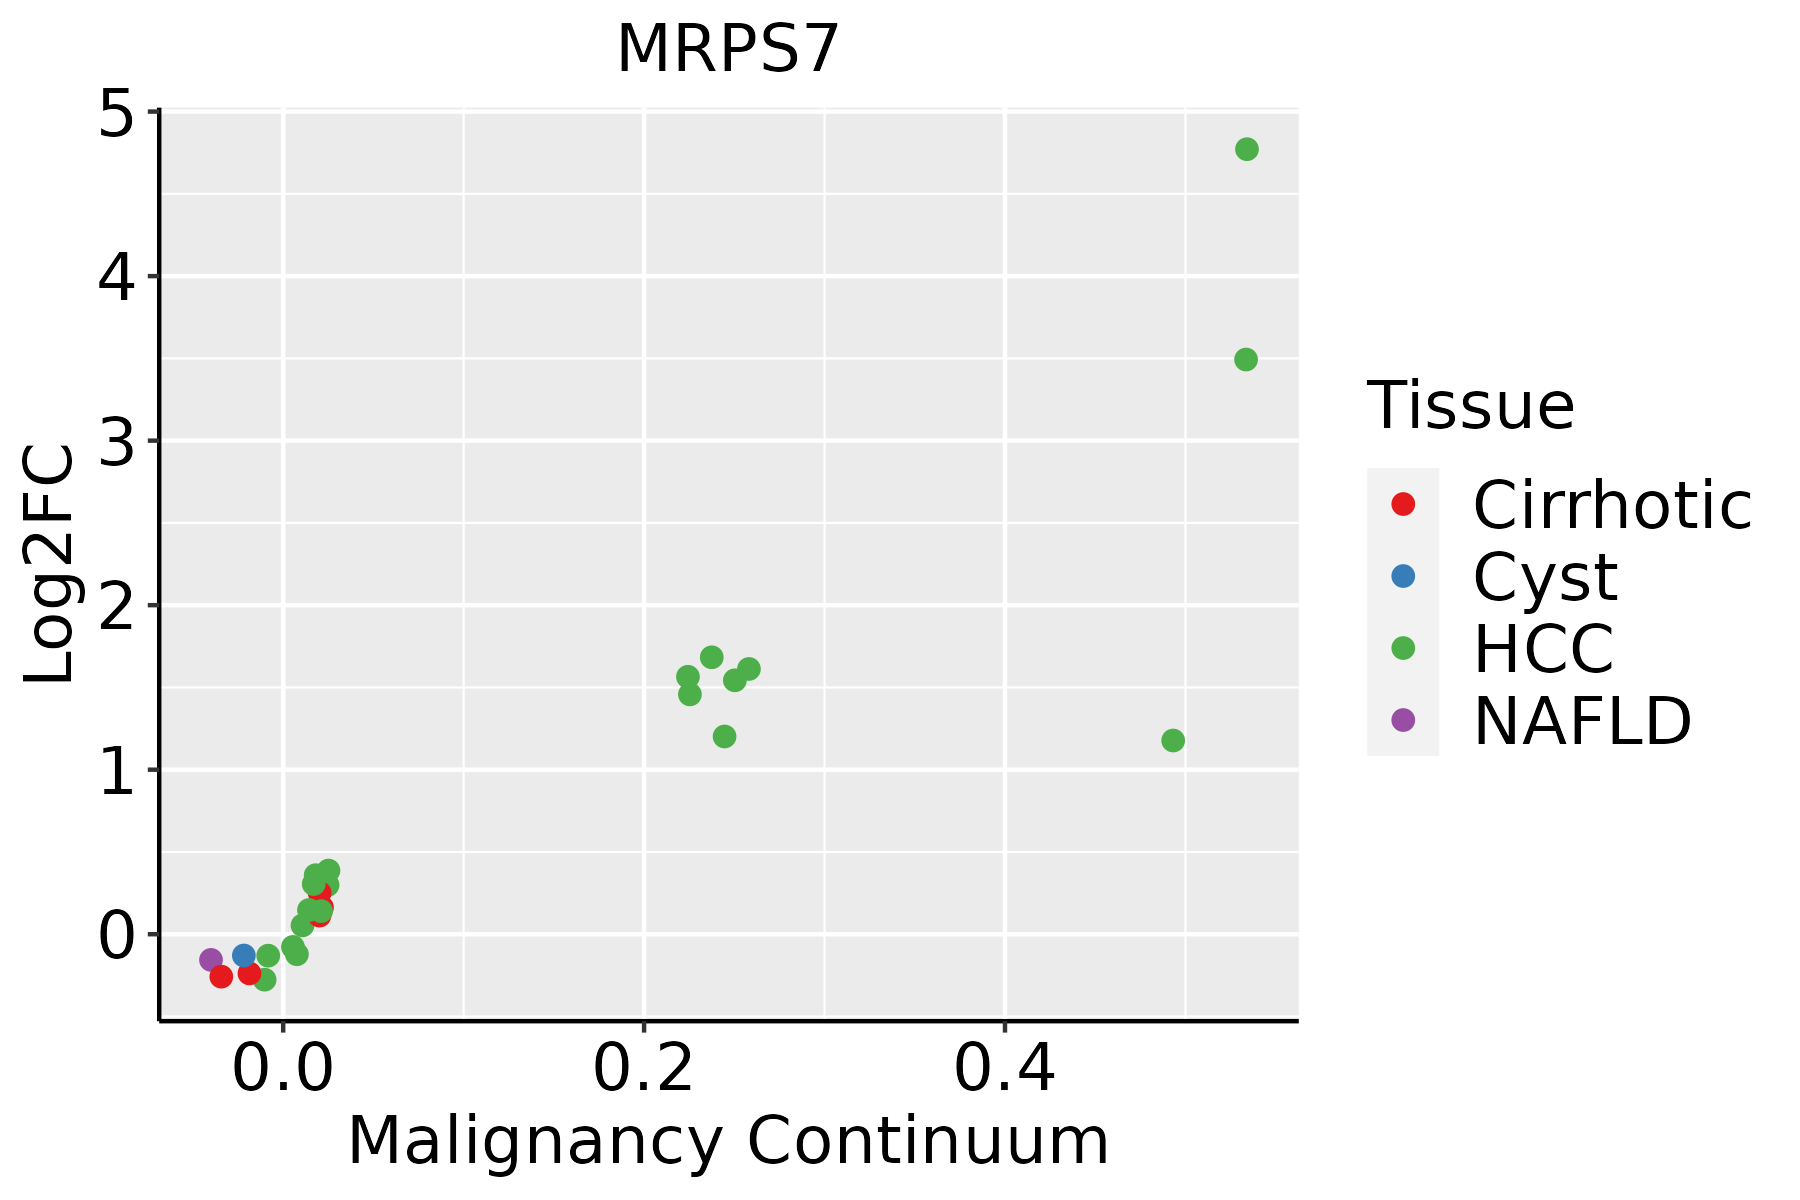 | HCC: Hepatocellular carcinoma |
| NAFLD: Non-alcoholic fatty liver disease | ||
| Oral Cavity | 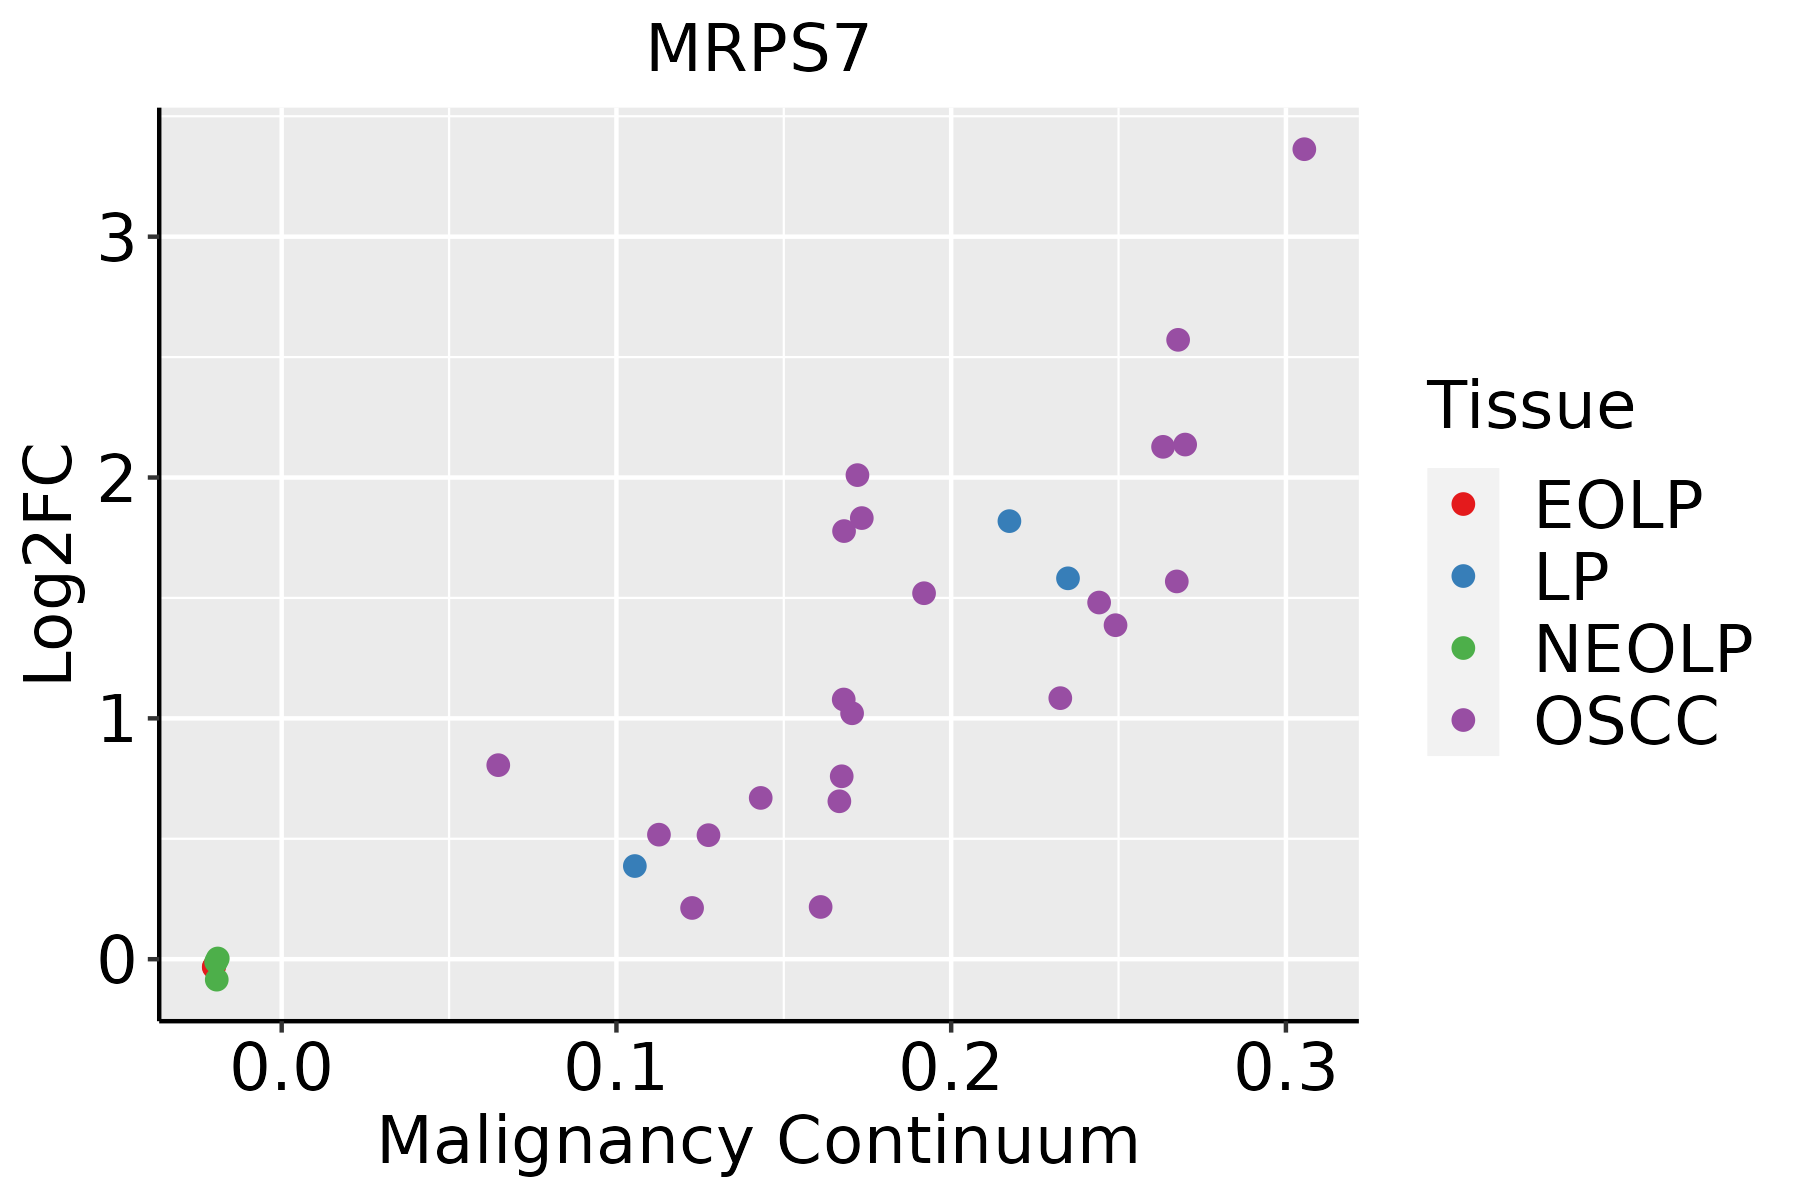 | EOLP: Erosive Oral lichen planus |
| LP: leukoplakia | ||
| NEOLP: Non-erosive oral lichen planus | ||
| OSCC: Oral squamous cell carcinoma | ||
| Prostate |  | BPH: Benign Prostatic Hyperplasia |
| Skin | 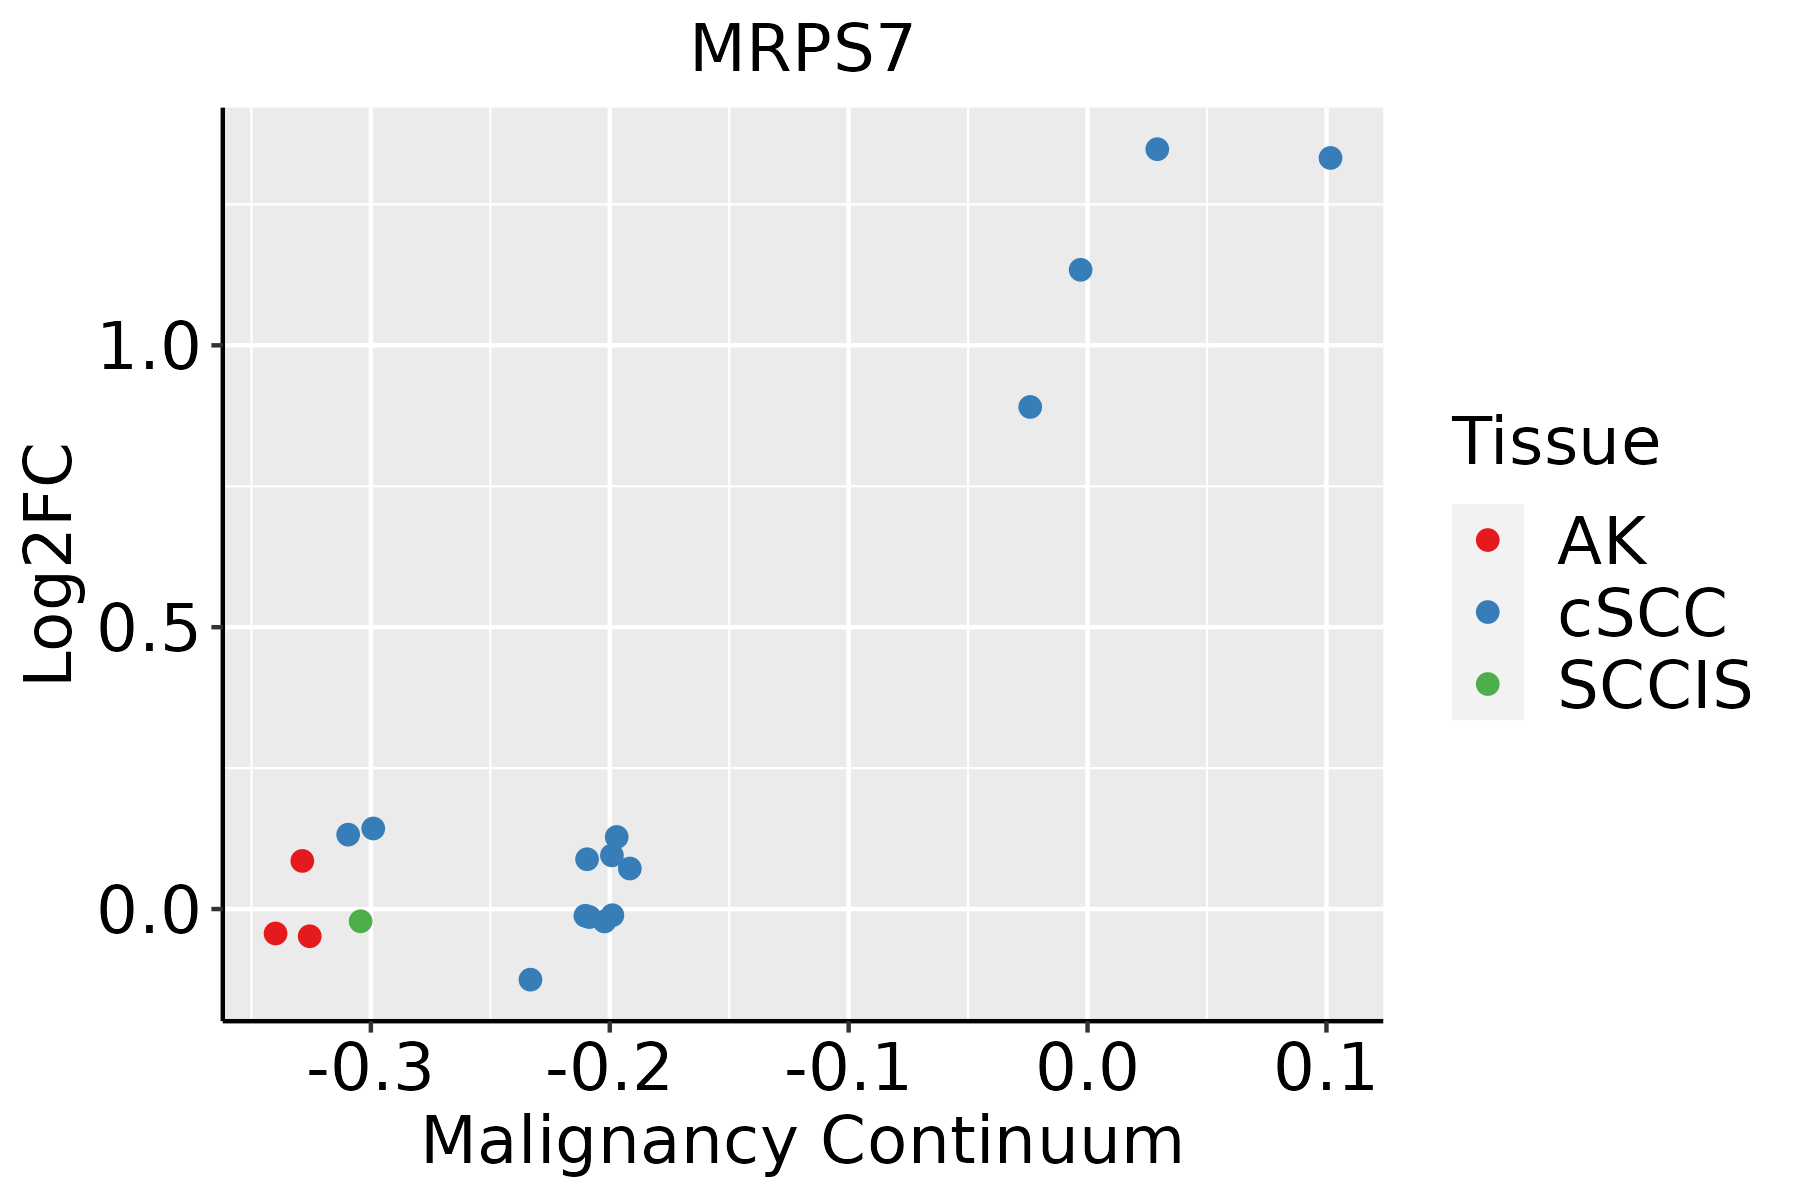 | AK: Actinic keratosis |
| cSCC: Cutaneous squamous cell carcinoma | ||
| SCCIS:squamous cell carcinoma in situ | ||
| Thyroid |  | ATC: Anaplastic thyroid cancer |
| HT: Hashimoto's thyroiditis | ||
| PTC: Papillary thyroid cancer |
| ∗log2FC in expression of this searched gene in stem-like cells from each diseased tissue sample relative to stem-like cells in normal samples in each tissue plotted against the malignancy continuum. Samples are colored based on if they are from different disease stage. |
Top |
Malignant transformation related pathway analysis |
| Find out the enriched GO biological processes and KEGG pathways involved in transition from healthy to precancer to cancer |
| Tissue | Disease Stage | Enriched GO biological Processes |
| Colorectum | AD |  |
| Colorectum | SER |  |
| Colorectum | MSS |  |
| Colorectum | MSI-H |  |
| Colorectum | FAP |  |
| ∗Top 15 enriched GO BP terms are showed in the bar plot of each disease state in each tissue. Each row represents a significant GO biological process which is colored according to the -log10(p.adjust). |
| Page: 1 2 3 4 5 6 7 8 9 |
| GO ID | Tissue | Disease Stage | Description | Gene Ratio | Bg Ratio | pvalue | p.adjust | Count |
| GO:002261327 | Esophagus | HGIN | ribonucleoprotein complex biogenesis | 158/2587 | 463/18723 | 2.61e-29 | 5.23e-26 | 158 |
| GO:004225426 | Esophagus | HGIN | ribosome biogenesis | 101/2587 | 299/18723 | 8.74e-19 | 4.03e-16 | 101 |
| GO:007182627 | Esophagus | HGIN | ribonucleoprotein complex subunit organization | 84/2587 | 227/18723 | 1.34e-18 | 5.37e-16 | 84 |
| GO:002261827 | Esophagus | HGIN | ribonucleoprotein complex assembly | 82/2587 | 220/18723 | 2.07e-18 | 7.36e-16 | 82 |
| GO:004225527 | Esophagus | HGIN | ribosome assembly | 28/2587 | 61/18723 | 1.36e-09 | 1.07e-07 | 28 |
| GO:004227427 | Esophagus | HGIN | ribosomal small subunit biogenesis | 27/2587 | 73/18723 | 6.26e-07 | 2.72e-05 | 27 |
| GO:000002827 | Esophagus | HGIN | ribosomal small subunit assembly | 11/2587 | 19/18723 | 8.87e-06 | 2.64e-04 | 11 |
| GO:00325435 | Esophagus | HGIN | mitochondrial translation | 23/2587 | 76/18723 | 1.61e-04 | 3.16e-03 | 23 |
| GO:01400534 | Esophagus | HGIN | mitochondrial gene expression | 27/2587 | 108/18723 | 1.34e-03 | 1.57e-02 | 27 |
| GO:0022613111 | Esophagus | ESCC | ribonucleoprotein complex biogenesis | 365/8552 | 463/18723 | 1.74e-49 | 1.11e-45 | 365 |
| GO:0042254111 | Esophagus | ESCC | ribosome biogenesis | 252/8552 | 299/18723 | 3.27e-44 | 1.04e-40 | 252 |
| GO:014005313 | Esophagus | ESCC | mitochondrial gene expression | 93/8552 | 108/18723 | 1.96e-18 | 2.03e-16 | 93 |
| GO:0071826111 | Esophagus | ESCC | ribonucleoprotein complex subunit organization | 166/8552 | 227/18723 | 2.94e-17 | 2.42e-15 | 166 |
| GO:0042274111 | Esophagus | ESCC | ribosomal small subunit biogenesis | 67/8552 | 73/18723 | 6.62e-17 | 5.38e-15 | 67 |
| GO:0022618111 | Esophagus | ESCC | ribonucleoprotein complex assembly | 159/8552 | 220/18723 | 8.19e-16 | 5.71e-14 | 159 |
| GO:003254314 | Esophagus | ESCC | mitochondrial translation | 68/8552 | 76/18723 | 1.02e-15 | 6.86e-14 | 68 |
| GO:0042255111 | Esophagus | ESCC | ribosome assembly | 50/8552 | 61/18723 | 5.66e-09 | 1.17e-07 | 50 |
| GO:0000028111 | Esophagus | ESCC | ribosomal small subunit assembly | 16/8552 | 19/18723 | 6.45e-04 | 3.43e-03 | 16 |
| GO:002261312 | Liver | Cirrhotic | ribonucleoprotein complex biogenesis | 231/4634 | 463/18723 | 3.28e-32 | 6.86e-29 | 231 |
| GO:004225412 | Liver | Cirrhotic | ribosome biogenesis | 154/4634 | 299/18723 | 1.18e-23 | 6.72e-21 | 154 |
| Page: 1 2 3 4 5 |
| Pathway ID | Tissue | Disease Stage | Description | Gene Ratio | Bg Ratio | pvalue | p.adjust | qvalue | Count |
| hsa0301039 | Esophagus | HGIN | Ribosome | 108/1383 | 167/8465 | 1.44e-45 | 4.71e-43 | 3.74e-43 | 108 |
| hsa03010115 | Esophagus | HGIN | Ribosome | 108/1383 | 167/8465 | 1.44e-45 | 4.71e-43 | 3.74e-43 | 108 |
| hsa03010211 | Esophagus | ESCC | Ribosome | 129/4205 | 167/8465 | 1.43e-13 | 3.43e-12 | 1.75e-12 | 129 |
| hsa03010310 | Esophagus | ESCC | Ribosome | 129/4205 | 167/8465 | 1.43e-13 | 3.43e-12 | 1.75e-12 | 129 |
| hsa0301022 | Liver | Cirrhotic | Ribosome | 127/2530 | 167/8465 | 2.12e-35 | 7.06e-33 | 4.35e-33 | 127 |
| hsa0301032 | Liver | Cirrhotic | Ribosome | 127/2530 | 167/8465 | 2.12e-35 | 7.06e-33 | 4.35e-33 | 127 |
| hsa0301042 | Liver | HCC | Ribosome | 128/4020 | 167/8465 | 7.32e-15 | 2.23e-13 | 1.24e-13 | 128 |
| hsa0301052 | Liver | HCC | Ribosome | 128/4020 | 167/8465 | 7.32e-15 | 2.23e-13 | 1.24e-13 | 128 |
| hsa0301030 | Oral cavity | OSCC | Ribosome | 128/3704 | 167/8465 | 2.42e-18 | 1.62e-16 | 8.25e-17 | 128 |
| hsa03010114 | Oral cavity | OSCC | Ribosome | 128/3704 | 167/8465 | 2.42e-18 | 1.62e-16 | 8.25e-17 | 128 |
| hsa03010210 | Oral cavity | LP | Ribosome | 127/2418 | 167/8465 | 1.22e-37 | 4.05e-35 | 2.61e-35 | 127 |
| hsa0301038 | Oral cavity | LP | Ribosome | 127/2418 | 167/8465 | 1.22e-37 | 4.05e-35 | 2.61e-35 | 127 |
| hsa0301029 | Prostate | Tumor | Ribosome | 104/1791 | 167/8465 | 3.53e-31 | 5.84e-29 | 3.62e-29 | 104 |
| hsa0301037 | Prostate | Tumor | Ribosome | 104/1791 | 167/8465 | 3.53e-31 | 5.84e-29 | 3.62e-29 | 104 |
| Page: 1 |
Top |
Cell-cell communication analysis |
| Identification of potential cell-cell interactions between two cell types and their ligand-receptor pairs for different disease states |
| Ligand | Receptor | LRpair | Pathway | Tissue | Disease Stage |
| Page: 1 |
Top |
Single-cell gene regulatory network inference analysis |
| Find out the significant the regulons (TFs) and the target genes of each regulon across cell types for different disease states |
| TF | Cell Type | Tissue | Disease Stage | Target Gene | RSS | Regulon Activity |
| ∗The dot plots of a searched regulon are shown for all cell subpopulations in each disease state of each tissue based on the regulon specific score inferred using pySCENIC and by calculating the average expression. |
| Page: 1 |
Top |
Somatic mutation of malignant transformation related genes |
| Annotation of somatic variants for genes involved in malignant transformation |
| Hugo Symbol | Variant Class | Variant Classification | dbSNP RS | HGVSc | HGVSp | HGVSp Short | SWISSPROT | BIOTYPE | SIFT | PolyPhen | Tumor Sample Barcode | Tissue | Histology | Sex | Age | Stage | Therapy Types | Drugs | Outcome |
| MRPS7 | SNV | Missense_Mutation | rs373944549 | c.655G>A | p.Val219Met | p.V219M | Q9Y2R9 | protein_coding | tolerated(0.06) | possibly_damaging(0.882) | TCGA-AN-A0AJ-01 | Breast | breast invasive carcinoma | Female | >=65 | I/II | Unknown | Unknown | SD |
| MRPS7 | SNV | Missense_Mutation | c.568N>C | p.Glu190Gln | p.E190Q | Q9Y2R9 | protein_coding | tolerated(0.06) | probably_damaging(0.996) | TCGA-B6-A0I2-01 | Breast | breast invasive carcinoma | Female | <65 | I/II | Unknown | Unknown | SD | |
| MRPS7 | deletion | Frame_Shift_Del | novel | c.170delN | p.Glu57GlyfsTer2 | p.E57Gfs*2 | Q9Y2R9 | protein_coding | TCGA-AO-A0JB-01 | Breast | breast invasive carcinoma | Female | <65 | III/IV | Chemotherapy | cyclophosphamide | SD | ||
| MRPS7 | insertion | In_Frame_Ins | novel | c.171_172insACTACCTCTCGC | p.Glu57_Leu58insThrThrSerArg | p.E57_L58insTTSR | Q9Y2R9 | protein_coding | TCGA-AO-A0JB-01 | Breast | breast invasive carcinoma | Female | <65 | III/IV | Chemotherapy | cyclophosphamide | SD | ||
| MRPS7 | SNV | Missense_Mutation | novel | c.333N>A | p.Met111Ile | p.M111I | Q9Y2R9 | protein_coding | tolerated(0.32) | benign(0.009) | TCGA-VS-A958-01 | Cervix | cervical & endocervical cancer | Female | <65 | I/II | Chemotherapy | cisplatin | CR |
| MRPS7 | SNV | Missense_Mutation | c.191A>G | p.Tyr64Cys | p.Y64C | Q9Y2R9 | protein_coding | tolerated(0.17) | possibly_damaging(0.502) | TCGA-AA-3663-01 | Colorectum | colon adenocarcinoma | Male | <65 | I/II | Unknown | Unknown | SD | |
| MRPS7 | SNV | Missense_Mutation | novel | c.243N>C | p.Lys81Asn | p.K81N | Q9Y2R9 | protein_coding | tolerated(0.49) | benign(0.006) | TCGA-AZ-4315-01 | Colorectum | colon adenocarcinoma | Male | <65 | I/II | Unknown | Unknown | SD |
| MRPS7 | SNV | Missense_Mutation | c.403G>A | p.Ala135Thr | p.A135T | Q9Y2R9 | protein_coding | tolerated(0.16) | possibly_damaging(0.524) | TCGA-D5-6930-01 | Colorectum | colon adenocarcinoma | Male | >=65 | I/II | Unknown | Unknown | SD | |
| MRPS7 | insertion | In_Frame_Ins | novel | c.481_482insGGC | p.Ile161delinsArgLeu | p.I161delinsRL | Q9Y2R9 | protein_coding | TCGA-AM-5820-01 | Colorectum | colon adenocarcinoma | Female | <65 | I/II | Unknown | Unknown | SD | ||
| MRPS7 | insertion | Frame_Shift_Ins | novel | c.484dupC | p.Leu162ProfsTer29 | p.L162Pfs*29 | Q9Y2R9 | protein_coding | TCGA-AM-5820-01 | Colorectum | colon adenocarcinoma | Female | <65 | I/II | Unknown | Unknown | SD |
| Page: 1 2 3 |
Top |
Related drugs of malignant transformation related genes |
| Identification of chemicals and drugs interact with genes involved in malignant transfromation |
| (DGIdb 4.0) |
| Entrez ID | Symbol | Category | Interaction Types | Drug Claim Name | Drug Name | PMIDs |
| Page: 1 |

Copyright 2023-Present -The University of Texas Health Science Center at Houston |