
|
|||||
|
 | |
| |
| |
| |
| |
| |
|
Gene: MRPS6 |
Gene summary for MRPS6 |
| Gene information | Species | Human | Gene symbol | MRPS6 | Gene ID | 64968 |
| Gene name | mitochondrial ribosomal protein S6 | |
| Gene Alias | C21orf101 | |
| Cytomap | 21q22.11 | |
| Gene Type | protein-coding | GO ID | GO:0006412 | UniProtAcc | P82932 |
Top |
Malignant transformation analysis |
| Identification of the aberrant gene expression in precancerous and cancerous lesions by comparing the gene expression of stem-like cells in diseased tissues with normal stem cells |
| Entrez ID | Symbol | Replicates | Species | Organ | Tissue | Adj P-value | Log2FC | Malignancy |
| 64968 | MRPS6 | AEH-subject1 | Human | Endometrium | AEH | 8.42e-16 | -5.10e-01 | -0.3059 |
| 64968 | MRPS6 | AEH-subject2 | Human | Endometrium | AEH | 1.65e-19 | -5.76e-01 | -0.2525 |
| 64968 | MRPS6 | AEH-subject3 | Human | Endometrium | AEH | 1.41e-22 | -5.62e-01 | -0.2576 |
| 64968 | MRPS6 | AEH-subject4 | Human | Endometrium | AEH | 3.15e-07 | -2.98e-01 | -0.2657 |
| 64968 | MRPS6 | AEH-subject5 | Human | Endometrium | AEH | 1.36e-14 | -5.04e-01 | -0.2953 |
| 64968 | MRPS6 | EEC-subject1 | Human | Endometrium | EEC | 2.12e-04 | -2.53e-01 | -0.2682 |
| 64968 | MRPS6 | EEC-subject2 | Human | Endometrium | EEC | 9.26e-28 | -6.19e-01 | -0.2607 |
| 64968 | MRPS6 | EEC-subject3 | Human | Endometrium | EEC | 3.90e-32 | -5.50e-01 | -0.2525 |
| 64968 | MRPS6 | EEC-subject4 | Human | Endometrium | EEC | 7.79e-13 | -4.44e-01 | -0.2571 |
| 64968 | MRPS6 | EEC-subject5 | Human | Endometrium | EEC | 2.17e-05 | -2.62e-01 | -0.249 |
| 64968 | MRPS6 | GSM5276934 | Human | Endometrium | EEC | 6.59e-14 | -4.38e-01 | -0.0913 |
| 64968 | MRPS6 | GSM5276935 | Human | Endometrium | EEC | 8.01e-06 | -3.50e-01 | -0.123 |
| 64968 | MRPS6 | GSM6177620_NYU_UCEC1_lib1_lib1 | Human | Endometrium | EEC | 4.10e-25 | -6.06e-01 | -0.1869 |
| 64968 | MRPS6 | GSM6177620_NYU_UCEC1_lib2_lib2 | Human | Endometrium | EEC | 6.49e-27 | -6.13e-01 | -0.1875 |
| 64968 | MRPS6 | GSM6177620_NYU_UCEC1_lib3_lib3 | Human | Endometrium | EEC | 3.80e-35 | -5.25e-01 | -0.1883 |
| 64968 | MRPS6 | GSM6177621_NYU_UCEC2_lib1_lib1 | Human | Endometrium | EEC | 2.99e-32 | -5.64e-01 | -0.1934 |
| 64968 | MRPS6 | GSM6177622_NYU_UCEC3_lib1_lib1 | Human | Endometrium | EEC | 1.15e-40 | -4.98e-01 | -0.1917 |
| 64968 | MRPS6 | GSM6177622_NYU_UCEC3_lib2_lib2 | Human | Endometrium | EEC | 4.98e-40 | -5.42e-01 | -0.1916 |
| 64968 | MRPS6 | GSM6177623_NYU_UCEC3_Vis | Human | Endometrium | EEC | 1.72e-05 | -2.89e-01 | -0.1269 |
| 64968 | MRPS6 | LZE4T | Human | Esophagus | ESCC | 2.40e-13 | 2.19e-01 | 0.0811 |
| Page: 1 2 3 4 5 6 7 8 9 |
| Tissue | Expression Dynamics | Abbreviation |
| Endometrium |  | AEH: Atypical endometrial hyperplasia |
| EEC: Endometrioid Cancer | ||
| Esophagus |  | ESCC: Esophageal squamous cell carcinoma |
| HGIN: High-grade intraepithelial neoplasias | ||
| LGIN: Low-grade intraepithelial neoplasias | ||
| Liver |  | HCC: Hepatocellular carcinoma |
| NAFLD: Non-alcoholic fatty liver disease | ||
| Oral Cavity | 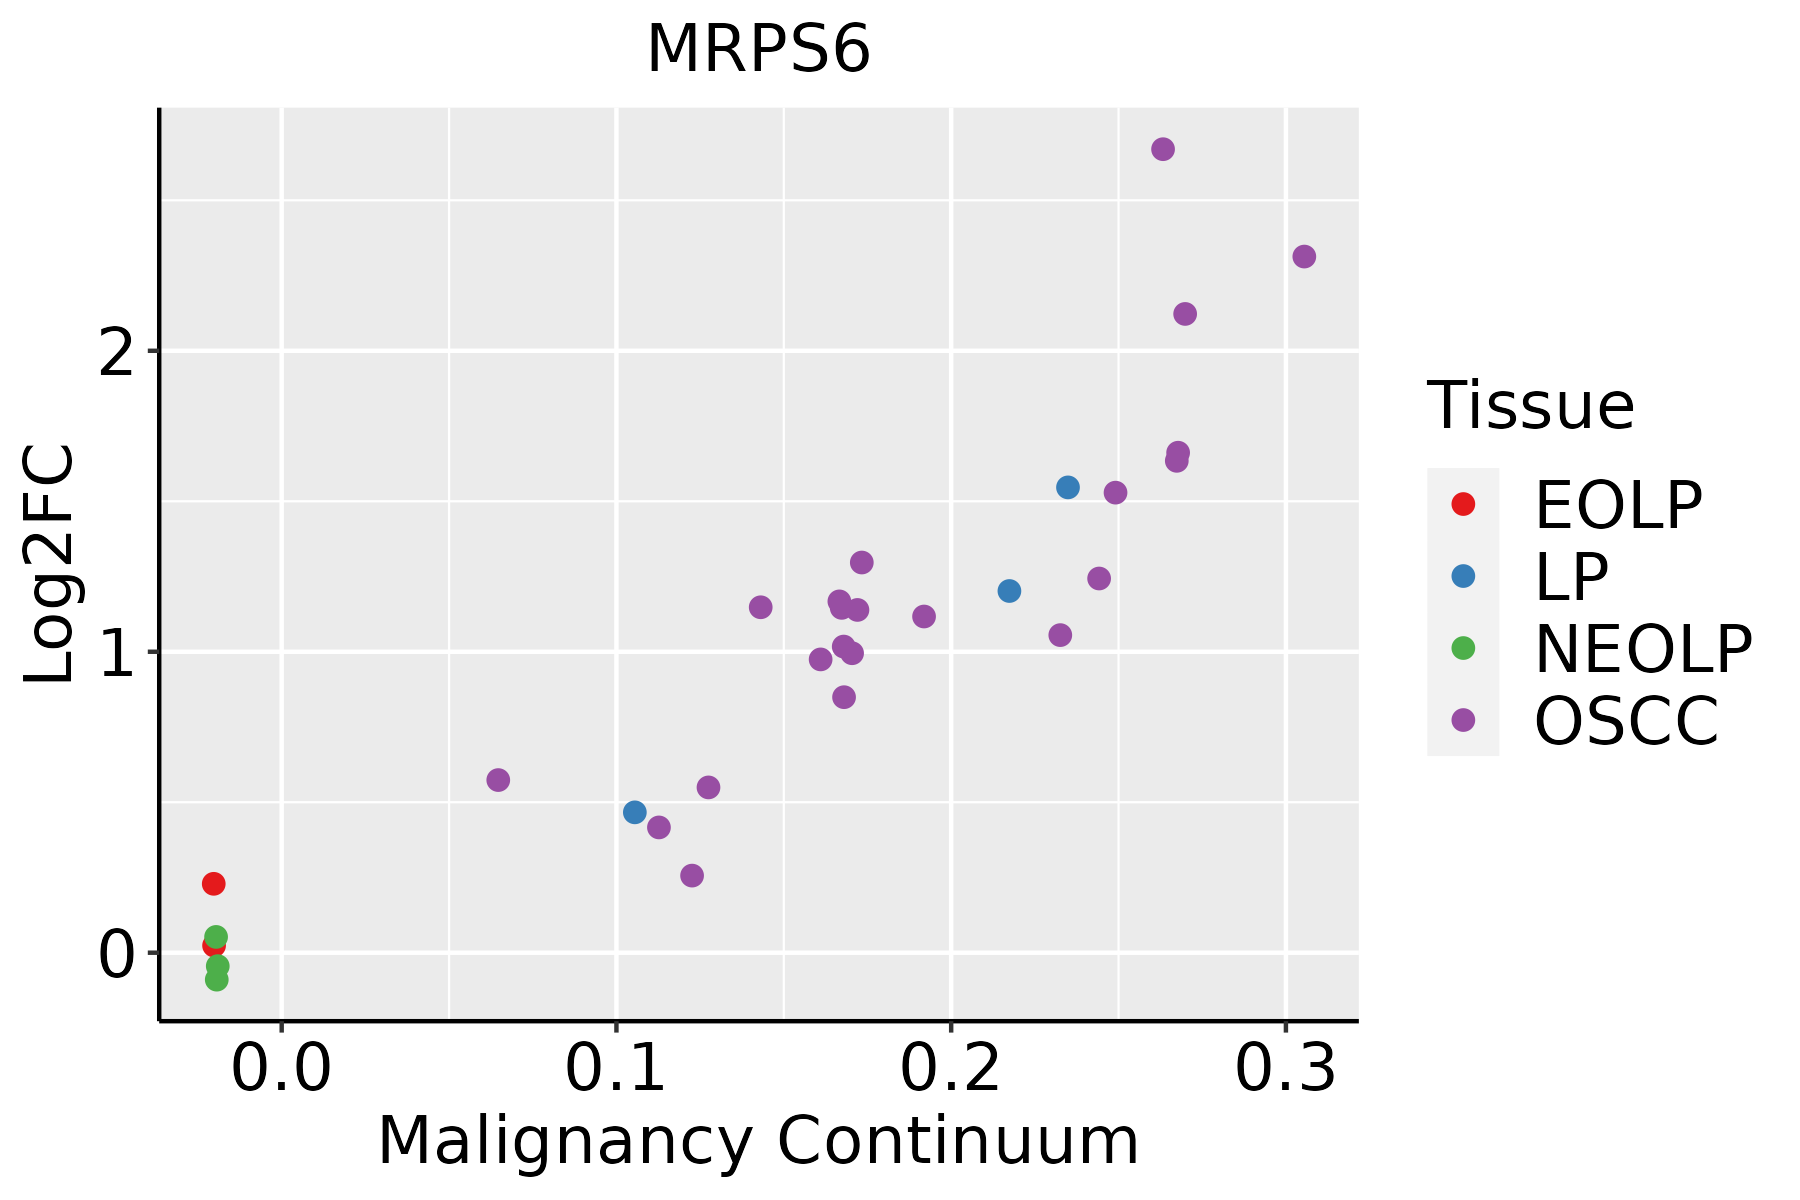 | EOLP: Erosive Oral lichen planus |
| LP: leukoplakia | ||
| NEOLP: Non-erosive oral lichen planus | ||
| OSCC: Oral squamous cell carcinoma | ||
| Prostate |  | BPH: Benign Prostatic Hyperplasia |
| Skin | 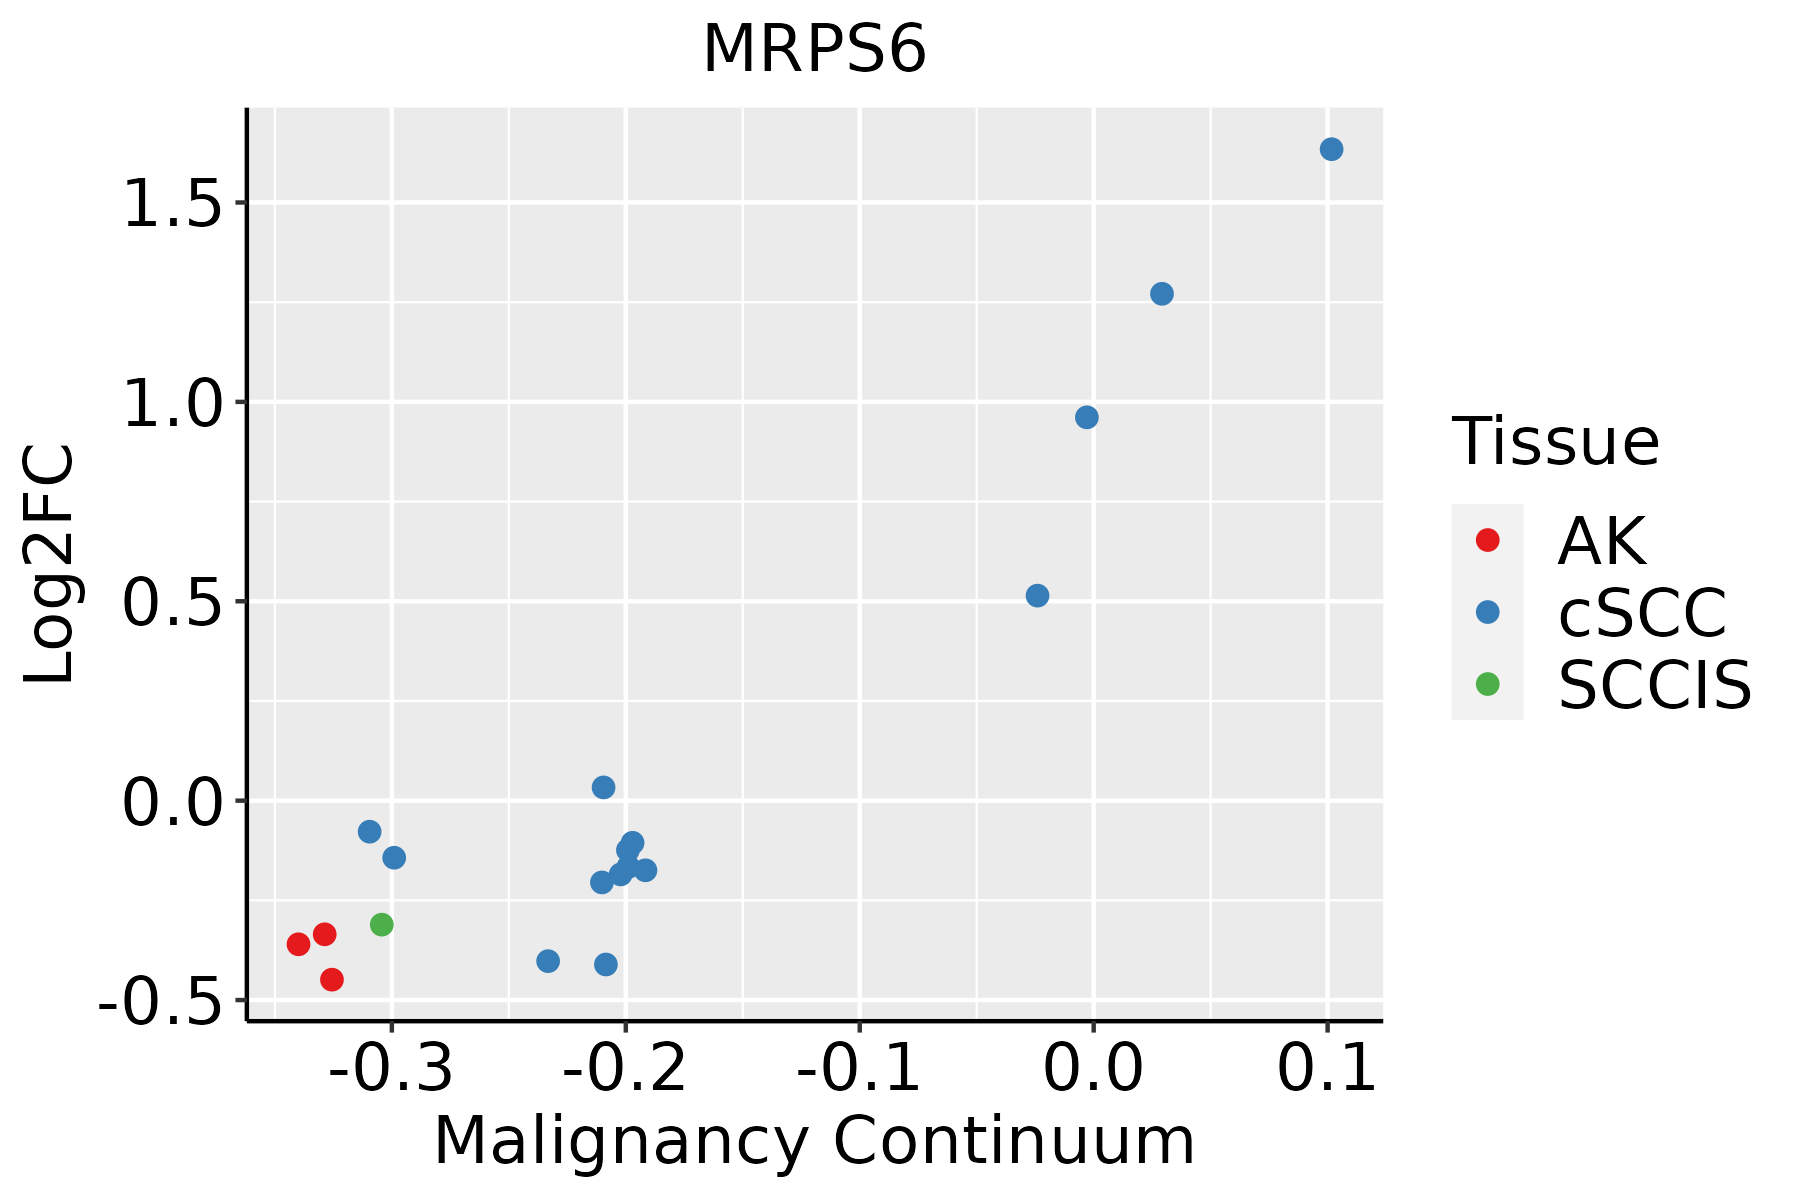 | AK: Actinic keratosis |
| cSCC: Cutaneous squamous cell carcinoma | ||
| SCCIS:squamous cell carcinoma in situ | ||
| Thyroid |  | ATC: Anaplastic thyroid cancer |
| HT: Hashimoto's thyroiditis | ||
| PTC: Papillary thyroid cancer |
| ∗log2FC in expression of this searched gene in stem-like cells from each diseased tissue sample relative to stem-like cells in normal samples in each tissue plotted against the malignancy continuum. Samples are colored based on if they are from different disease stage. |
Top |
Malignant transformation related pathway analysis |
| Find out the enriched GO biological processes and KEGG pathways involved in transition from healthy to precancer to cancer |
| Tissue | Disease Stage | Enriched GO biological Processes |
| Colorectum | AD |  |
| Colorectum | SER |  |
| Colorectum | MSS |  |
| Colorectum | MSI-H |  |
| Colorectum | FAP |  |
| ∗Top 15 enriched GO BP terms are showed in the bar plot of each disease state in each tissue. Each row represents a significant GO biological process which is colored according to the -log10(p.adjust). |
| Page: 1 2 3 4 5 6 7 8 9 |
| GO ID | Tissue | Disease Stage | Description | Gene Ratio | Bg Ratio | pvalue | p.adjust | Count |
| GO:014005313 | Esophagus | ESCC | mitochondrial gene expression | 93/8552 | 108/18723 | 1.96e-18 | 2.03e-16 | 93 |
| GO:003254314 | Esophagus | ESCC | mitochondrial translation | 68/8552 | 76/18723 | 1.02e-15 | 6.86e-14 | 68 |
| GO:0032543 | Liver | Cirrhotic | mitochondrial translation | 40/4634 | 76/18723 | 1.61e-07 | 4.29e-06 | 40 |
| GO:0140053 | Liver | Cirrhotic | mitochondrial gene expression | 49/4634 | 108/18723 | 2.35e-06 | 4.31e-05 | 49 |
| GO:01400531 | Liver | HCC | mitochondrial gene expression | 82/7958 | 108/18723 | 1.49e-12 | 7.20e-11 | 82 |
| GO:00325431 | Liver | HCC | mitochondrial translation | 62/7958 | 76/18723 | 2.95e-12 | 1.34e-10 | 62 |
| GO:01400533 | Oral cavity | OSCC | mitochondrial gene expression | 78/7305 | 108/18723 | 2.37e-12 | 9.86e-11 | 78 |
| GO:00325434 | Oral cavity | OSCC | mitochondrial translation | 59/7305 | 76/18723 | 7.21e-12 | 2.70e-10 | 59 |
| GO:003254313 | Oral cavity | LP | mitochondrial translation | 43/4623 | 76/18723 | 2.85e-09 | 1.26e-07 | 43 |
| GO:014005312 | Oral cavity | LP | mitochondrial gene expression | 53/4623 | 108/18723 | 3.54e-08 | 1.27e-06 | 53 |
| GO:00325433 | Prostate | BPH | mitochondrial translation | 23/3107 | 76/18723 | 2.21e-03 | 1.22e-02 | 23 |
| GO:01400532 | Prostate | BPH | mitochondrial gene expression | 29/3107 | 108/18723 | 4.68e-03 | 2.25e-02 | 29 |
| GO:003254312 | Prostate | Tumor | mitochondrial translation | 24/3246 | 76/18723 | 1.73e-03 | 1.03e-02 | 24 |
| GO:014005311 | Prostate | Tumor | mitochondrial gene expression | 31/3246 | 108/18723 | 2.31e-03 | 1.30e-02 | 31 |
| GO:00325436 | Skin | cSCC | mitochondrial translation | 47/4864 | 76/18723 | 4.70e-11 | 2.22e-09 | 47 |
| GO:01400535 | Skin | cSCC | mitochondrial gene expression | 56/4864 | 108/18723 | 8.06e-09 | 2.56e-07 | 56 |
| GO:01400536 | Thyroid | PTC | mitochondrial gene expression | 51/5968 | 108/18723 | 6.04e-04 | 3.83e-03 | 51 |
| GO:00325437 | Thyroid | PTC | mitochondrial translation | 38/5968 | 76/18723 | 7.52e-04 | 4.67e-03 | 38 |
| GO:014005314 | Thyroid | ATC | mitochondrial gene expression | 51/6293 | 108/18723 | 2.26e-03 | 1.06e-02 | 51 |
| GO:003254315 | Thyroid | ATC | mitochondrial translation | 38/6293 | 76/18723 | 2.26e-03 | 1.06e-02 | 38 |
| Page: 1 |
| Pathway ID | Tissue | Disease Stage | Description | Gene Ratio | Bg Ratio | pvalue | p.adjust | qvalue | Count |
| hsa0301026 | Endometrium | AEH | Ribosome | 89/1197 | 167/8465 | 1.88e-33 | 6.09e-31 | 4.46e-31 | 89 |
| hsa03010112 | Endometrium | AEH | Ribosome | 89/1197 | 167/8465 | 1.88e-33 | 6.09e-31 | 4.46e-31 | 89 |
| hsa0301027 | Endometrium | EEC | Ribosome | 89/1237 | 167/8465 | 2.55e-32 | 8.39e-30 | 6.26e-30 | 89 |
| hsa0301036 | Endometrium | EEC | Ribosome | 89/1237 | 167/8465 | 2.55e-32 | 8.39e-30 | 6.26e-30 | 89 |
| hsa03010211 | Esophagus | ESCC | Ribosome | 129/4205 | 167/8465 | 1.43e-13 | 3.43e-12 | 1.75e-12 | 129 |
| hsa03010310 | Esophagus | ESCC | Ribosome | 129/4205 | 167/8465 | 1.43e-13 | 3.43e-12 | 1.75e-12 | 129 |
| hsa0301022 | Liver | Cirrhotic | Ribosome | 127/2530 | 167/8465 | 2.12e-35 | 7.06e-33 | 4.35e-33 | 127 |
| hsa0301032 | Liver | Cirrhotic | Ribosome | 127/2530 | 167/8465 | 2.12e-35 | 7.06e-33 | 4.35e-33 | 127 |
| hsa0301042 | Liver | HCC | Ribosome | 128/4020 | 167/8465 | 7.32e-15 | 2.23e-13 | 1.24e-13 | 128 |
| hsa0301052 | Liver | HCC | Ribosome | 128/4020 | 167/8465 | 7.32e-15 | 2.23e-13 | 1.24e-13 | 128 |
| hsa0301030 | Oral cavity | OSCC | Ribosome | 128/3704 | 167/8465 | 2.42e-18 | 1.62e-16 | 8.25e-17 | 128 |
| hsa03010114 | Oral cavity | OSCC | Ribosome | 128/3704 | 167/8465 | 2.42e-18 | 1.62e-16 | 8.25e-17 | 128 |
| hsa03010210 | Oral cavity | LP | Ribosome | 127/2418 | 167/8465 | 1.22e-37 | 4.05e-35 | 2.61e-35 | 127 |
| hsa0301038 | Oral cavity | LP | Ribosome | 127/2418 | 167/8465 | 1.22e-37 | 4.05e-35 | 2.61e-35 | 127 |
| hsa0301028 | Prostate | BPH | Ribosome | 104/1718 | 167/8465 | 8.04e-33 | 1.33e-30 | 8.21e-31 | 104 |
| hsa03010113 | Prostate | BPH | Ribosome | 104/1718 | 167/8465 | 8.04e-33 | 1.33e-30 | 8.21e-31 | 104 |
| hsa0301029 | Prostate | Tumor | Ribosome | 104/1791 | 167/8465 | 3.53e-31 | 5.84e-29 | 3.62e-29 | 104 |
| hsa0301037 | Prostate | Tumor | Ribosome | 104/1791 | 167/8465 | 3.53e-31 | 5.84e-29 | 3.62e-29 | 104 |
| Page: 1 |
Top |
Cell-cell communication analysis |
| Identification of potential cell-cell interactions between two cell types and their ligand-receptor pairs for different disease states |
| Ligand | Receptor | LRpair | Pathway | Tissue | Disease Stage |
| Page: 1 |
Top |
Single-cell gene regulatory network inference analysis |
| Find out the significant the regulons (TFs) and the target genes of each regulon across cell types for different disease states |
| TF | Cell Type | Tissue | Disease Stage | Target Gene | RSS | Regulon Activity |
| ∗The dot plots of a searched regulon are shown for all cell subpopulations in each disease state of each tissue based on the regulon specific score inferred using pySCENIC and by calculating the average expression. |
| Page: 1 |
Top |
Somatic mutation of malignant transformation related genes |
| Annotation of somatic variants for genes involved in malignant transformation |
| Hugo Symbol | Variant Class | Variant Classification | dbSNP RS | HGVSc | HGVSp | HGVSp Short | SWISSPROT | BIOTYPE | SIFT | PolyPhen | Tumor Sample Barcode | Tissue | Histology | Sex | Age | Stage | Therapy Types | Drugs | Outcome |
| MRPS6 | SNV | Missense_Mutation | rs753096820 | c.71N>A | p.Arg24His | p.R24H | P82932 | protein_coding | deleterious(0) | probably_damaging(1) | TCGA-AA-A00N-01 | Colorectum | colon adenocarcinoma | Male | >=65 | I/II | Unknown | Unknown | PD |
| MRPS6 | SNV | Missense_Mutation | c.81N>T | p.Glu27Asp | p.E27D | P82932 | protein_coding | tolerated(0.08) | possibly_damaging(0.884) | TCGA-AJ-A3BH-01 | Endometrium | uterine corpus endometrioid carcinoma | Female | Unknown | I/II | Unknown | Unknown | SD | |
| MRPS6 | SNV | Missense_Mutation | rs777690532 | c.251G>A | p.Arg84Gln | p.R84Q | P82932 | protein_coding | deleterious(0) | probably_damaging(0.999) | TCGA-AX-A2HC-01 | Endometrium | uterine corpus endometrioid carcinoma | Female | <65 | III/IV | Chemotherapy | paclitaxel | PD |
| MRPS6 | SNV | Missense_Mutation | c.192C>A | p.Phe64Leu | p.F64L | P82932 | protein_coding | deleterious(0) | probably_damaging(0.912) | TCGA-BS-A0UF-01 | Endometrium | uterine corpus endometrioid carcinoma | Female | >=65 | I/II | Unknown | Unknown | SD | |
| MRPS6 | SNV | Missense_Mutation | rs777690532 | c.251N>A | p.Arg84Gln | p.R84Q | P82932 | protein_coding | deleterious(0) | probably_damaging(0.999) | TCGA-DF-A2KV-01 | Endometrium | uterine corpus endometrioid carcinoma | Female | <65 | I/II | Unknown | Unknown | SD |
| MRPS6 | SNV | Missense_Mutation | rs764160661 | c.334N>T | p.Pro112Ser | p.P112S | P82932 | protein_coding | tolerated(0.28) | benign(0.022) | TCGA-05-4398-01 | Lung | lung adenocarcinoma | Female | <65 | III/IV | Chemotherapy | carboplatin | CR |
| MRPS6 | SNV | Missense_Mutation | c.235N>T | p.Val79Leu | p.V79L | P82932 | protein_coding | tolerated(0.76) | benign(0) | TCGA-44-7670-01 | Lung | lung adenocarcinoma | Female | <65 | I/II | Chemotherapy | docetaxel | SD | |
| MRPS6 | SNV | Missense_Mutation | novel | c.171N>C | p.Gln57His | p.Q57H | P82932 | protein_coding | tolerated(0.57) | benign(0.361) | TCGA-55-8089-01 | Lung | lung adenocarcinoma | Male | <65 | I/II | Unknown | Unknown | SD |
| MRPS6 | SNV | Missense_Mutation | c.211C>T | p.Pro71Ser | p.P71S | P82932 | protein_coding | tolerated(0.06) | possibly_damaging(0.644) | TCGA-86-A456-01 | Lung | lung adenocarcinoma | Female | >=65 | I/II | Unknown | Unknown | SD | |
| MRPS6 | SNV | Missense_Mutation | rs773705009 | c.199N>T | p.Asp67Tyr | p.D67Y | P82932 | protein_coding | deleterious(0) | probably_damaging(0.964) | TCGA-33-6737-01 | Lung | lung squamous cell carcinoma | Male | >=65 | III/IV | Chemotherapy | gemcitabine | PD |
| Page: 1 2 |
Top |
Related drugs of malignant transformation related genes |
| Identification of chemicals and drugs interact with genes involved in malignant transfromation |
| (DGIdb 4.0) |
| Entrez ID | Symbol | Category | Interaction Types | Drug Claim Name | Drug Name | PMIDs |
| Page: 1 |

Copyright 2023-Present -The University of Texas Health Science Center at Houston |