
|
|||||
|
 | |
| |
| |
| |
| |
| |
|
Gene: MRPS36 |
Gene summary for MRPS36 |
| Gene information | Species | Human | Gene symbol | MRPS36 | Gene ID | 92259 |
| Gene name | mitochondrial ribosomal protein S36 | |
| Gene Alias | DC47 | |
| Cytomap | 5q13.2 | |
| Gene Type | protein-coding | GO ID | GO:0006082 | UniProtAcc | P82909 |
Top |
Malignant transformation analysis |
| Identification of the aberrant gene expression in precancerous and cancerous lesions by comparing the gene expression of stem-like cells in diseased tissues with normal stem cells |
| Entrez ID | Symbol | Replicates | Species | Organ | Tissue | Adj P-value | Log2FC | Malignancy |
| 92259 | MRPS36 | AEH-subject1 | Human | Endometrium | AEH | 6.83e-11 | -2.67e-01 | -0.3059 |
| 92259 | MRPS36 | AEH-subject2 | Human | Endometrium | AEH | 3.59e-10 | -2.16e-01 | -0.2525 |
| 92259 | MRPS36 | AEH-subject3 | Human | Endometrium | AEH | 5.87e-12 | -2.85e-01 | -0.2576 |
| 92259 | MRPS36 | AEH-subject4 | Human | Endometrium | AEH | 1.11e-08 | -2.75e-01 | -0.2657 |
| 92259 | MRPS36 | EEC-subject1 | Human | Endometrium | EEC | 1.34e-14 | -2.78e-01 | -0.2682 |
| 92259 | MRPS36 | EEC-subject2 | Human | Endometrium | EEC | 7.82e-12 | -3.24e-01 | -0.2607 |
| 92259 | MRPS36 | EEC-subject3 | Human | Endometrium | EEC | 1.33e-22 | -2.91e-01 | -0.2525 |
| 92259 | MRPS36 | EEC-subject4 | Human | Endometrium | EEC | 1.27e-04 | -1.95e-01 | -0.2571 |
| 92259 | MRPS36 | EEC-subject5 | Human | Endometrium | EEC | 9.32e-07 | -1.94e-01 | -0.249 |
| 92259 | MRPS36 | GSM5276934 | Human | Endometrium | EEC | 7.32e-15 | -3.73e-01 | -0.0913 |
| 92259 | MRPS36 | GSM5276937 | Human | Endometrium | EEC | 6.93e-04 | -2.72e-01 | -0.0897 |
| 92259 | MRPS36 | GSM6177620_NYU_UCEC1_lib1_lib1 | Human | Endometrium | EEC | 6.47e-22 | -3.05e-01 | -0.1869 |
| 92259 | MRPS36 | GSM6177620_NYU_UCEC1_lib2_lib2 | Human | Endometrium | EEC | 1.42e-27 | -2.93e-01 | -0.1875 |
| 92259 | MRPS36 | GSM6177620_NYU_UCEC1_lib3_lib3 | Human | Endometrium | EEC | 9.57e-29 | -2.52e-01 | -0.1883 |
| 92259 | MRPS36 | GSM6177621_NYU_UCEC2_lib1_lib1 | Human | Endometrium | EEC | 8.54e-28 | -3.49e-01 | -0.1934 |
| 92259 | MRPS36 | GSM6177622_NYU_UCEC3_lib1_lib1 | Human | Endometrium | EEC | 1.57e-41 | -4.05e-01 | -0.1917 |
| 92259 | MRPS36 | GSM6177622_NYU_UCEC3_lib2_lib2 | Human | Endometrium | EEC | 5.00e-40 | -3.84e-01 | -0.1916 |
| 92259 | MRPS36 | GSM6177623_NYU_UCEC3_Vis | Human | Endometrium | EEC | 7.76e-09 | -1.82e-01 | -0.1269 |
| 92259 | MRPS36 | LZE4T | Human | Esophagus | ESCC | 4.04e-09 | 1.93e-01 | 0.0811 |
| 92259 | MRPS36 | LZE7T | Human | Esophagus | ESCC | 1.37e-06 | 4.39e-01 | 0.0667 |
| Page: 1 2 3 4 5 6 7 8 |
| Tissue | Expression Dynamics | Abbreviation |
| Endometrium | 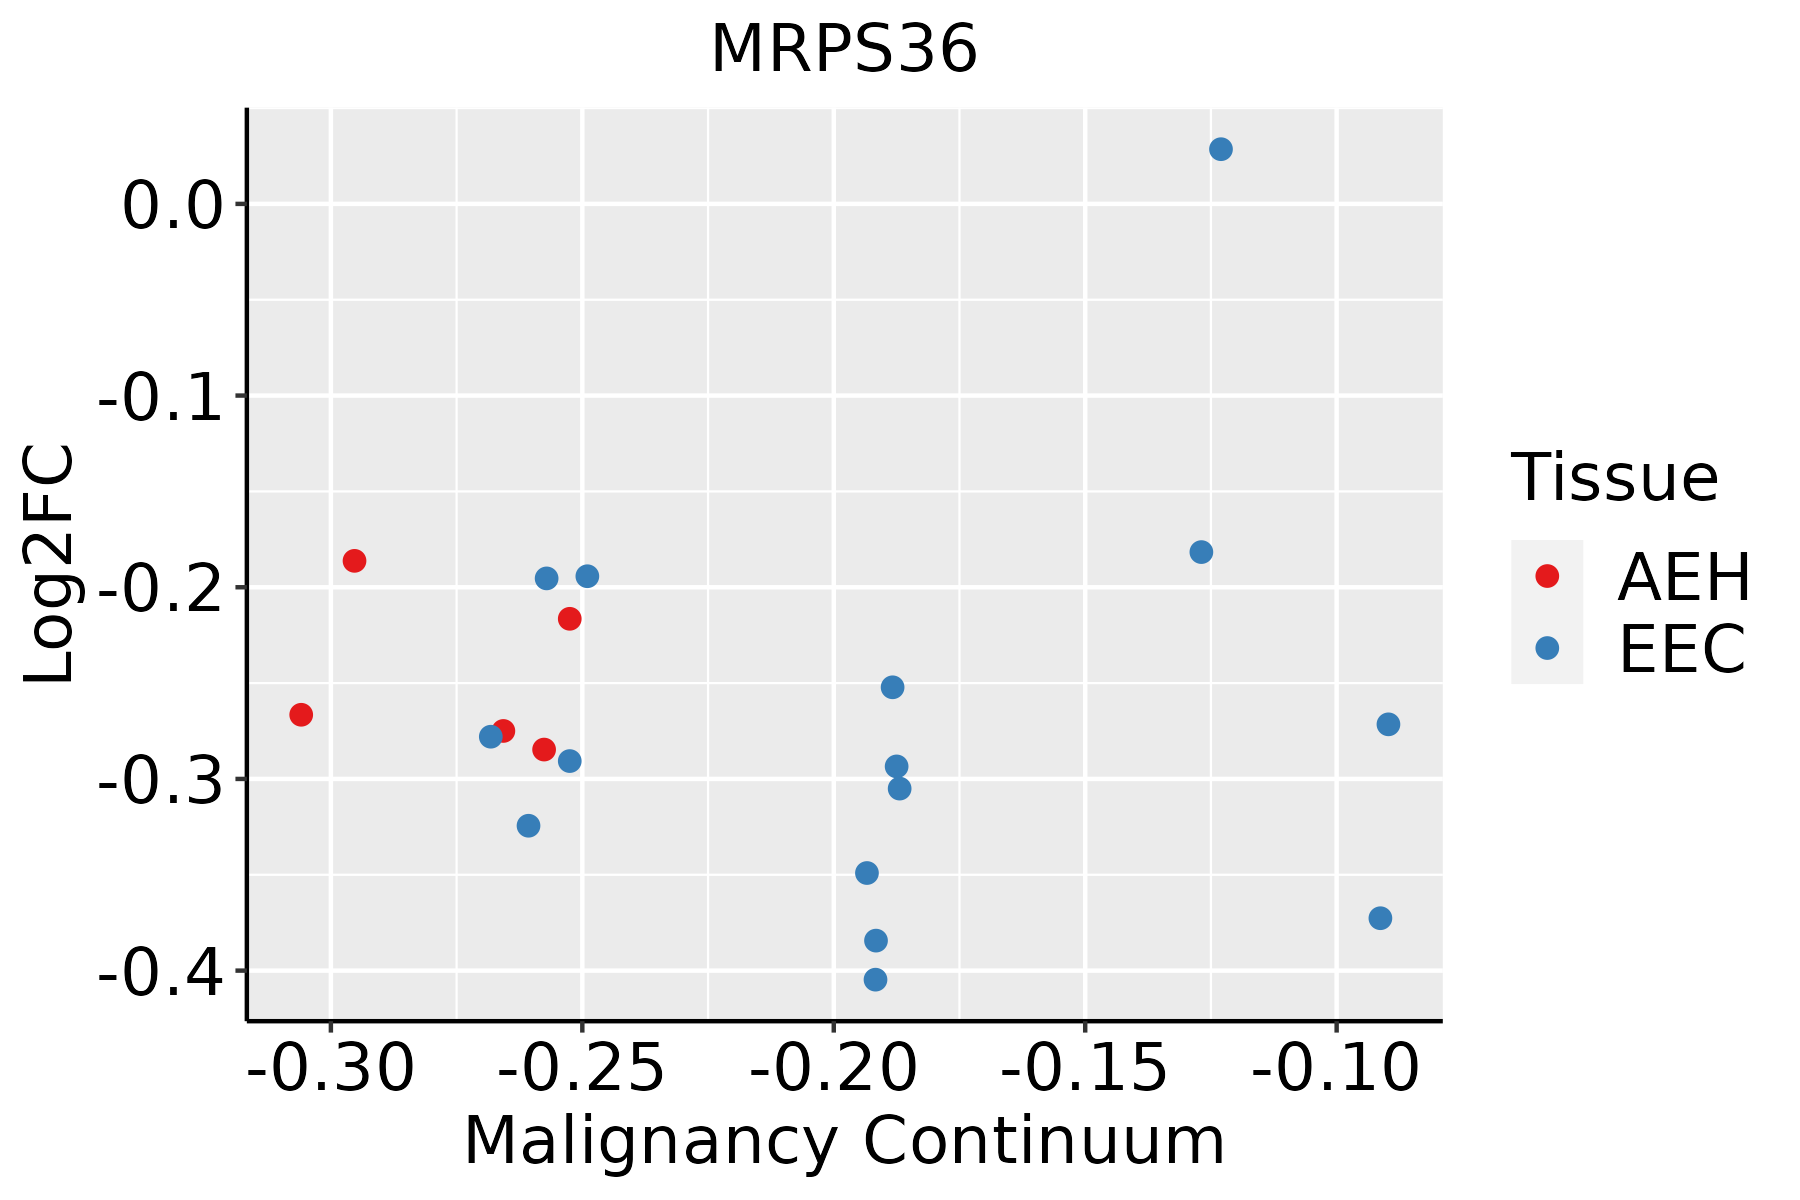 | AEH: Atypical endometrial hyperplasia |
| EEC: Endometrioid Cancer | ||
| Esophagus | 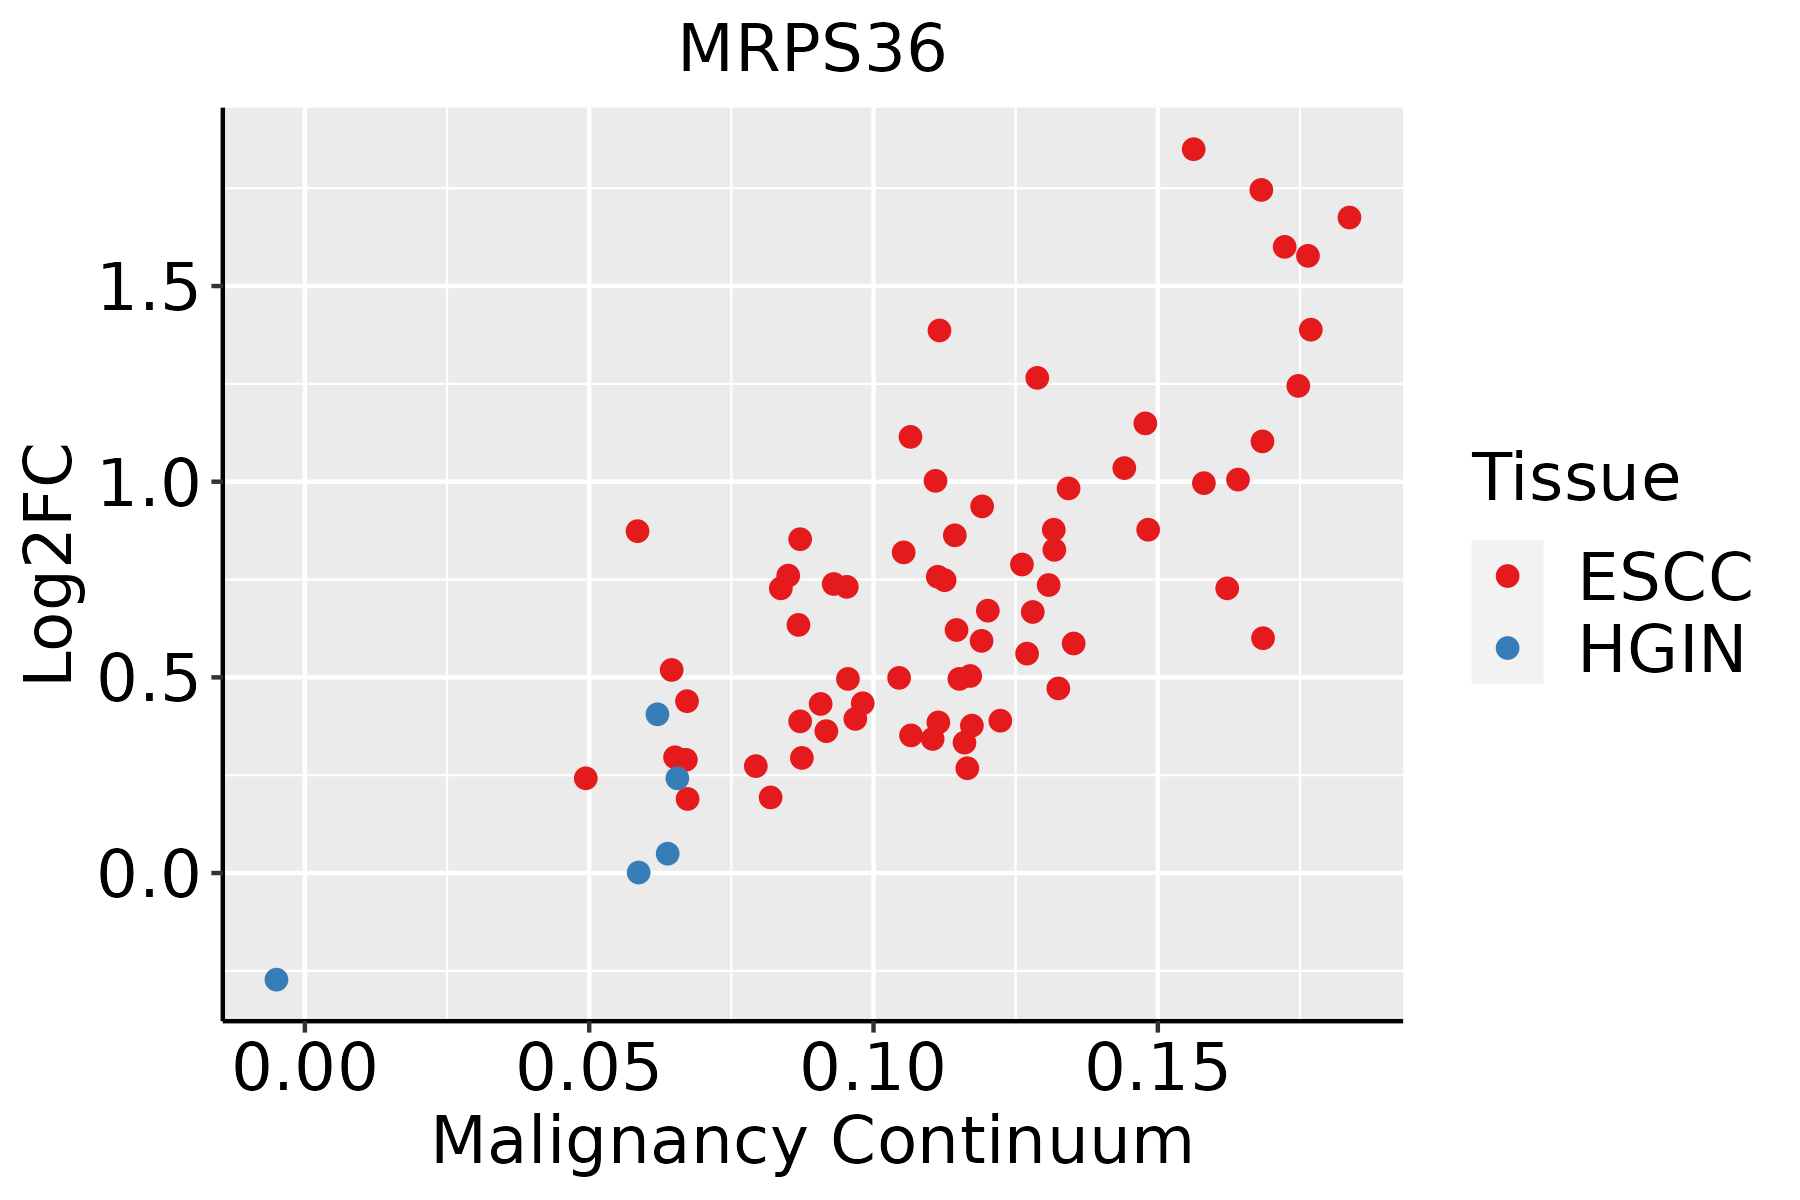 | ESCC: Esophageal squamous cell carcinoma |
| HGIN: High-grade intraepithelial neoplasias | ||
| LGIN: Low-grade intraepithelial neoplasias | ||
| Liver |  | HCC: Hepatocellular carcinoma |
| NAFLD: Non-alcoholic fatty liver disease | ||
| Oral Cavity | 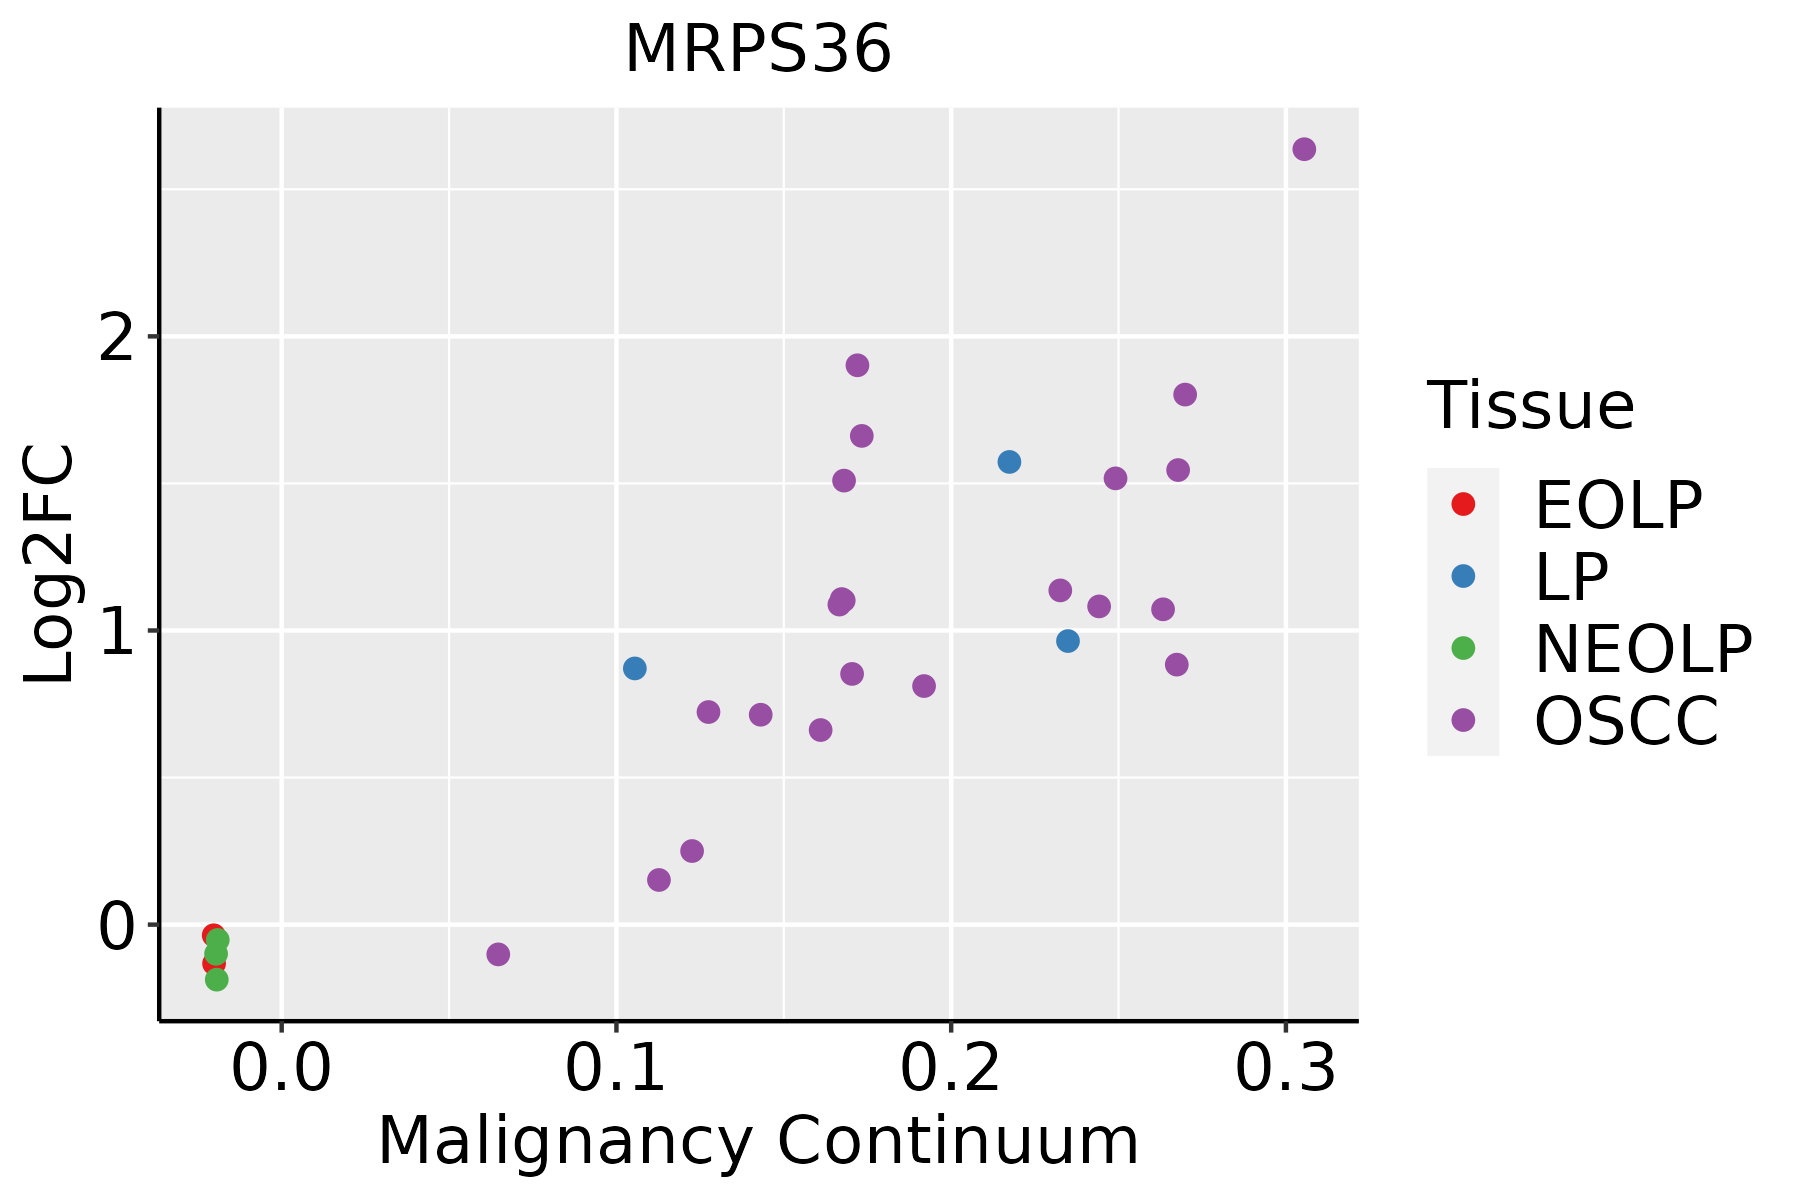 | EOLP: Erosive Oral lichen planus |
| LP: leukoplakia | ||
| NEOLP: Non-erosive oral lichen planus | ||
| OSCC: Oral squamous cell carcinoma | ||
| Prostate | 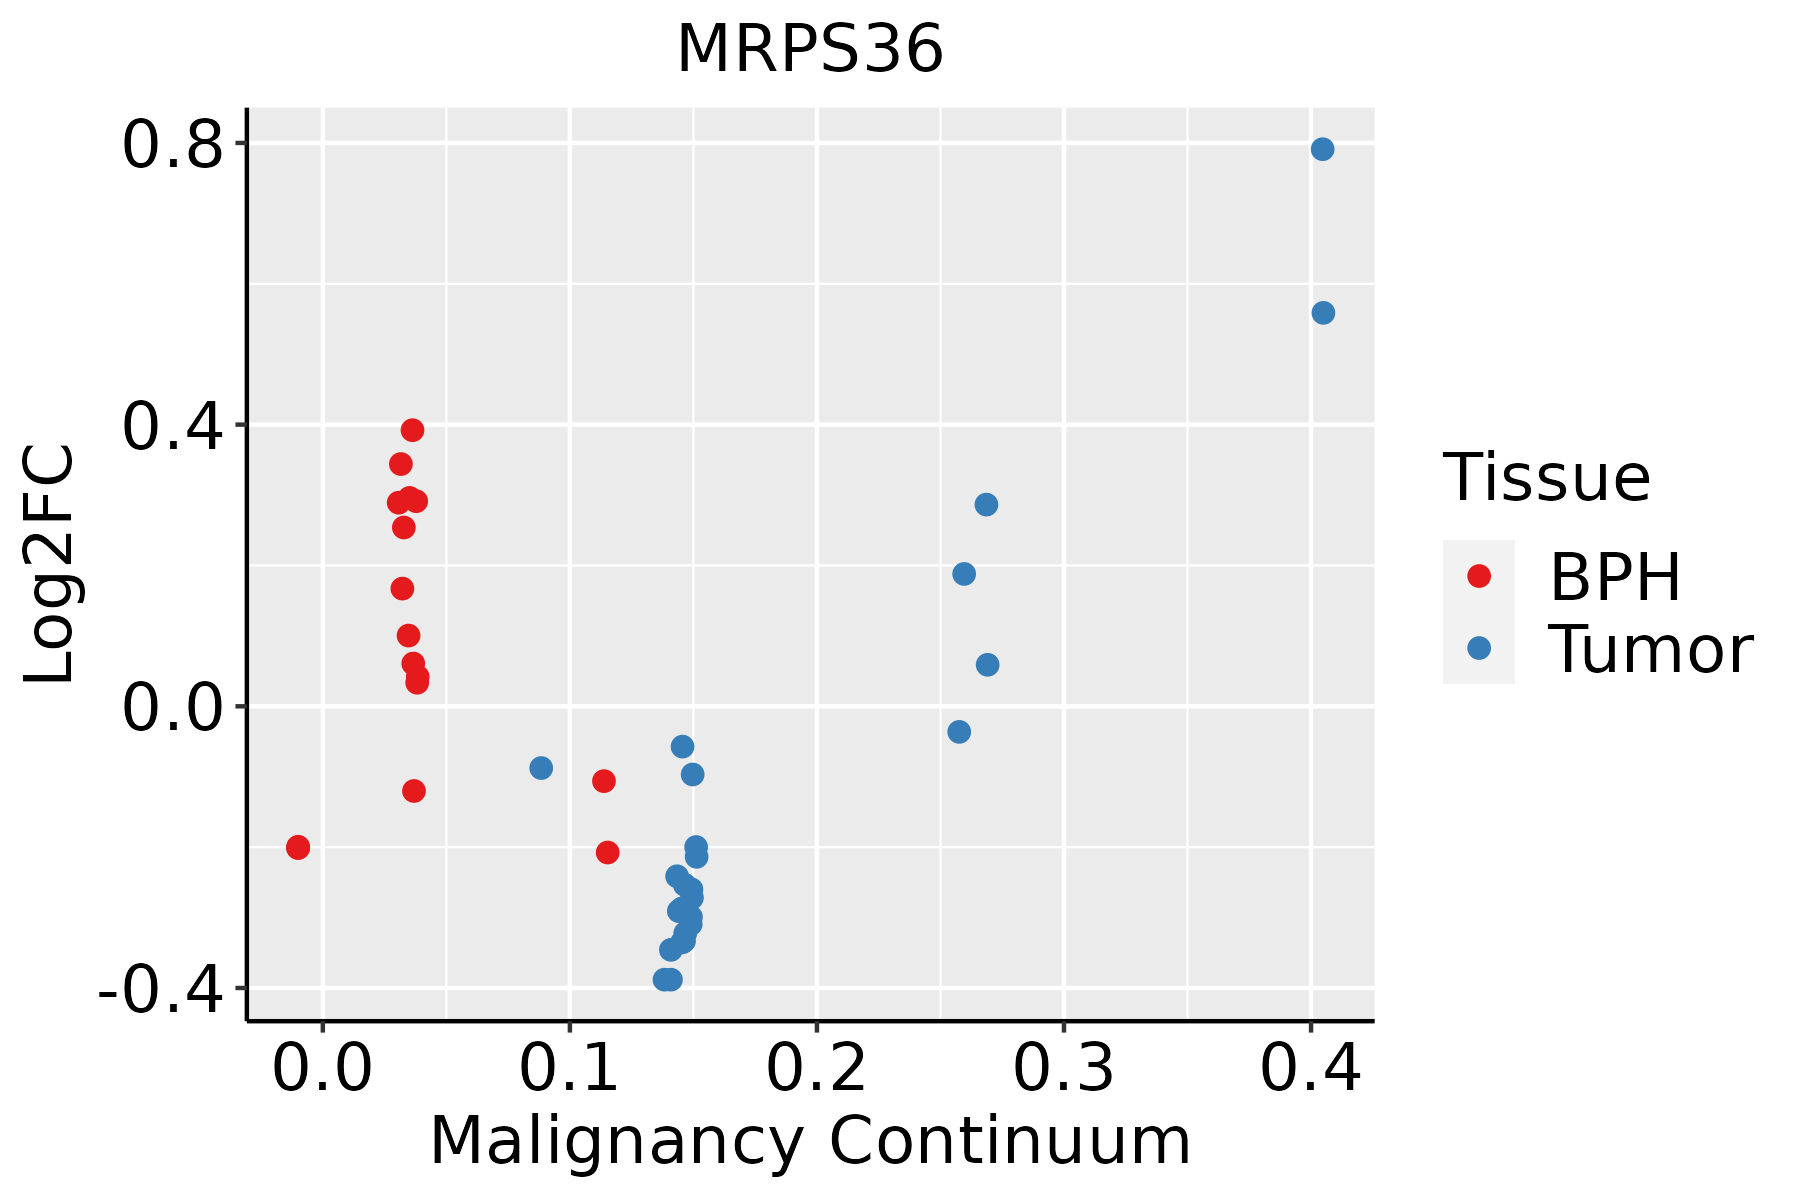 | BPH: Benign Prostatic Hyperplasia |
| Skin |  | AK: Actinic keratosis |
| cSCC: Cutaneous squamous cell carcinoma | ||
| SCCIS:squamous cell carcinoma in situ | ||
| Thyroid |  | ATC: Anaplastic thyroid cancer |
| HT: Hashimoto's thyroiditis | ||
| PTC: Papillary thyroid cancer |
| ∗log2FC in expression of this searched gene in stem-like cells from each diseased tissue sample relative to stem-like cells in normal samples in each tissue plotted against the malignancy continuum. Samples are colored based on if they are from different disease stage. |
Top |
Malignant transformation related pathway analysis |
| Find out the enriched GO biological processes and KEGG pathways involved in transition from healthy to precancer to cancer |
| Tissue | Disease Stage | Enriched GO biological Processes |
| Colorectum | AD |  |
| Colorectum | SER |  |
| Colorectum | MSS |  |
| Colorectum | MSI-H |  |
| Colorectum | FAP |  |
| ∗Top 15 enriched GO BP terms are showed in the bar plot of each disease state in each tissue. Each row represents a significant GO biological process which is colored according to the -log10(p.adjust). |
| Page: 1 2 3 4 5 6 7 8 9 |
| GO ID | Tissue | Disease Stage | Description | Gene Ratio | Bg Ratio | pvalue | p.adjust | Count |
| GO:00436485 | Esophagus | ESCC | dicarboxylic acid metabolic process | 58/8552 | 96/18723 | 2.55e-03 | 1.09e-02 | 58 |
| GO:004364811 | Liver | Cirrhotic | dicarboxylic acid metabolic process | 43/4634 | 96/18723 | 1.42e-05 | 1.97e-04 | 43 |
| GO:00436482 | Liver | HCC | dicarboxylic acid metabolic process | 68/7958 | 96/18723 | 1.73e-08 | 4.14e-07 | 68 |
| GO:00061031 | Liver | HCC | 2-oxoglutarate metabolic process | 14/7958 | 18/18723 | 2.57e-03 | 1.23e-02 | 14 |
| GO:00436484 | Oral cavity | OSCC | dicarboxylic acid metabolic process | 50/7305 | 96/18723 | 6.24e-03 | 2.35e-02 | 50 |
| GO:00436486 | Skin | cSCC | dicarboxylic acid metabolic process | 38/4864 | 96/18723 | 2.38e-03 | 1.38e-02 | 38 |
| Page: 1 |
| Pathway ID | Tissue | Disease Stage | Description | Gene Ratio | Bg Ratio | pvalue | p.adjust | qvalue | Count |
| Page: 1 |
Top |
Cell-cell communication analysis |
| Identification of potential cell-cell interactions between two cell types and their ligand-receptor pairs for different disease states |
| Ligand | Receptor | LRpair | Pathway | Tissue | Disease Stage |
| Page: 1 |
Top |
Single-cell gene regulatory network inference analysis |
| Find out the significant the regulons (TFs) and the target genes of each regulon across cell types for different disease states |
| TF | Cell Type | Tissue | Disease Stage | Target Gene | RSS | Regulon Activity |
| ∗The dot plots of a searched regulon are shown for all cell subpopulations in each disease state of each tissue based on the regulon specific score inferred using pySCENIC and by calculating the average expression. |
| Page: 1 |
Top |
Somatic mutation of malignant transformation related genes |
| Annotation of somatic variants for genes involved in malignant transformation |
| Hugo Symbol | Variant Class | Variant Classification | dbSNP RS | HGVSc | HGVSp | HGVSp Short | SWISSPROT | BIOTYPE | SIFT | PolyPhen | Tumor Sample Barcode | Tissue | Histology | Sex | Age | Stage | Therapy Types | Drugs | Outcome |
| MRPS36 | insertion | Nonsense_Mutation | novel | c.293_294insTTAAACAAGTGTAAAGATATTGAGAAAACTACCCTC | p.Gln98delinsHisTerThrSerValLysIleLeuArgLysLeuProSer | p.Q98delinsH*TSVKILRKLPS | P82909 | protein_coding | TCGA-A2-A0CQ-01 | Breast | breast invasive carcinoma | Female | <65 | I/II | Chemotherapy | adriamycin | SD | ||
| MRPS36 | SNV | Missense_Mutation | c.10N>G | p.Ser4Gly | p.S4G | P82909 | protein_coding | deleterious(0.04) | probably_damaging(0.98) | TCGA-AG-3882-01 | Colorectum | rectum adenocarcinoma | Female | >=65 | I/II | Unknown | Unknown | SD | |
| MRPS36 | SNV | Missense_Mutation | c.232N>C | p.Lys78Gln | p.K78Q | P82909 | protein_coding | tolerated(0.23) | possibly_damaging(0.876) | TCGA-AX-A0J0-01 | Endometrium | uterine corpus endometrioid carcinoma | Female | <65 | I/II | Unknown | Unknown | SD | |
| MRPS36 | SNV | Missense_Mutation | novel | c.271C>G | p.Gln91Glu | p.Q91E | P82909 | protein_coding | tolerated(0.72) | benign(0.031) | TCGA-MN-A4N4-01 | Lung | lung adenocarcinoma | Male | <65 | I/II | Unknown | Unknown | SD |
| MRPS36 | SNV | Missense_Mutation | novel | c.67N>G | p.Ile23Val | p.I23V | P82909 | protein_coding | deleterious(0.01) | probably_damaging(0.986) | TCGA-NC-A5HL-01 | Lung | lung squamous cell carcinoma | Male | >=65 | I/II | Unknown | Unknown | SD |
| MRPS36 | SNV | Missense_Mutation | c.16N>G | p.Met6Val | p.M6V | P82909 | protein_coding | tolerated(0.16) | benign(0.124) | TCGA-BR-8687-01 | Stomach | stomach adenocarcinoma | Female | >=65 | III/IV | Unknown | Unknown | PD | |
| MRPS36 | SNV | Missense_Mutation | novel | c.206N>C | p.Gly69Ala | p.G69A | P82909 | protein_coding | deleterious(0.02) | possibly_damaging(0.874) | TCGA-VQ-A8P3-01 | Stomach | stomach adenocarcinoma | Male | >=65 | III/IV | Chemotherapy | fluorouracil | CR |
| Page: 1 |
Top |
Related drugs of malignant transformation related genes |
| Identification of chemicals and drugs interact with genes involved in malignant transfromation |
| (DGIdb 4.0) |
| Entrez ID | Symbol | Category | Interaction Types | Drug Claim Name | Drug Name | PMIDs |
| Page: 1 |

Copyright 2023-Present -The University of Texas Health Science Center at Houston |