
|
|||||
|
 | |
| |
| |
| |
| |
| |
|
Gene: MRPS35 |
Gene summary for MRPS35 |
| Gene information | Species | Human | Gene symbol | MRPS35 | Gene ID | 60488 |
| Gene name | mitochondrial ribosomal protein S35 | |
| Gene Alias | HDCMD11P | |
| Cytomap | 12p11.22 | |
| Gene Type | protein-coding | GO ID | GO:0006412 | UniProtAcc | P82673 |
Top |
Malignant transformation analysis |
| Identification of the aberrant gene expression in precancerous and cancerous lesions by comparing the gene expression of stem-like cells in diseased tissues with normal stem cells |
| Entrez ID | Symbol | Replicates | Species | Organ | Tissue | Adj P-value | Log2FC | Malignancy |
| 60488 | MRPS35 | HTA11_78_2000001011 | Human | Colorectum | AD | 1.39e-04 | 4.65e-01 | -0.1088 |
| 60488 | MRPS35 | HTA11_347_2000001011 | Human | Colorectum | AD | 1.59e-13 | 5.42e-01 | -0.1954 |
| 60488 | MRPS35 | HTA11_99999970781_79442 | Human | Colorectum | MSS | 2.26e-09 | 4.33e-01 | 0.294 |
| 60488 | MRPS35 | HTA11_99999965062_69753 | Human | Colorectum | MSI-H | 8.56e-08 | 1.45e+00 | 0.3487 |
| 60488 | MRPS35 | HTA11_99999965104_69814 | Human | Colorectum | MSS | 2.13e-04 | 4.72e-01 | 0.281 |
| 60488 | MRPS35 | HTA11_99999971662_82457 | Human | Colorectum | MSS | 5.09e-12 | 5.90e-01 | 0.3859 |
| 60488 | MRPS35 | A015-C-203 | Human | Colorectum | FAP | 2.20e-07 | -1.96e-01 | -0.1294 |
| 60488 | MRPS35 | A002-C-201 | Human | Colorectum | FAP | 3.72e-02 | -1.49e-01 | 0.0324 |
| 60488 | MRPS35 | A001-C-108 | Human | Colorectum | FAP | 6.62e-03 | -1.33e-01 | -0.0272 |
| 60488 | MRPS35 | A002-C-205 | Human | Colorectum | FAP | 2.05e-05 | -1.85e-01 | -0.1236 |
| 60488 | MRPS35 | A015-C-006 | Human | Colorectum | FAP | 9.23e-04 | -2.08e-01 | -0.0994 |
| 60488 | MRPS35 | A015-C-106 | Human | Colorectum | FAP | 2.22e-02 | -1.58e-01 | -0.0511 |
| 60488 | MRPS35 | A002-C-114 | Human | Colorectum | FAP | 3.34e-03 | -1.18e-01 | -0.1561 |
| 60488 | MRPS35 | A015-C-104 | Human | Colorectum | FAP | 2.18e-05 | -1.51e-01 | -0.1899 |
| 60488 | MRPS35 | A002-C-016 | Human | Colorectum | FAP | 4.85e-04 | -1.05e-01 | 0.0521 |
| 60488 | MRPS35 | A002-C-116 | Human | Colorectum | FAP | 3.36e-04 | -7.60e-02 | -0.0452 |
| 60488 | MRPS35 | A014-C-008 | Human | Colorectum | FAP | 6.23e-03 | -2.08e-01 | -0.191 |
| 60488 | MRPS35 | A018-E-020 | Human | Colorectum | FAP | 1.46e-06 | -2.38e-01 | -0.2034 |
| 60488 | MRPS35 | F034 | Human | Colorectum | FAP | 3.06e-02 | -1.14e-01 | -0.0665 |
| 60488 | MRPS35 | LZE4T | Human | Esophagus | ESCC | 1.20e-08 | 3.43e-01 | 0.0811 |
| Page: 1 2 3 4 5 6 7 |
| Tissue | Expression Dynamics | Abbreviation |
| Colorectum (GSE201348) |  | FAP: Familial adenomatous polyposis |
| CRC: Colorectal cancer | ||
| Colorectum (HTA11) |  | AD: Adenomas |
| SER: Sessile serrated lesions | ||
| MSI-H: Microsatellite-high colorectal cancer | ||
| MSS: Microsatellite stable colorectal cancer | ||
| Esophagus | 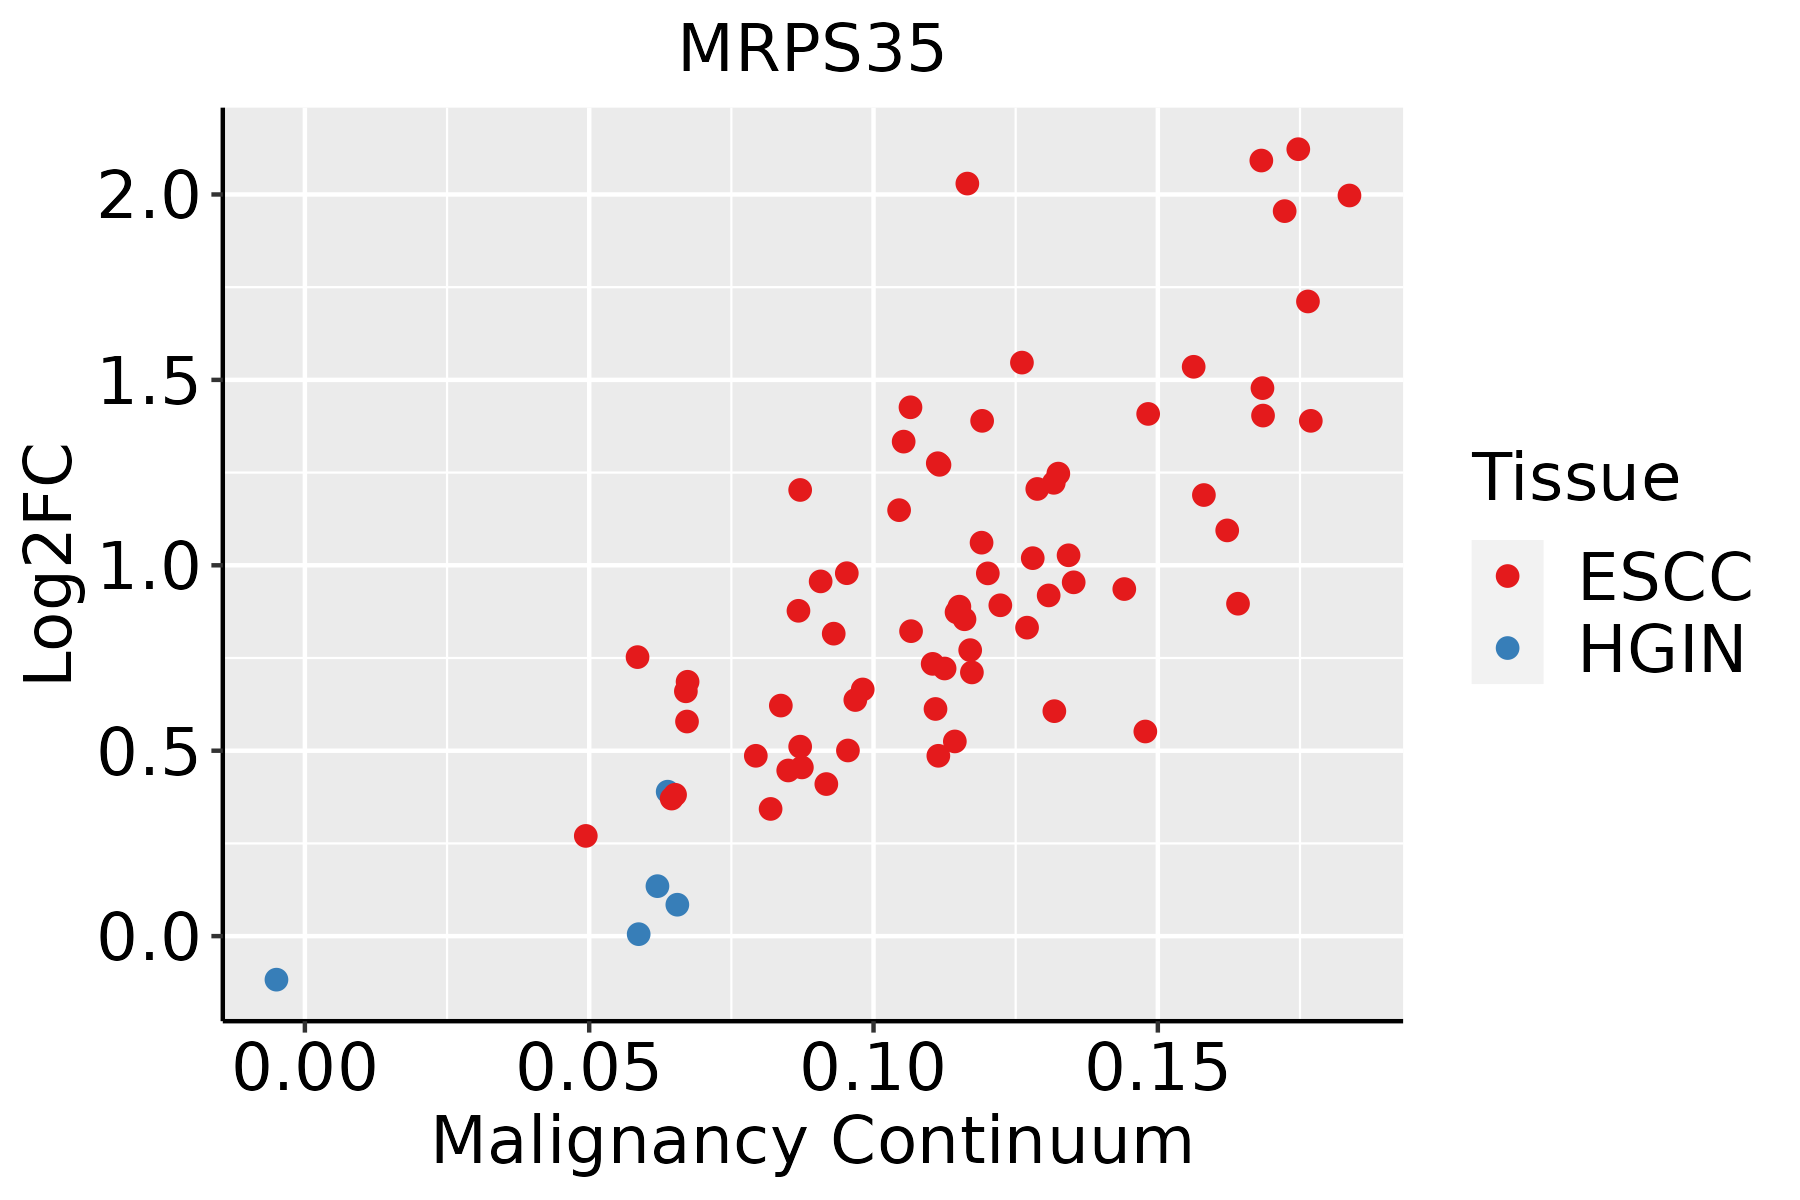 | ESCC: Esophageal squamous cell carcinoma |
| HGIN: High-grade intraepithelial neoplasias | ||
| LGIN: Low-grade intraepithelial neoplasias | ||
| Liver | 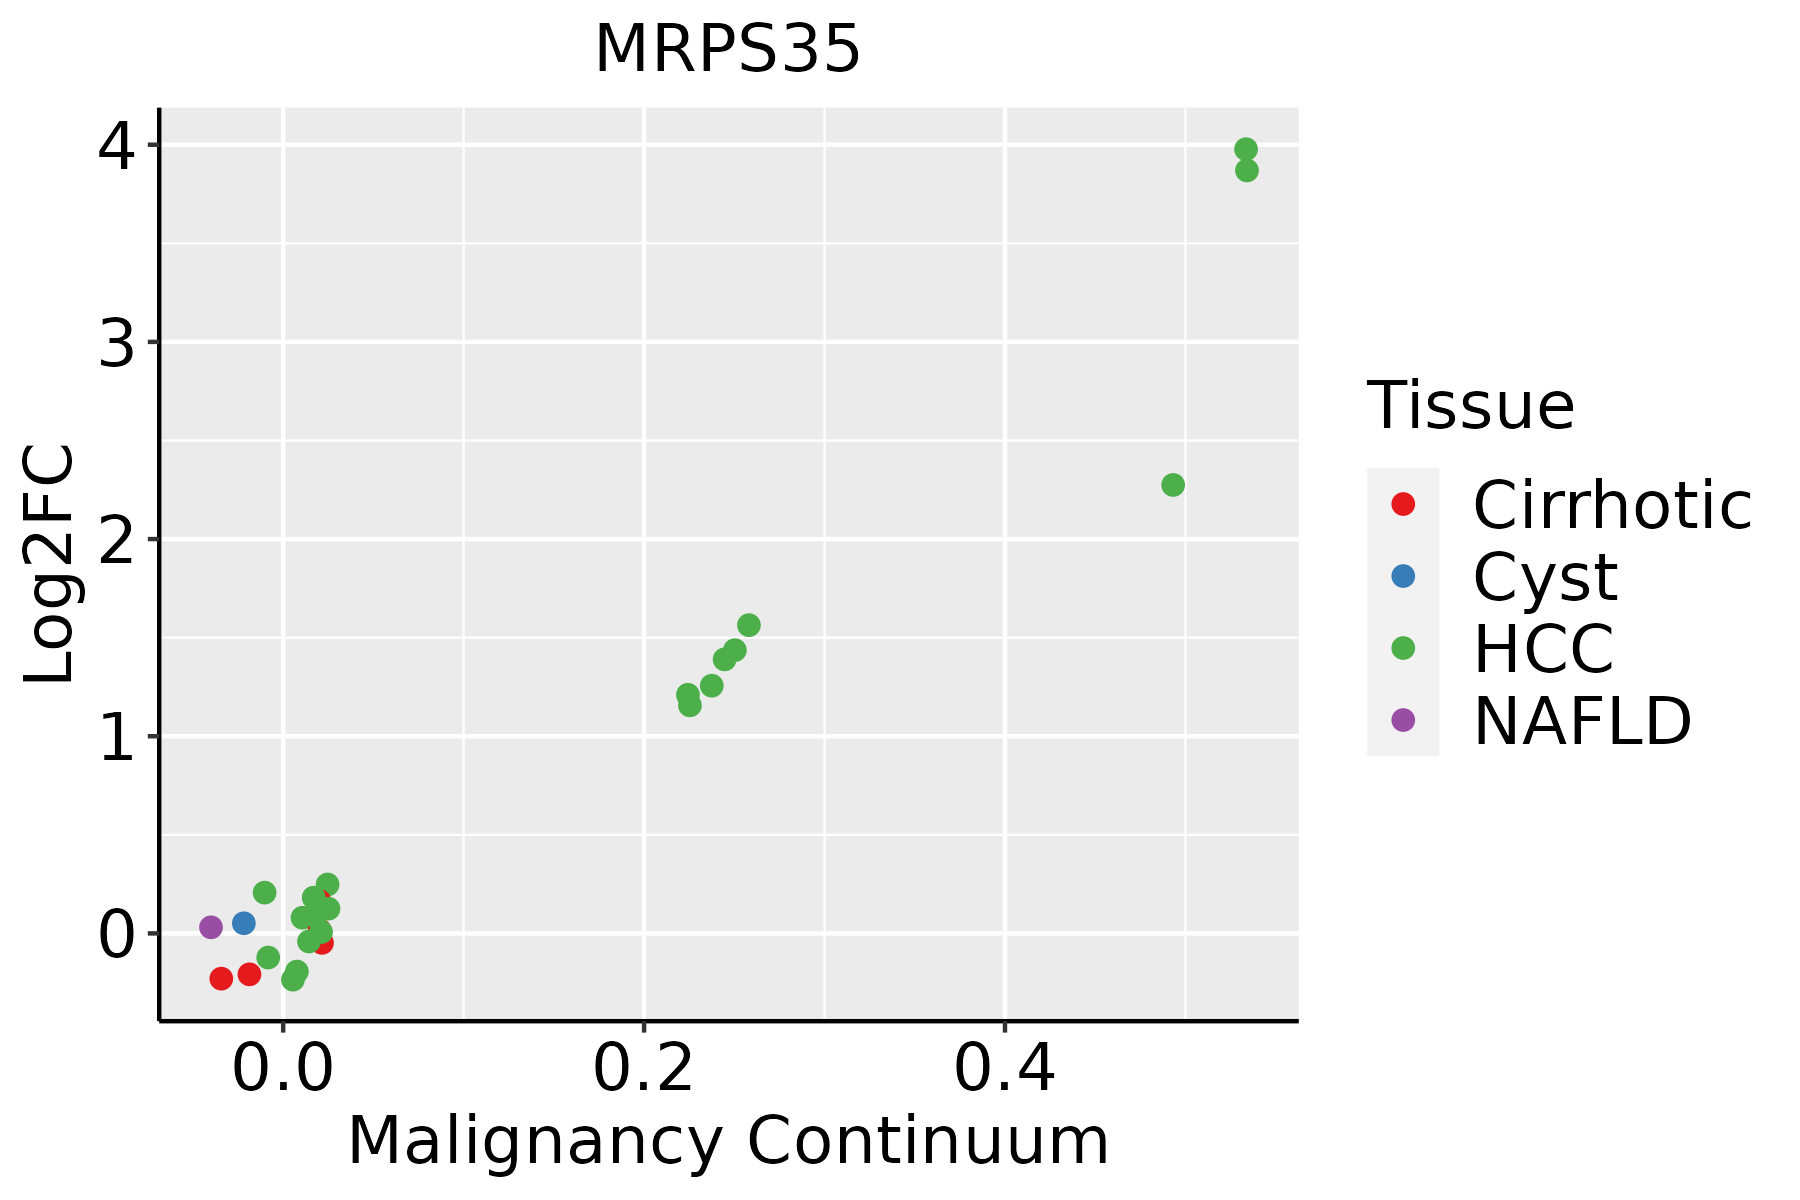 | HCC: Hepatocellular carcinoma |
| NAFLD: Non-alcoholic fatty liver disease | ||
| Oral Cavity | 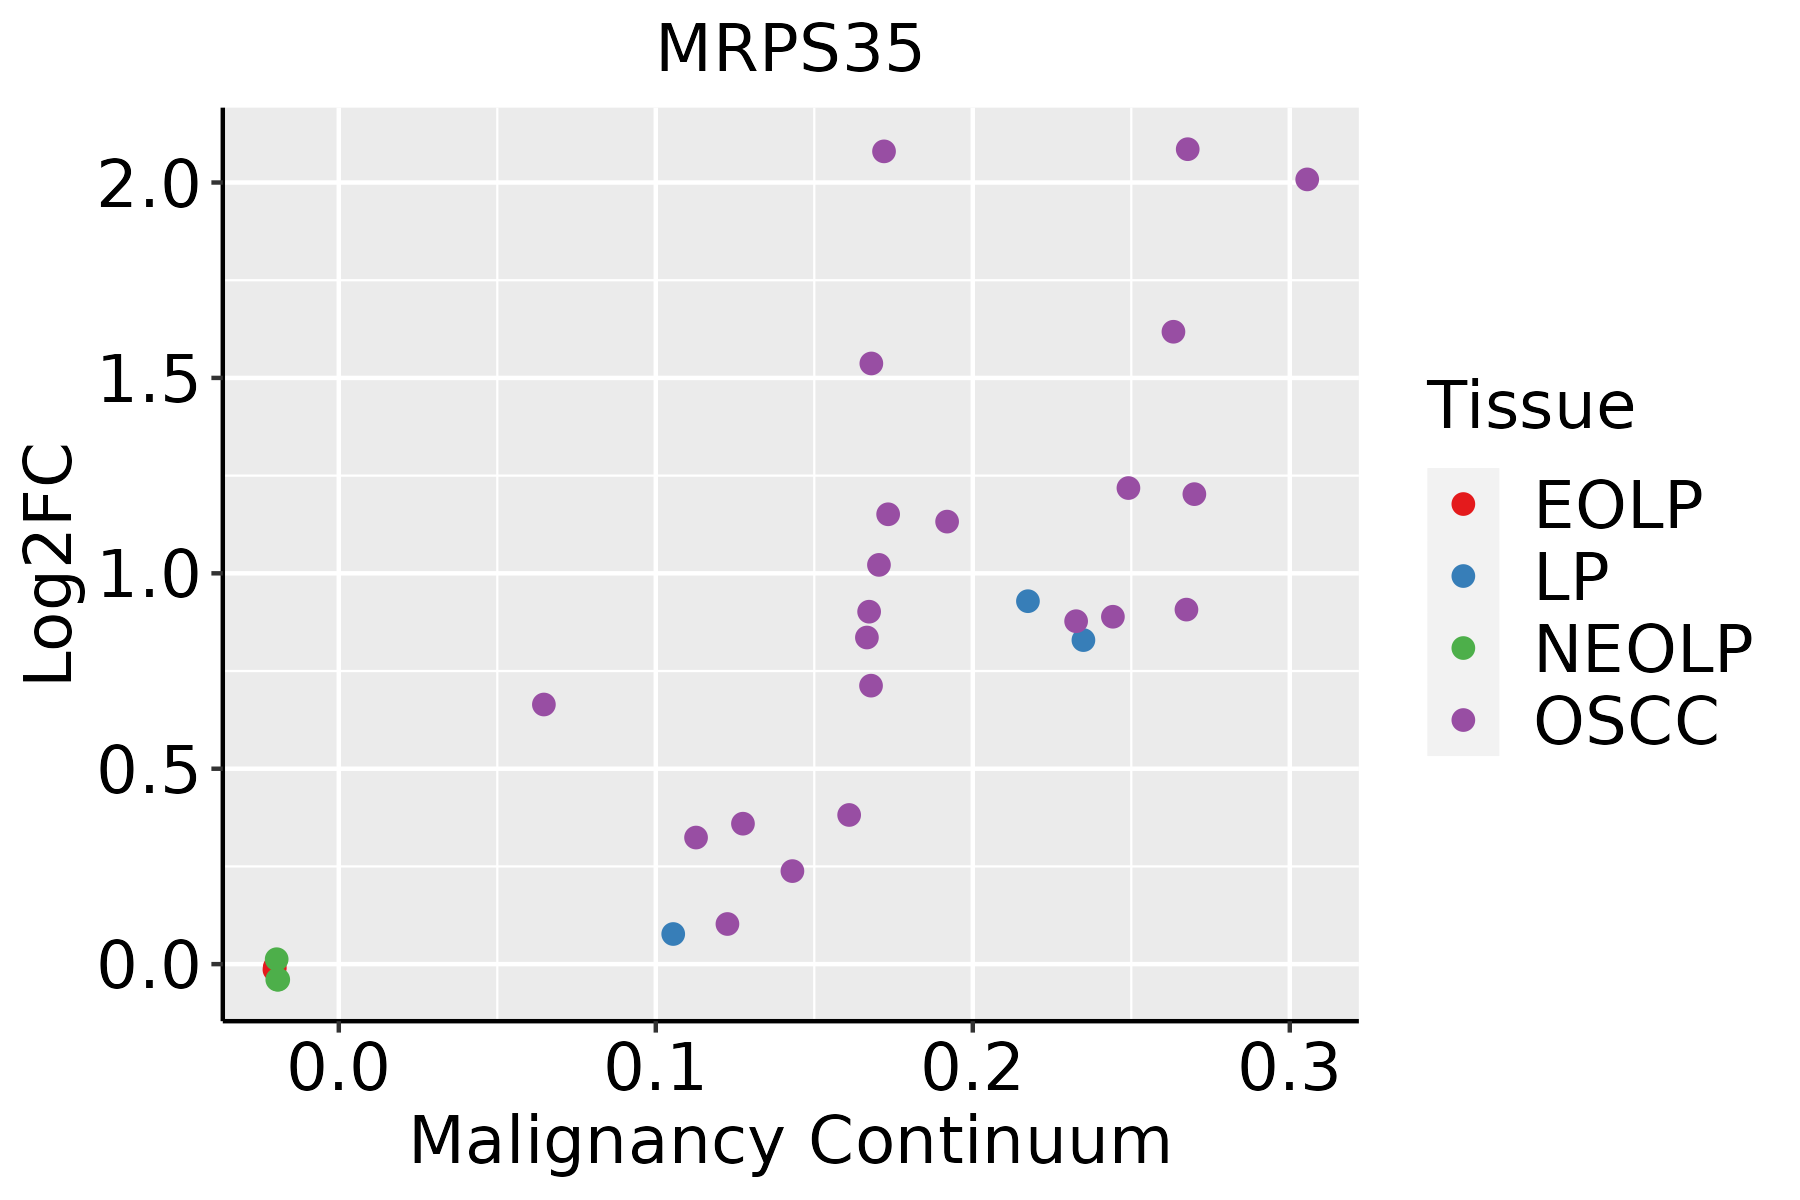 | EOLP: Erosive Oral lichen planus |
| LP: leukoplakia | ||
| NEOLP: Non-erosive oral lichen planus | ||
| OSCC: Oral squamous cell carcinoma | ||
| Skin |  | AK: Actinic keratosis |
| cSCC: Cutaneous squamous cell carcinoma | ||
| SCCIS:squamous cell carcinoma in situ | ||
| Thyroid | 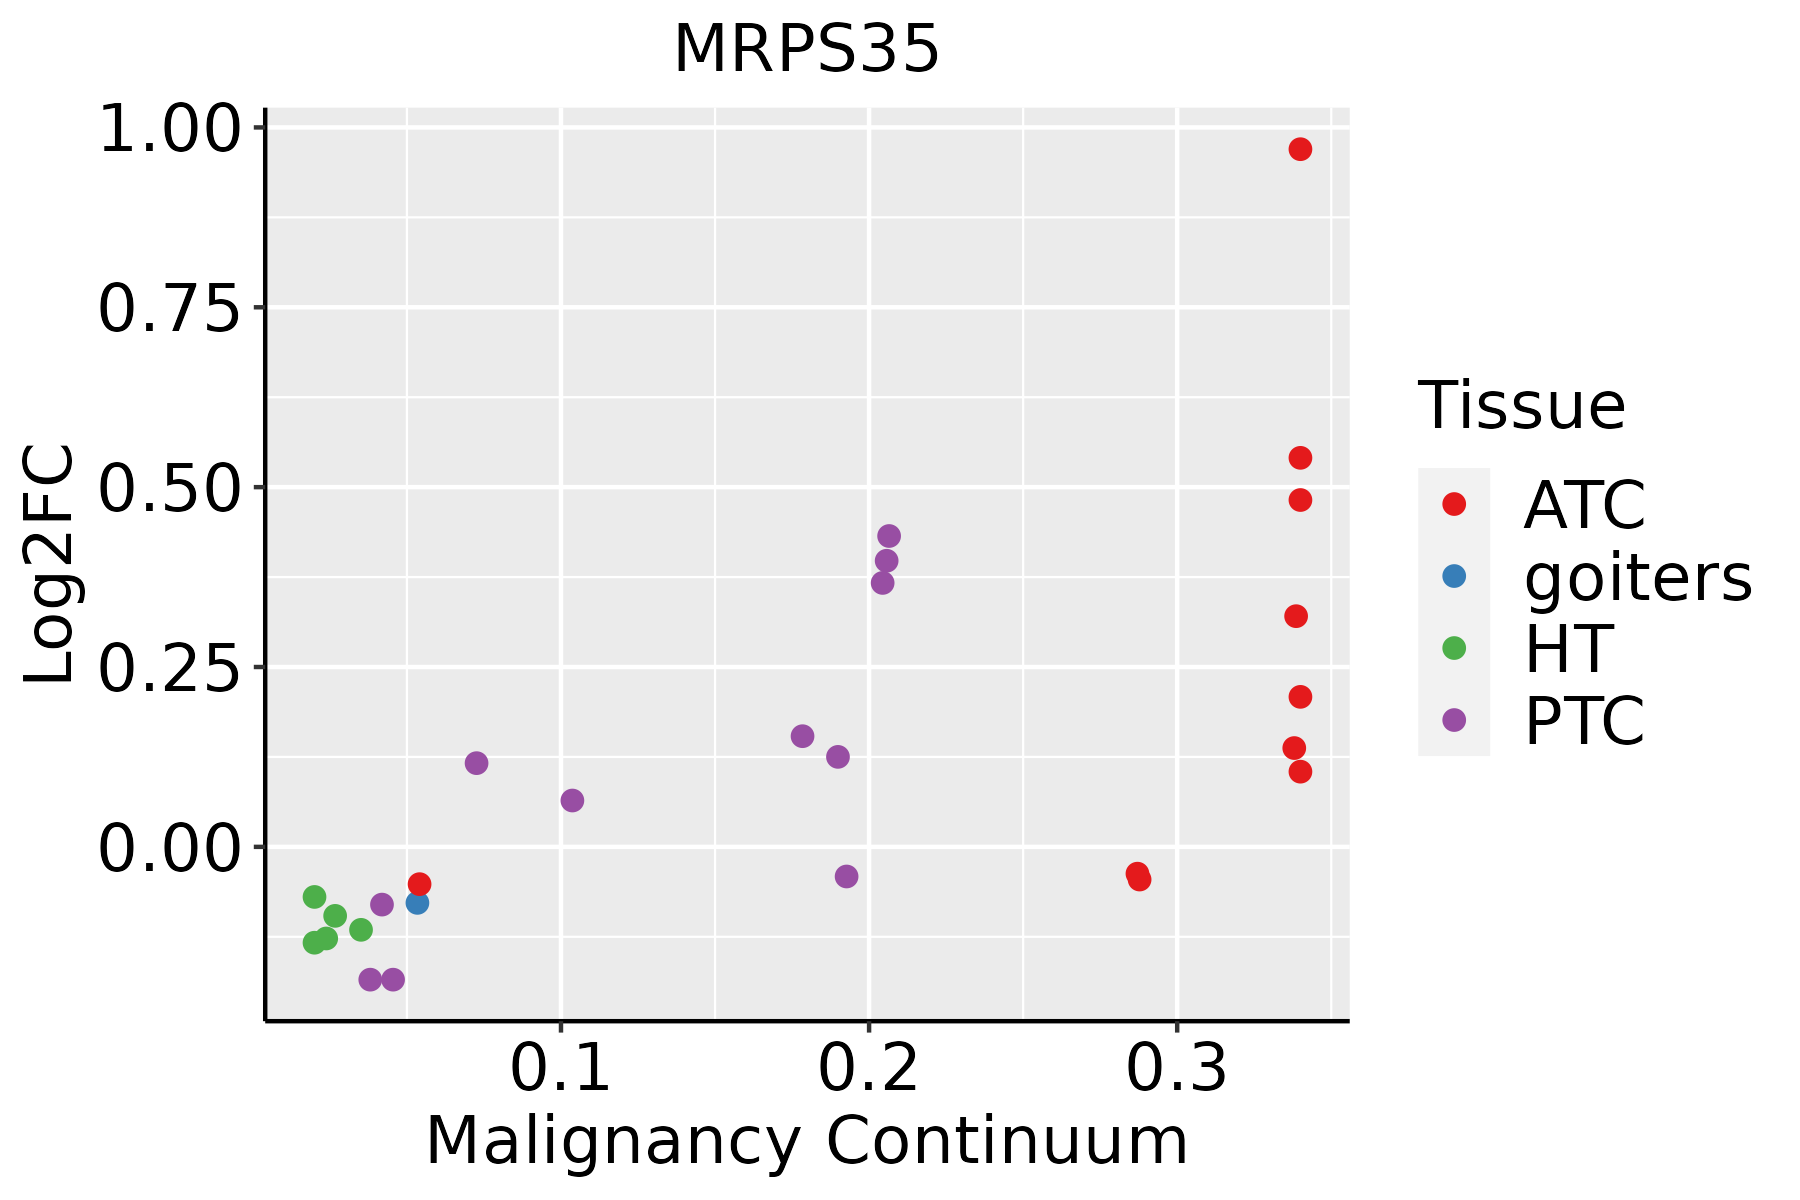 | ATC: Anaplastic thyroid cancer |
| HT: Hashimoto's thyroiditis | ||
| PTC: Papillary thyroid cancer |
| ∗log2FC in expression of this searched gene in stem-like cells from each diseased tissue sample relative to stem-like cells in normal samples in each tissue plotted against the malignancy continuum. Samples are colored based on if they are from different disease stage. |
Top |
Malignant transformation related pathway analysis |
| Find out the enriched GO biological processes and KEGG pathways involved in transition from healthy to precancer to cancer |
| Tissue | Disease Stage | Enriched GO biological Processes |
| Colorectum | AD |  |
| Colorectum | SER |  |
| Colorectum | MSS |  |
| Colorectum | MSI-H |  |
| Colorectum | FAP |  |
| ∗Top 15 enriched GO BP terms are showed in the bar plot of each disease state in each tissue. Each row represents a significant GO biological process which is colored according to the -log10(p.adjust). |
| Page: 1 2 3 4 5 6 7 8 9 |
| GO ID | Tissue | Disease Stage | Description | Gene Ratio | Bg Ratio | pvalue | p.adjust | Count |
| GO:0042769 | Colorectum | AD | DNA damage response, detection of DNA damage | 8/3918 | 13/18723 | 1.70e-03 | 1.41e-02 | 8 |
| GO:00427691 | Colorectum | MSS | DNA damage response, detection of DNA damage | 7/3467 | 13/18723 | 4.46e-03 | 3.15e-02 | 7 |
| GO:00427692 | Colorectum | MSI-H | DNA damage response, detection of DNA damage | 6/1319 | 13/18723 | 1.35e-04 | 3.98e-03 | 6 |
| GO:014005313 | Esophagus | ESCC | mitochondrial gene expression | 93/8552 | 108/18723 | 1.96e-18 | 2.03e-16 | 93 |
| GO:003254314 | Esophagus | ESCC | mitochondrial translation | 68/8552 | 76/18723 | 1.02e-15 | 6.86e-14 | 68 |
| GO:00427697 | Esophagus | ESCC | DNA damage response, detection of DNA damage | 12/8552 | 13/18723 | 6.18e-04 | 3.32e-03 | 12 |
| GO:0032543 | Liver | Cirrhotic | mitochondrial translation | 40/4634 | 76/18723 | 1.61e-07 | 4.29e-06 | 40 |
| GO:0140053 | Liver | Cirrhotic | mitochondrial gene expression | 49/4634 | 108/18723 | 2.35e-06 | 4.31e-05 | 49 |
| GO:00427693 | Liver | Cirrhotic | DNA damage response, detection of DNA damage | 10/4634 | 13/18723 | 1.14e-04 | 1.14e-03 | 10 |
| GO:01400531 | Liver | HCC | mitochondrial gene expression | 82/7958 | 108/18723 | 1.49e-12 | 7.20e-11 | 82 |
| GO:00325431 | Liver | HCC | mitochondrial translation | 62/7958 | 76/18723 | 2.95e-12 | 1.34e-10 | 62 |
| GO:004276911 | Liver | HCC | DNA damage response, detection of DNA damage | 11/7958 | 13/18723 | 2.38e-03 | 1.16e-02 | 11 |
| GO:01400533 | Oral cavity | OSCC | mitochondrial gene expression | 78/7305 | 108/18723 | 2.37e-12 | 9.86e-11 | 78 |
| GO:00325434 | Oral cavity | OSCC | mitochondrial translation | 59/7305 | 76/18723 | 7.21e-12 | 2.70e-10 | 59 |
| GO:00427696 | Oral cavity | OSCC | DNA damage response, detection of DNA damage | 11/7305 | 13/18723 | 1.02e-03 | 5.29e-03 | 11 |
| GO:003254313 | Oral cavity | LP | mitochondrial translation | 43/4623 | 76/18723 | 2.85e-09 | 1.26e-07 | 43 |
| GO:014005312 | Oral cavity | LP | mitochondrial gene expression | 53/4623 | 108/18723 | 3.54e-08 | 1.27e-06 | 53 |
| GO:004276913 | Oral cavity | LP | DNA damage response, detection of DNA damage | 9/4623 | 13/18723 | 8.93e-04 | 7.64e-03 | 9 |
| GO:00325436 | Skin | cSCC | mitochondrial translation | 47/4864 | 76/18723 | 4.70e-11 | 2.22e-09 | 47 |
| GO:01400535 | Skin | cSCC | mitochondrial gene expression | 56/4864 | 108/18723 | 8.06e-09 | 2.56e-07 | 56 |
| Page: 1 2 |
| Pathway ID | Tissue | Disease Stage | Description | Gene Ratio | Bg Ratio | pvalue | p.adjust | qvalue | Count |
| Page: 1 |
Top |
Cell-cell communication analysis |
| Identification of potential cell-cell interactions between two cell types and their ligand-receptor pairs for different disease states |
| Ligand | Receptor | LRpair | Pathway | Tissue | Disease Stage |
| Page: 1 |
Top |
Single-cell gene regulatory network inference analysis |
| Find out the significant the regulons (TFs) and the target genes of each regulon across cell types for different disease states |
| TF | Cell Type | Tissue | Disease Stage | Target Gene | RSS | Regulon Activity |
| ∗The dot plots of a searched regulon are shown for all cell subpopulations in each disease state of each tissue based on the regulon specific score inferred using pySCENIC and by calculating the average expression. |
| Page: 1 |
Top |
Somatic mutation of malignant transformation related genes |
| Annotation of somatic variants for genes involved in malignant transformation |
| Hugo Symbol | Variant Class | Variant Classification | dbSNP RS | HGVSc | HGVSp | HGVSp Short | SWISSPROT | BIOTYPE | SIFT | PolyPhen | Tumor Sample Barcode | Tissue | Histology | Sex | Age | Stage | Therapy Types | Drugs | Outcome |
| MRPS35 | SNV | Missense_Mutation | novel | c.298N>A | p.Glu100Lys | p.E100K | P82673 | protein_coding | tolerated(0.36) | benign(0.012) | TCGA-A2-A0YK-01 | Breast | breast invasive carcinoma | Female | <65 | I/II | Chemotherapy | cytoxan | SD |
| MRPS35 | SNV | Missense_Mutation | novel | c.86N>A | p.Ala29Asp | p.A29D | P82673 | protein_coding | tolerated_low_confidence(0.38) | benign(0.01) | TCGA-A8-A09K-01 | Breast | breast invasive carcinoma | Female | >=65 | I/II | Unknown | Unknown | SD |
| MRPS35 | SNV | Missense_Mutation | c.473C>T | p.Ser158Leu | p.S158L | P82673 | protein_coding | tolerated(0.34) | benign(0.271) | TCGA-AN-A0XW-01 | Breast | breast invasive carcinoma | Female | <65 | III/IV | Unknown | Unknown | SD | |
| MRPS35 | SNV | Missense_Mutation | c.963T>A | p.Asn321Lys | p.N321K | P82673 | protein_coding | tolerated(0.07) | benign(0.003) | TCGA-AA-A02R-01 | Colorectum | colon adenocarcinoma | Female | >=65 | I/II | Unknown | Unknown | PD | |
| MRPS35 | SNV | Missense_Mutation | novel | c.941N>G | p.Glu314Gly | p.E314G | P82673 | protein_coding | deleterious(0) | benign(0.365) | TCGA-AM-5820-01 | Colorectum | colon adenocarcinoma | Female | <65 | I/II | Unknown | Unknown | SD |
| MRPS35 | SNV | Missense_Mutation | c.383A>T | p.Asp128Val | p.D128V | P82673 | protein_coding | deleterious(0.04) | benign(0.115) | TCGA-CK-4951-01 | Colorectum | colon adenocarcinoma | Female | >=65 | I/II | Unknown | Unknown | PD | |
| MRPS35 | insertion | Frame_Shift_Ins | novel | c.942_943insGCTCT | p.Ser315AlafsTer4 | p.S315Afs*4 | P82673 | protein_coding | TCGA-AM-5820-01 | Colorectum | colon adenocarcinoma | Female | <65 | I/II | Unknown | Unknown | SD | ||
| MRPS35 | SNV | Missense_Mutation | novel | c.928T>G | p.Ser310Ala | p.S310A | P82673 | protein_coding | tolerated(0.58) | benign(0.001) | TCGA-A5-A0G2-01 | Endometrium | uterine corpus endometrioid carcinoma | Female | <65 | III/IV | Unknown | Unknown | SD |
| MRPS35 | SNV | Missense_Mutation | rs763066388 | c.421N>A | p.Glu141Lys | p.E141K | P82673 | protein_coding | deleterious(0.03) | probably_damaging(0.962) | TCGA-AJ-A3EL-01 | Endometrium | uterine corpus endometrioid carcinoma | Female | <65 | I/II | Unknown | Unknown | SD |
| MRPS35 | SNV | Missense_Mutation | novel | c.682N>A | p.Val228Met | p.V228M | P82673 | protein_coding | deleterious(0) | probably_damaging(0.999) | TCGA-AX-A1CE-01 | Endometrium | uterine corpus endometrioid carcinoma | Female | <65 | I/II | Unspecific | Paclitaxel | SD |
| Page: 1 2 3 4 |
Top |
Related drugs of malignant transformation related genes |
| Identification of chemicals and drugs interact with genes involved in malignant transfromation |
| (DGIdb 4.0) |
| Entrez ID | Symbol | Category | Interaction Types | Drug Claim Name | Drug Name | PMIDs |
| Page: 1 |

Copyright 2023-Present -The University of Texas Health Science Center at Houston |