
|
|||||
|
 | |
| |
| |
| |
| |
| |
|
Gene: MRPS34 |
Gene summary for MRPS34 |
| Gene information | Species | Human | Gene symbol | MRPS34 | Gene ID | 65993 |
| Gene name | mitochondrial ribosomal protein S34 | |
| Gene Alias | COXPD32 | |
| Cytomap | 16p13.3 | |
| Gene Type | protein-coding | GO ID | GO:0006412 | UniProtAcc | C9JJ19 |
Top |
Malignant transformation analysis |
| Identification of the aberrant gene expression in precancerous and cancerous lesions by comparing the gene expression of stem-like cells in diseased tissues with normal stem cells |
| Entrez ID | Symbol | Replicates | Species | Organ | Tissue | Adj P-value | Log2FC | Malignancy |
| 65993 | MRPS34 | GSM4909290 | Human | Breast | IDC | 2.74e-05 | 3.92e-01 | 0.2096 |
| 65993 | MRPS34 | GSM4909293 | Human | Breast | IDC | 5.11e-18 | 3.89e-01 | 0.1581 |
| 65993 | MRPS34 | GSM4909294 | Human | Breast | IDC | 7.42e-07 | 2.86e-01 | 0.2022 |
| 65993 | MRPS34 | GSM4909296 | Human | Breast | IDC | 6.72e-12 | 3.08e-01 | 0.1524 |
| 65993 | MRPS34 | GSM4909297 | Human | Breast | IDC | 1.91e-04 | -1.03e-01 | 0.1517 |
| 65993 | MRPS34 | GSM4909298 | Human | Breast | IDC | 7.01e-12 | 3.25e-01 | 0.1551 |
| 65993 | MRPS34 | GSM4909301 | Human | Breast | IDC | 8.98e-05 | 2.93e-01 | 0.1577 |
| 65993 | MRPS34 | GSM4909304 | Human | Breast | IDC | 2.15e-27 | 5.38e-01 | 0.1636 |
| 65993 | MRPS34 | GSM4909306 | Human | Breast | IDC | 3.38e-21 | 5.90e-01 | 0.1564 |
| 65993 | MRPS34 | GSM4909308 | Human | Breast | IDC | 2.00e-05 | 3.32e-01 | 0.158 |
| 65993 | MRPS34 | GSM4909311 | Human | Breast | IDC | 6.60e-20 | -1.94e-01 | 0.1534 |
| 65993 | MRPS34 | GSM4909312 | Human | Breast | IDC | 8.75e-08 | 7.14e-02 | 0.1552 |
| 65993 | MRPS34 | GSM4909315 | Human | Breast | IDC | 2.10e-09 | 3.39e-01 | 0.21 |
| 65993 | MRPS34 | GSM4909317 | Human | Breast | IDC | 3.47e-06 | 3.80e-01 | 0.1355 |
| 65993 | MRPS34 | GSM4909318 | Human | Breast | IDC | 4.07e-05 | 5.01e-01 | 0.2031 |
| 65993 | MRPS34 | GSM4909319 | Human | Breast | IDC | 3.49e-35 | 1.82e-01 | 0.1563 |
| 65993 | MRPS34 | GSM4909320 | Human | Breast | IDC | 1.58e-03 | 1.41e-01 | 0.1575 |
| 65993 | MRPS34 | GSM4909321 | Human | Breast | IDC | 4.19e-12 | 1.27e-01 | 0.1559 |
| 65993 | MRPS34 | brca1 | Human | Breast | Precancer | 3.48e-07 | 2.91e-01 | -0.0338 |
| 65993 | MRPS34 | brca2 | Human | Breast | Precancer | 7.43e-08 | 2.25e-01 | -0.024 |
| Page: 1 2 3 4 5 6 7 8 9 10 11 12 |
| Tissue | Expression Dynamics | Abbreviation |
| Breast | 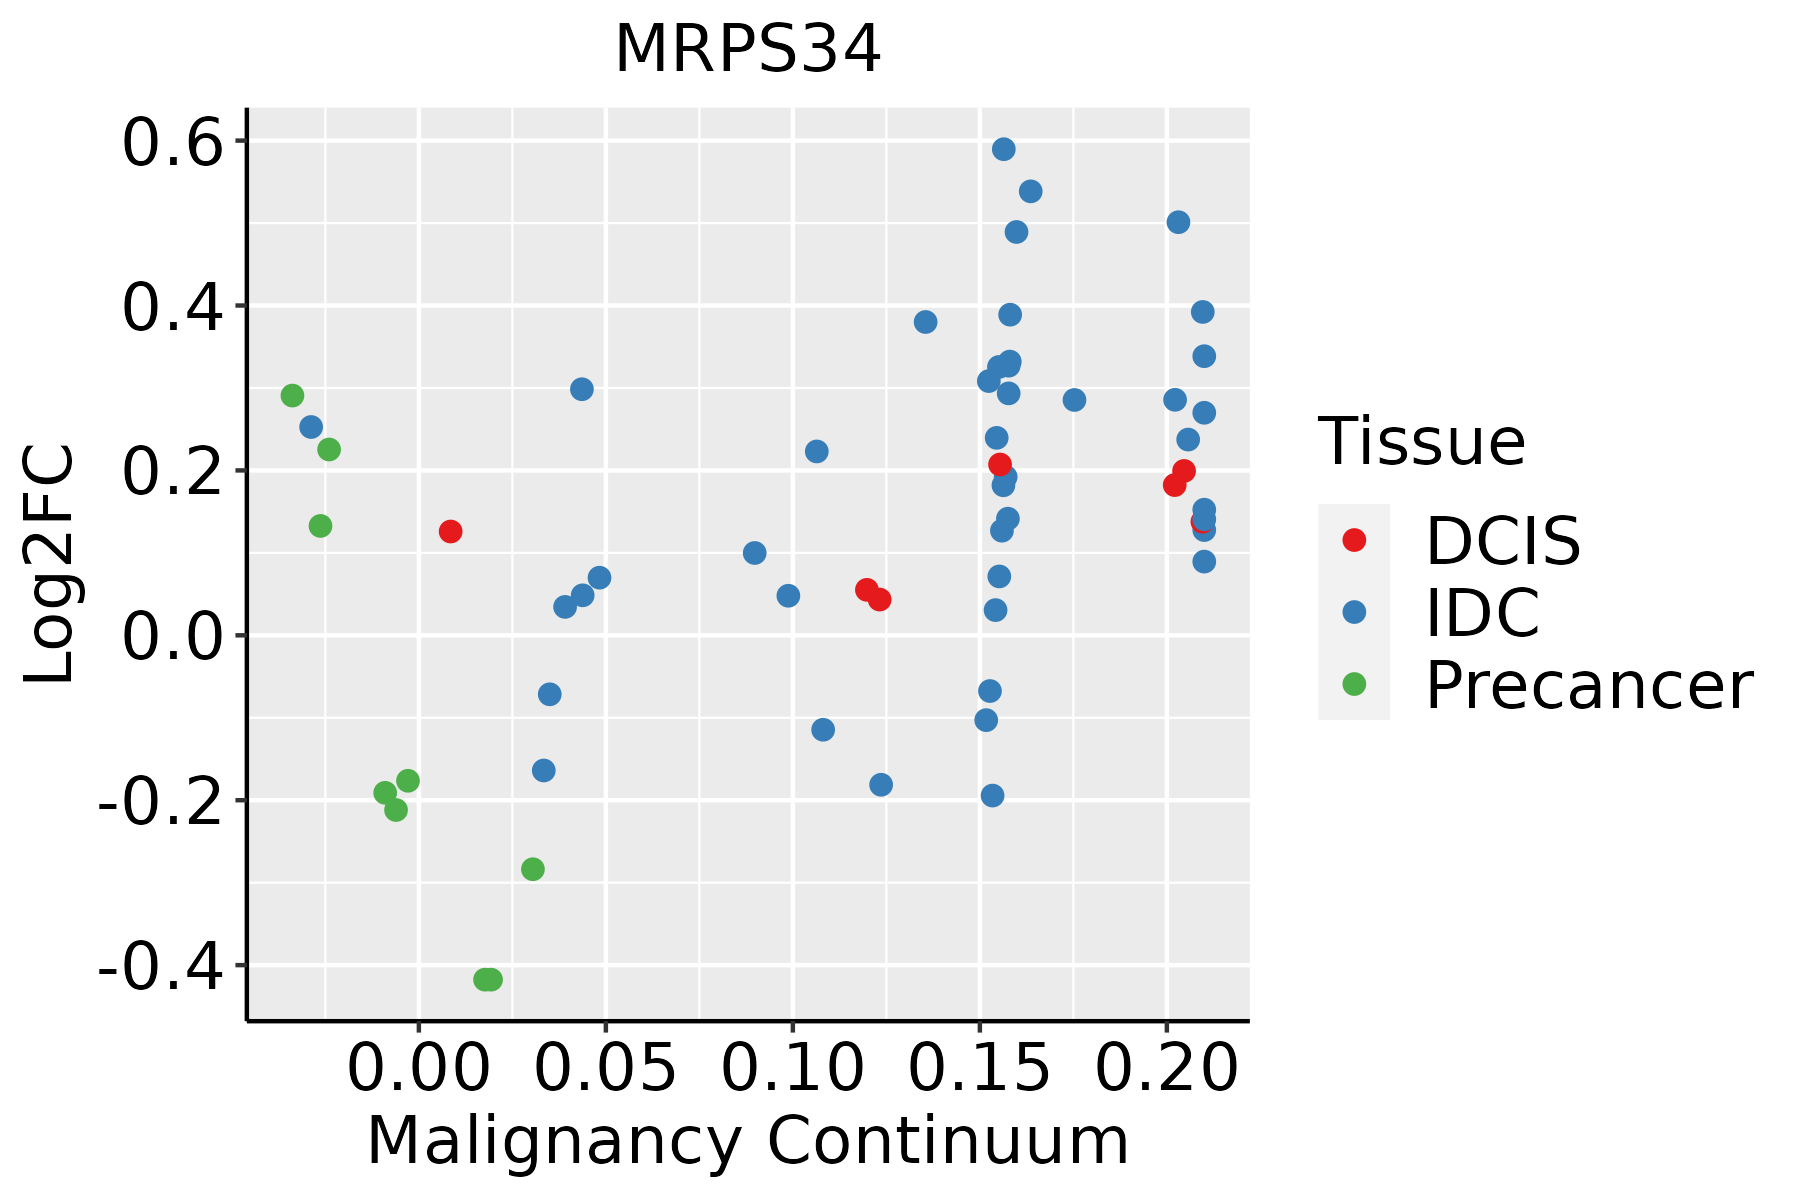 | IDC: Invasive ductal carcinoma |
| DCIS: Ductal carcinoma in situ | ||
| Precancer(BRCA1-mut): Precancerous lesion from BRCA1 mutation carriers | ||
| Colorectum (GSE201348) |  | FAP: Familial adenomatous polyposis |
| CRC: Colorectal cancer | ||
| Colorectum (HTA11) |  | AD: Adenomas |
| SER: Sessile serrated lesions | ||
| MSI-H: Microsatellite-high colorectal cancer | ||
| MSS: Microsatellite stable colorectal cancer | ||
| Endometrium | 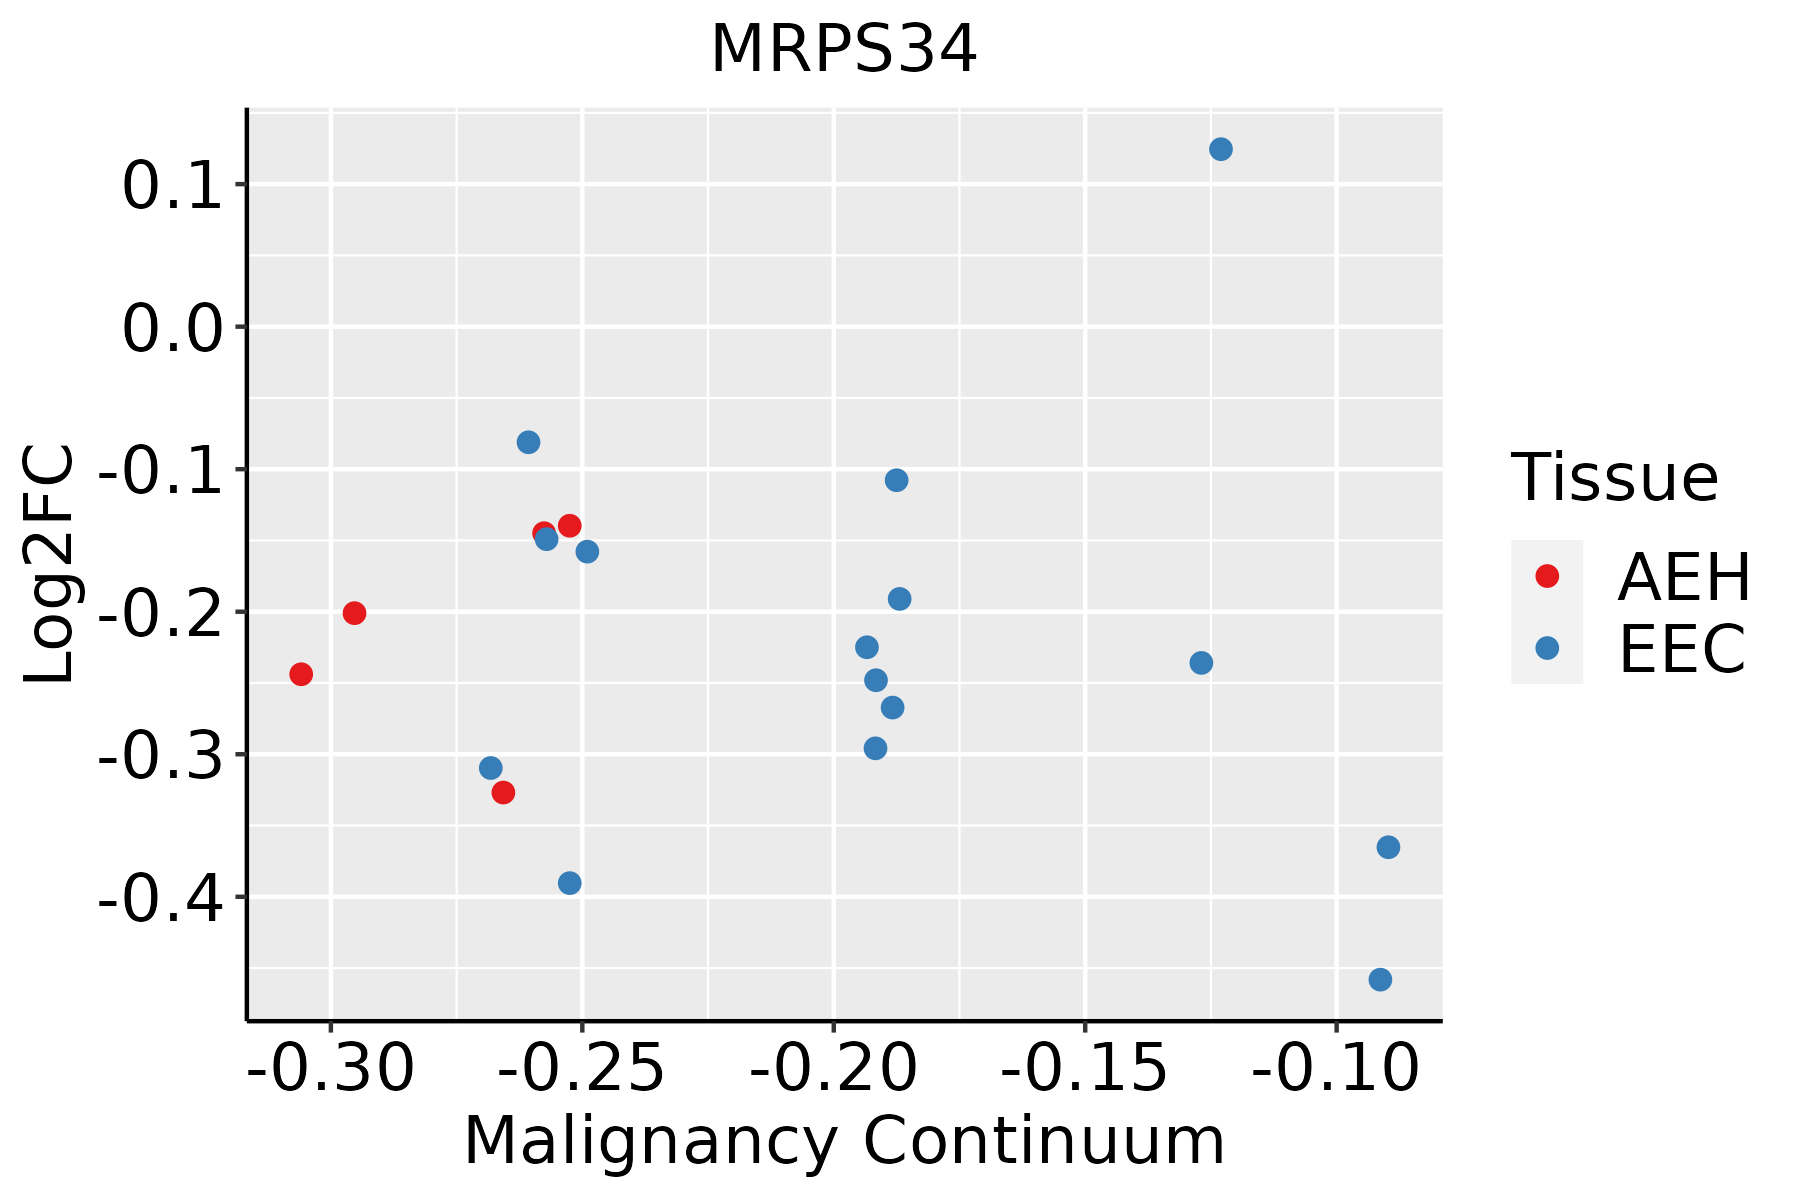 | AEH: Atypical endometrial hyperplasia |
| EEC: Endometrioid Cancer | ||
| Esophagus |  | ESCC: Esophageal squamous cell carcinoma |
| HGIN: High-grade intraepithelial neoplasias | ||
| LGIN: Low-grade intraepithelial neoplasias | ||
| GC |  | CAG: Chronic atrophic gastritis |
| CAG with IM: Chronic atrophic gastritis with intestinal metaplasia | ||
| CSG: Chronic superficial gastritis | ||
| GC: Gastric cancer | ||
| SIM: Severe intestinal metaplasia | ||
| WIM: Wild intestinal metaplasia | ||
| Liver |  | HCC: Hepatocellular carcinoma |
| NAFLD: Non-alcoholic fatty liver disease | ||
| Oral Cavity | 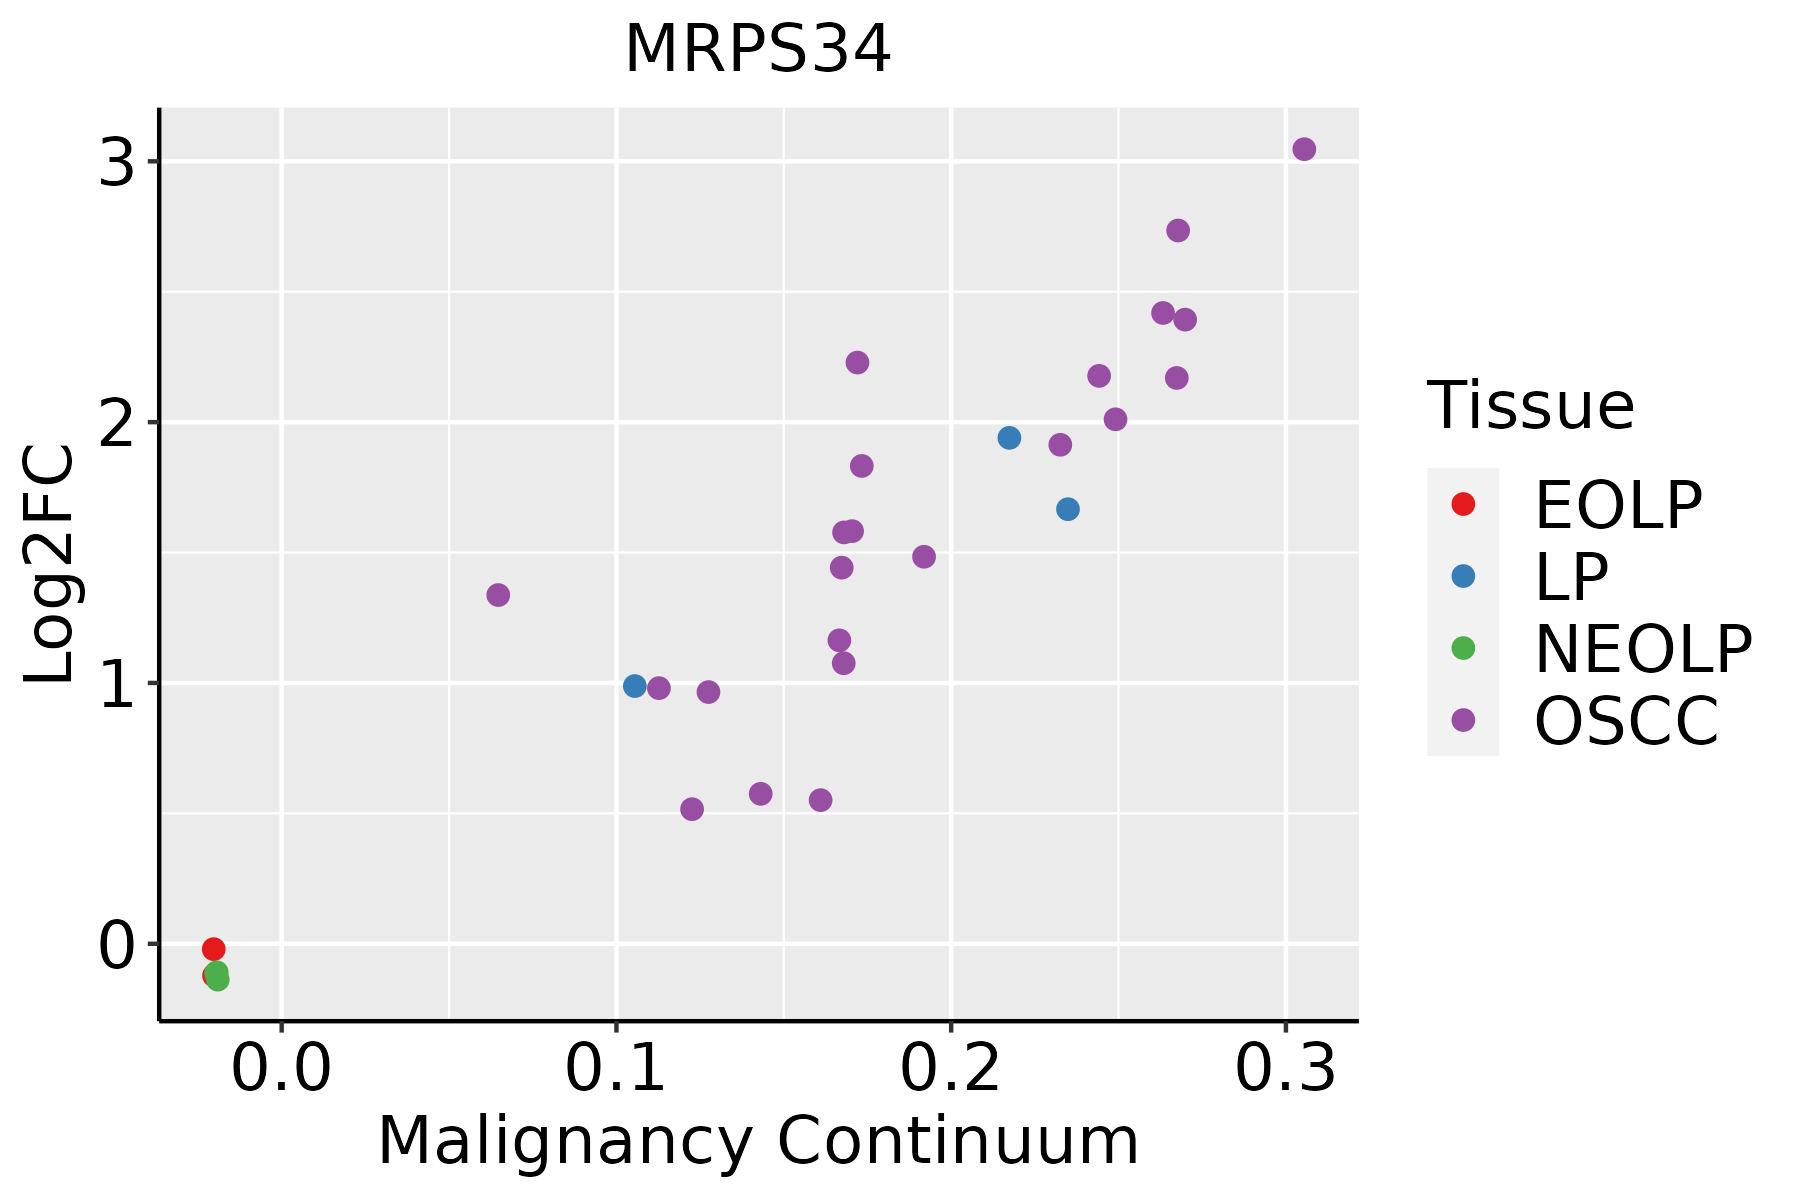 | EOLP: Erosive Oral lichen planus |
| LP: leukoplakia | ||
| NEOLP: Non-erosive oral lichen planus | ||
| OSCC: Oral squamous cell carcinoma | ||
| Prostate | 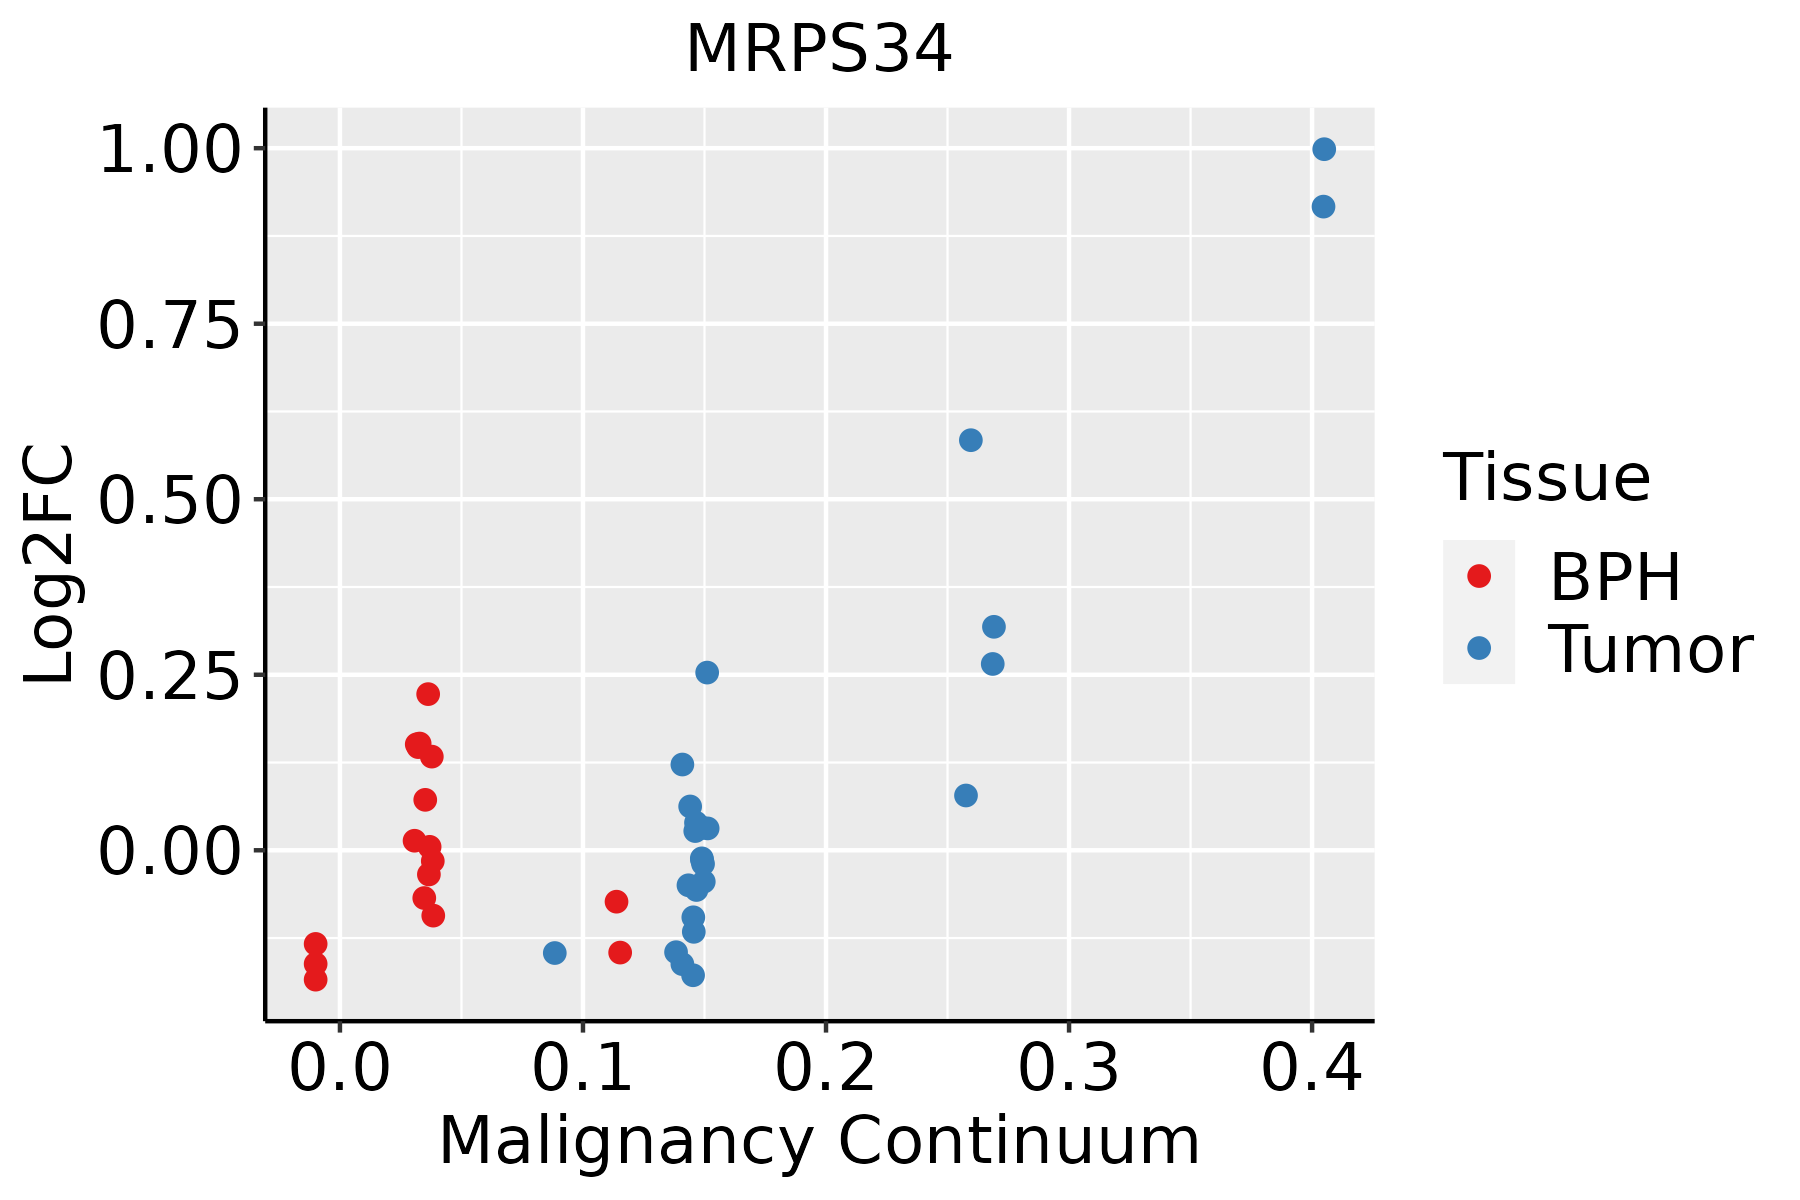 | BPH: Benign Prostatic Hyperplasia |
| Skin | 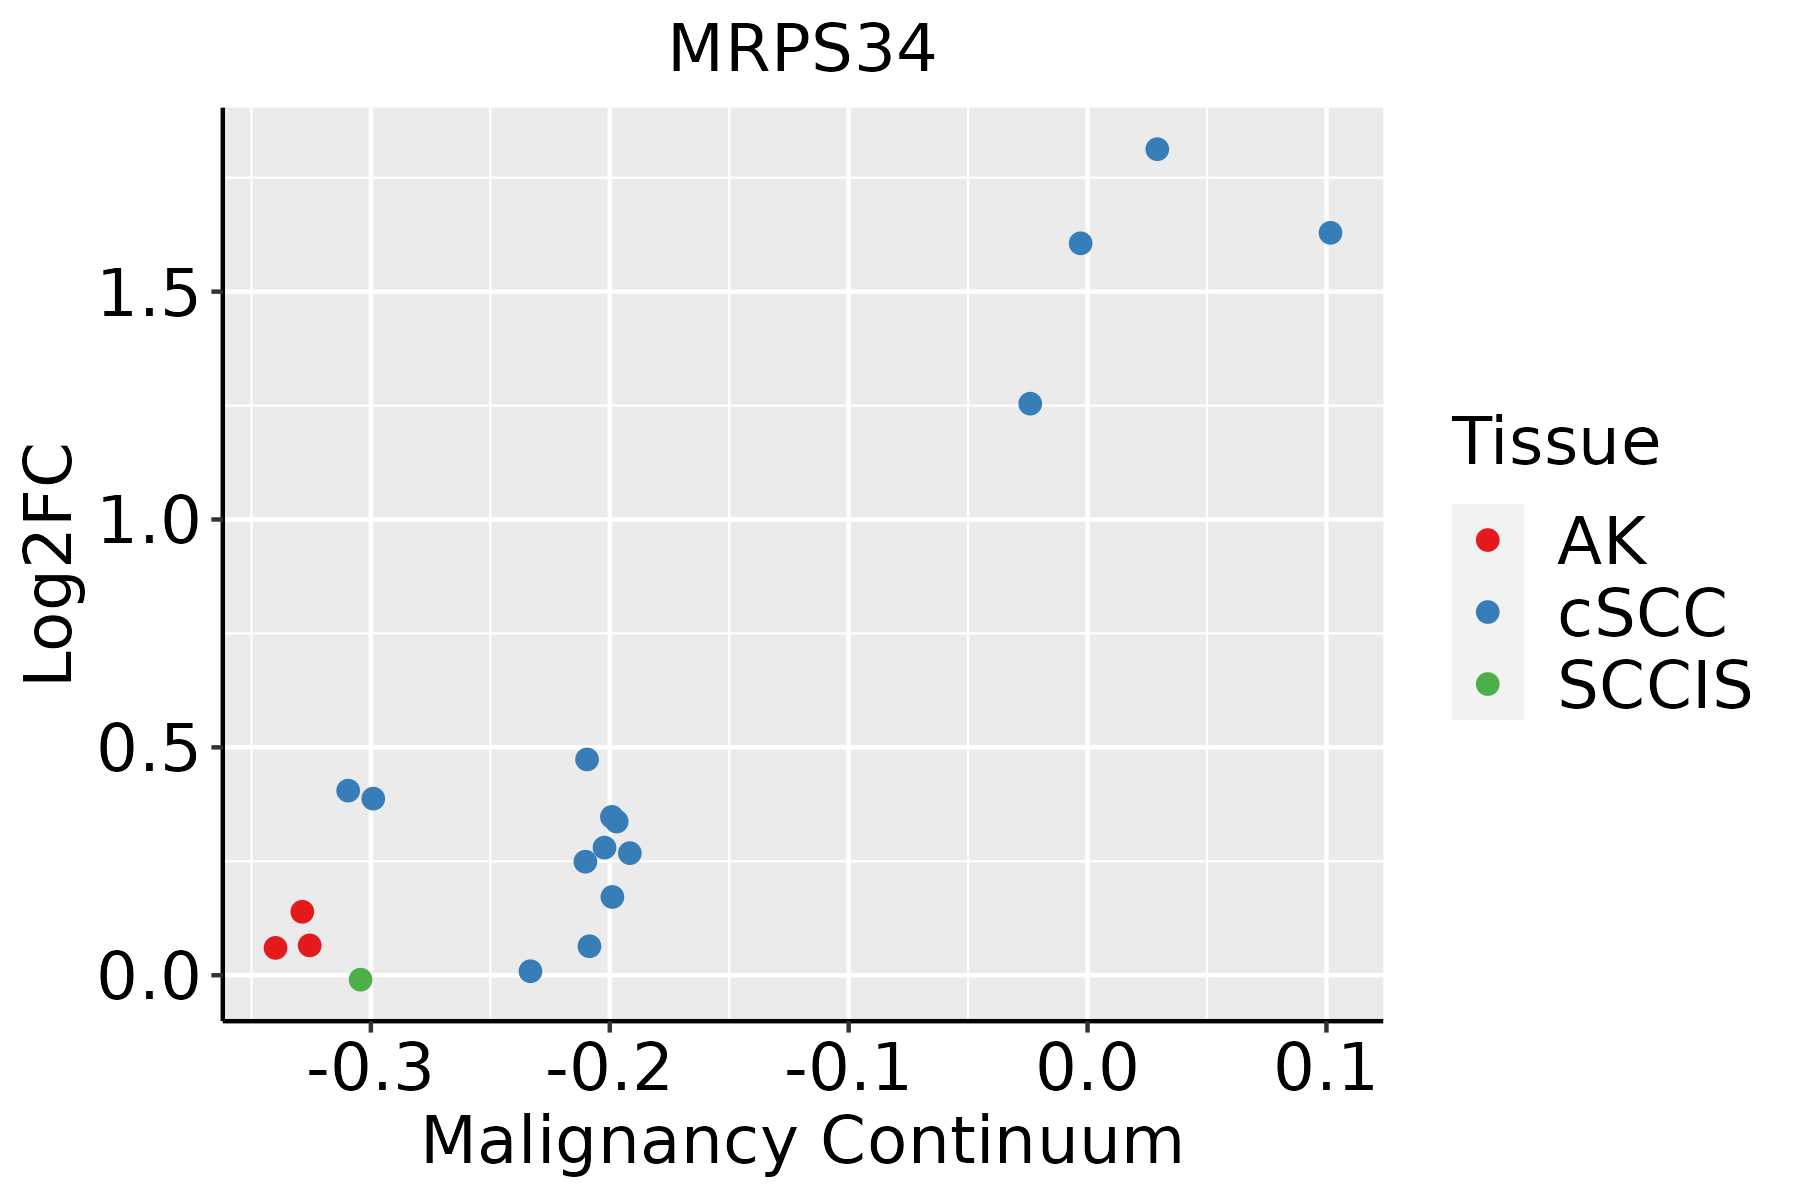 | AK: Actinic keratosis |
| cSCC: Cutaneous squamous cell carcinoma | ||
| SCCIS:squamous cell carcinoma in situ | ||
| Thyroid |  | ATC: Anaplastic thyroid cancer |
| HT: Hashimoto's thyroiditis | ||
| PTC: Papillary thyroid cancer |
| ∗log2FC in expression of this searched gene in stem-like cells from each diseased tissue sample relative to stem-like cells in normal samples in each tissue plotted against the malignancy continuum. Samples are colored based on if they are from different disease stage. |
Top |
Malignant transformation related pathway analysis |
| Find out the enriched GO biological processes and KEGG pathways involved in transition from healthy to precancer to cancer |
| Tissue | Disease Stage | Enriched GO biological Processes |
| Colorectum | AD |  |
| Colorectum | SER |  |
| Colorectum | MSS |  |
| Colorectum | MSI-H |  |
| Colorectum | FAP |  |
| ∗Top 15 enriched GO BP terms are showed in the bar plot of each disease state in each tissue. Each row represents a significant GO biological process which is colored according to the -log10(p.adjust). |
| Page: 1 2 3 4 5 6 7 8 9 |
| GO ID | Tissue | Disease Stage | Description | Gene Ratio | Bg Ratio | pvalue | p.adjust | Count |
| GO:00325432 | Breast | IDC | mitochondrial translation | 13/1434 | 76/18723 | 4.81e-03 | 3.67e-02 | 13 |
| GO:003254311 | Breast | DCIS | mitochondrial translation | 13/1390 | 76/18723 | 3.70e-03 | 2.99e-02 | 13 |
| GO:00325435 | Esophagus | HGIN | mitochondrial translation | 23/2587 | 76/18723 | 1.61e-04 | 3.16e-03 | 23 |
| GO:01400534 | Esophagus | HGIN | mitochondrial gene expression | 27/2587 | 108/18723 | 1.34e-03 | 1.57e-02 | 27 |
| GO:014005313 | Esophagus | ESCC | mitochondrial gene expression | 93/8552 | 108/18723 | 1.96e-18 | 2.03e-16 | 93 |
| GO:003254314 | Esophagus | ESCC | mitochondrial translation | 68/8552 | 76/18723 | 1.02e-15 | 6.86e-14 | 68 |
| GO:0032543 | Liver | Cirrhotic | mitochondrial translation | 40/4634 | 76/18723 | 1.61e-07 | 4.29e-06 | 40 |
| GO:0140053 | Liver | Cirrhotic | mitochondrial gene expression | 49/4634 | 108/18723 | 2.35e-06 | 4.31e-05 | 49 |
| GO:01400531 | Liver | HCC | mitochondrial gene expression | 82/7958 | 108/18723 | 1.49e-12 | 7.20e-11 | 82 |
| GO:00325431 | Liver | HCC | mitochondrial translation | 62/7958 | 76/18723 | 2.95e-12 | 1.34e-10 | 62 |
| GO:01400533 | Oral cavity | OSCC | mitochondrial gene expression | 78/7305 | 108/18723 | 2.37e-12 | 9.86e-11 | 78 |
| GO:00325434 | Oral cavity | OSCC | mitochondrial translation | 59/7305 | 76/18723 | 7.21e-12 | 2.70e-10 | 59 |
| GO:003254313 | Oral cavity | LP | mitochondrial translation | 43/4623 | 76/18723 | 2.85e-09 | 1.26e-07 | 43 |
| GO:014005312 | Oral cavity | LP | mitochondrial gene expression | 53/4623 | 108/18723 | 3.54e-08 | 1.27e-06 | 53 |
| GO:00325433 | Prostate | BPH | mitochondrial translation | 23/3107 | 76/18723 | 2.21e-03 | 1.22e-02 | 23 |
| GO:01400532 | Prostate | BPH | mitochondrial gene expression | 29/3107 | 108/18723 | 4.68e-03 | 2.25e-02 | 29 |
| GO:003254312 | Prostate | Tumor | mitochondrial translation | 24/3246 | 76/18723 | 1.73e-03 | 1.03e-02 | 24 |
| GO:014005311 | Prostate | Tumor | mitochondrial gene expression | 31/3246 | 108/18723 | 2.31e-03 | 1.30e-02 | 31 |
| GO:00325436 | Skin | cSCC | mitochondrial translation | 47/4864 | 76/18723 | 4.70e-11 | 2.22e-09 | 47 |
| GO:01400535 | Skin | cSCC | mitochondrial gene expression | 56/4864 | 108/18723 | 8.06e-09 | 2.56e-07 | 56 |
| Page: 1 2 |
| Pathway ID | Tissue | Disease Stage | Description | Gene Ratio | Bg Ratio | pvalue | p.adjust | qvalue | Count |
| Page: 1 |
Top |
Cell-cell communication analysis |
| Identification of potential cell-cell interactions between two cell types and their ligand-receptor pairs for different disease states |
| Ligand | Receptor | LRpair | Pathway | Tissue | Disease Stage |
| Page: 1 |
Top |
Single-cell gene regulatory network inference analysis |
| Find out the significant the regulons (TFs) and the target genes of each regulon across cell types for different disease states |
| TF | Cell Type | Tissue | Disease Stage | Target Gene | RSS | Regulon Activity |
| ∗The dot plots of a searched regulon are shown for all cell subpopulations in each disease state of each tissue based on the regulon specific score inferred using pySCENIC and by calculating the average expression. |
| Page: 1 |
Top |
Somatic mutation of malignant transformation related genes |
| Annotation of somatic variants for genes involved in malignant transformation |
| Hugo Symbol | Variant Class | Variant Classification | dbSNP RS | HGVSc | HGVSp | HGVSp Short | SWISSPROT | BIOTYPE | SIFT | PolyPhen | Tumor Sample Barcode | Tissue | Histology | Sex | Age | Stage | Therapy Types | Drugs | Outcome |
| MRPS34 | SNV | Missense_Mutation | c.400N>A | p.Glu134Lys | p.E134K | protein_coding | tolerated(0.37) | benign(0.007) | TCGA-AC-A23H-01 | Breast | breast invasive carcinoma | Female | >=65 | I/II | Unknown | Unknown | PD | ||
| MRPS34 | SNV | Missense_Mutation | rs775283120 | c.446T>G | p.Val149Gly | p.V149G | protein_coding | deleterious(0) | probably_damaging(0.956) | TCGA-BH-A0BP-01 | Breast | breast invasive carcinoma | Female | >=65 | I/II | Unknown | Unknown | SD | |
| MRPS34 | SNV | Missense_Mutation | novel | c.117N>T | p.Glu39Asp | p.E39D | protein_coding | tolerated_low_confidence(0.18) | benign(0.006) | TCGA-AA-A010-01 | Colorectum | colon adenocarcinoma | Female | <65 | I/II | Chemotherapy | folinic | CR | |
| MRPS34 | deletion | Frame_Shift_Del | novel | c.672delN | p.Val225SerfsTer? | p.V225Sfs*? | protein_coding | TCGA-AX-A2HJ-01 | Endometrium | uterine corpus endometrioid carcinoma | Female | <65 | I/II | Unknown | Unknown | SD | |||
| MRPS34 | SNV | Missense_Mutation | novel | c.414C>G | p.Ile138Met | p.I138M | protein_coding | tolerated(0.14) | benign(0.127) | TCGA-63-A5MY-01 | Lung | lung squamous cell carcinoma | Male | <65 | I/II | Unknown | Unknown | SD |
| Page: 1 |
Top |
Related drugs of malignant transformation related genes |
| Identification of chemicals and drugs interact with genes involved in malignant transfromation |
| (DGIdb 4.0) |
| Entrez ID | Symbol | Category | Interaction Types | Drug Claim Name | Drug Name | PMIDs |
| Page: 1 |

Copyright 2023-Present -The University of Texas Health Science Center at Houston |