
|
|||||
|
 | |
| |
| |
| |
| |
| |
|
Gene: MRPS30 |
Gene summary for MRPS30 |
| Gene information | Species | Human | Gene symbol | MRPS30 | Gene ID | 10884 |
| Gene name | mitochondrial ribosomal protein S30 | |
| Gene Alias | MRP-S30 | |
| Cytomap | 5p12 | |
| Gene Type | protein-coding | GO ID | GO:0006412 | UniProtAcc | Q9NP92 |
Top |
Malignant transformation analysis |
| Identification of the aberrant gene expression in precancerous and cancerous lesions by comparing the gene expression of stem-like cells in diseased tissues with normal stem cells |
| Entrez ID | Symbol | Replicates | Species | Organ | Tissue | Adj P-value | Log2FC | Malignancy |
| 10884 | MRPS30 | GSM4909306 | Human | Breast | IDC | 5.51e-36 | 8.37e-01 | 0.1564 |
| 10884 | MRPS30 | GSM4909307 | Human | Breast | IDC | 8.81e-38 | 8.39e-01 | 0.1569 |
| 10884 | MRPS30 | GSM4909308 | Human | Breast | IDC | 2.46e-97 | 1.28e+00 | 0.158 |
| 10884 | MRPS30 | GSM4909311 | Human | Breast | IDC | 1.77e-04 | -1.35e-01 | 0.1534 |
| 10884 | MRPS30 | GSM4909319 | Human | Breast | IDC | 7.70e-04 | -3.65e-02 | 0.1563 |
| 10884 | MRPS30 | GSM4909321 | Human | Breast | IDC | 7.29e-04 | 2.10e-01 | 0.1559 |
| 10884 | MRPS30 | brca1 | Human | Breast | Precancer | 1.65e-05 | 1.87e-01 | -0.0338 |
| 10884 | MRPS30 | NCCBC3 | Human | Breast | DCIS | 4.24e-05 | 3.25e-01 | 0.1198 |
| 10884 | MRPS30 | P3 | Human | Breast | IDC | 2.93e-15 | 9.98e-01 | 0.1542 |
| 10884 | MRPS30 | DCIS2 | Human | Breast | DCIS | 2.27e-24 | 4.60e-02 | 0.0085 |
| 10884 | MRPS30 | LZE4T | Human | Esophagus | ESCC | 4.81e-17 | 2.55e-01 | 0.0811 |
| 10884 | MRPS30 | LZE7T | Human | Esophagus | ESCC | 2.82e-06 | 5.50e-01 | 0.0667 |
| 10884 | MRPS30 | LZE8T | Human | Esophagus | ESCC | 4.24e-05 | 1.36e-01 | 0.067 |
| 10884 | MRPS30 | LZE24T | Human | Esophagus | ESCC | 1.93e-11 | 3.01e-01 | 0.0596 |
| 10884 | MRPS30 | LZE6T | Human | Esophagus | ESCC | 3.35e-04 | 3.90e-01 | 0.0845 |
| 10884 | MRPS30 | P2T-E | Human | Esophagus | ESCC | 1.06e-23 | 3.60e-01 | 0.1177 |
| 10884 | MRPS30 | P4T-E | Human | Esophagus | ESCC | 7.56e-28 | 8.73e-01 | 0.1323 |
| 10884 | MRPS30 | P5T-E | Human | Esophagus | ESCC | 5.40e-28 | 7.93e-01 | 0.1327 |
| 10884 | MRPS30 | P8T-E | Human | Esophagus | ESCC | 2.43e-26 | 4.27e-01 | 0.0889 |
| 10884 | MRPS30 | P9T-E | Human | Esophagus | ESCC | 2.34e-22 | 3.91e-01 | 0.1131 |
| Page: 1 2 3 4 5 6 7 |
| Tissue | Expression Dynamics | Abbreviation |
| Breast |  | IDC: Invasive ductal carcinoma |
| DCIS: Ductal carcinoma in situ | ||
| Precancer(BRCA1-mut): Precancerous lesion from BRCA1 mutation carriers | ||
| Esophagus | 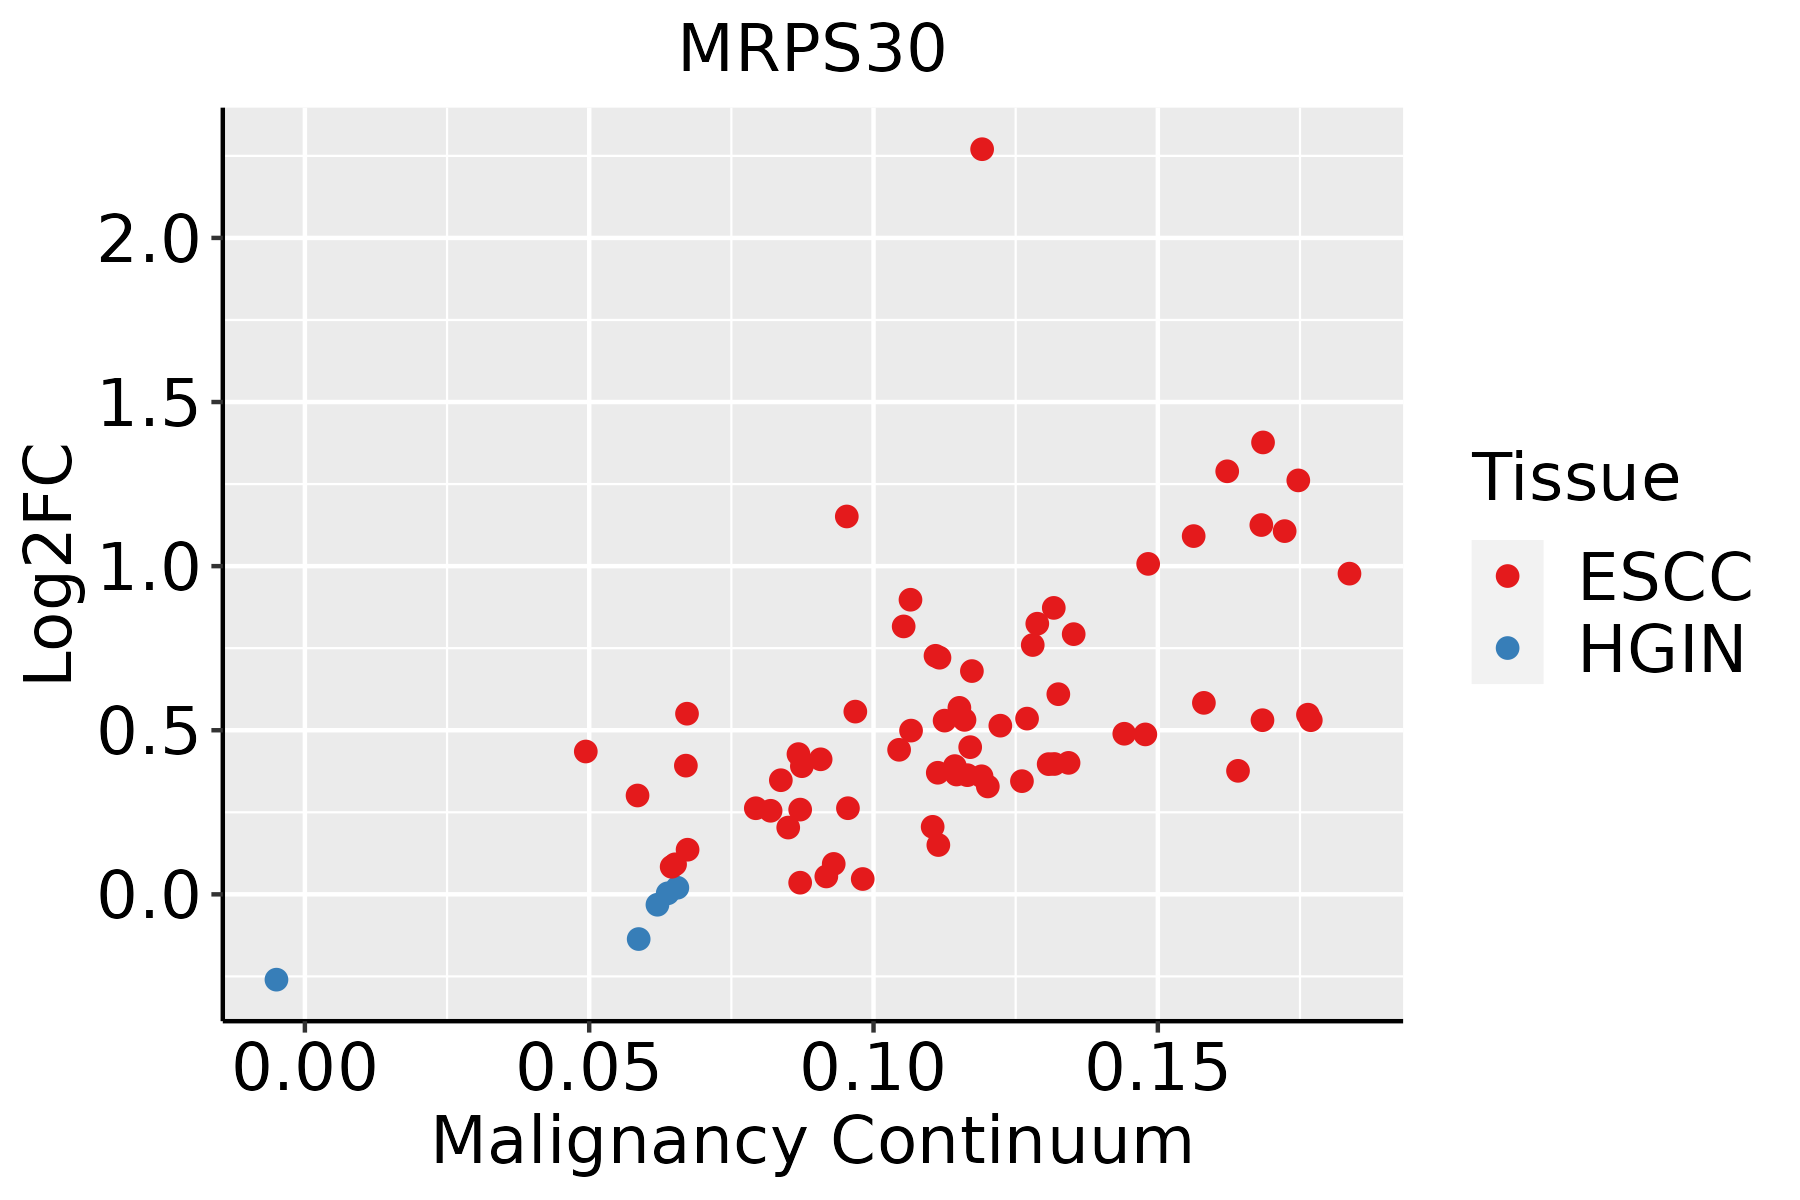 | ESCC: Esophageal squamous cell carcinoma |
| HGIN: High-grade intraepithelial neoplasias | ||
| LGIN: Low-grade intraepithelial neoplasias | ||
| Liver |  | HCC: Hepatocellular carcinoma |
| NAFLD: Non-alcoholic fatty liver disease | ||
| Oral Cavity | 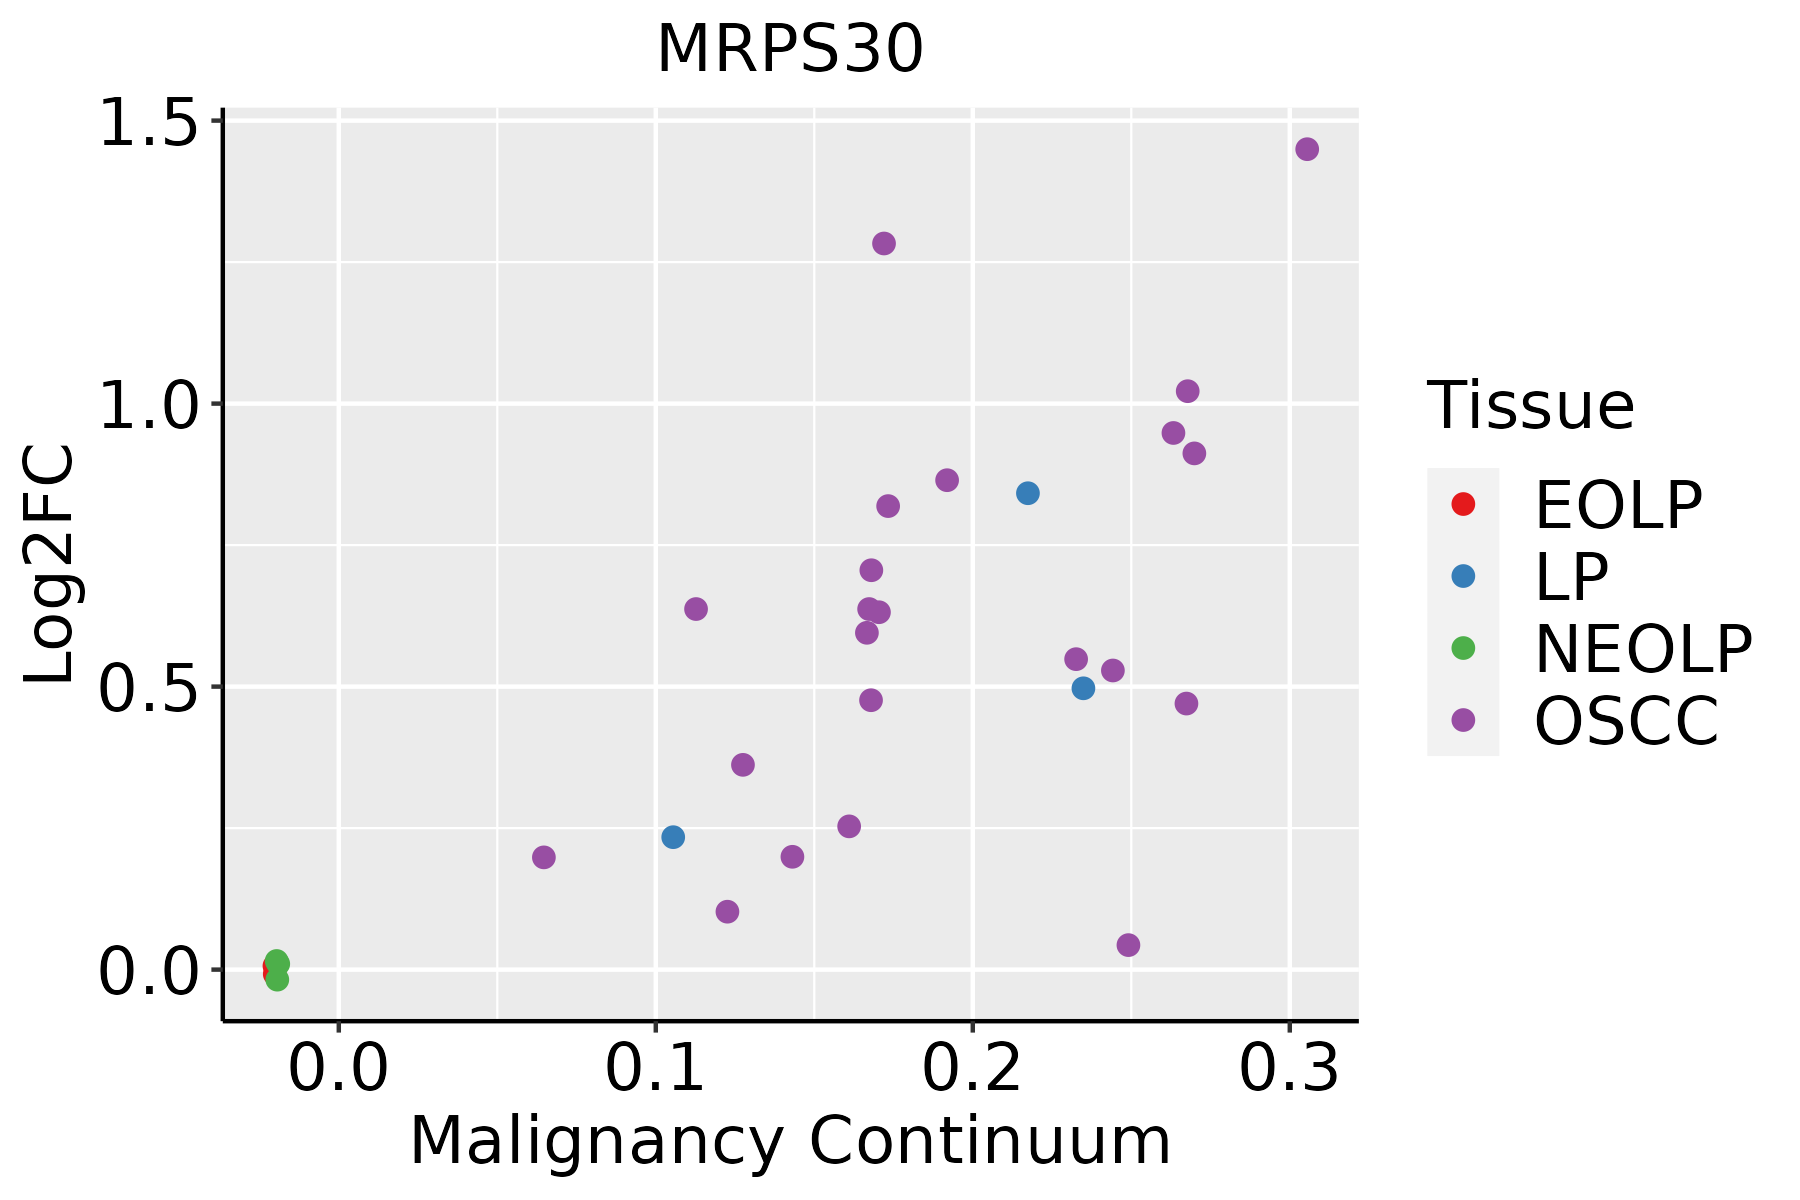 | EOLP: Erosive Oral lichen planus |
| LP: leukoplakia | ||
| NEOLP: Non-erosive oral lichen planus | ||
| OSCC: Oral squamous cell carcinoma | ||
| Skin |  | AK: Actinic keratosis |
| cSCC: Cutaneous squamous cell carcinoma | ||
| SCCIS:squamous cell carcinoma in situ | ||
| Thyroid | 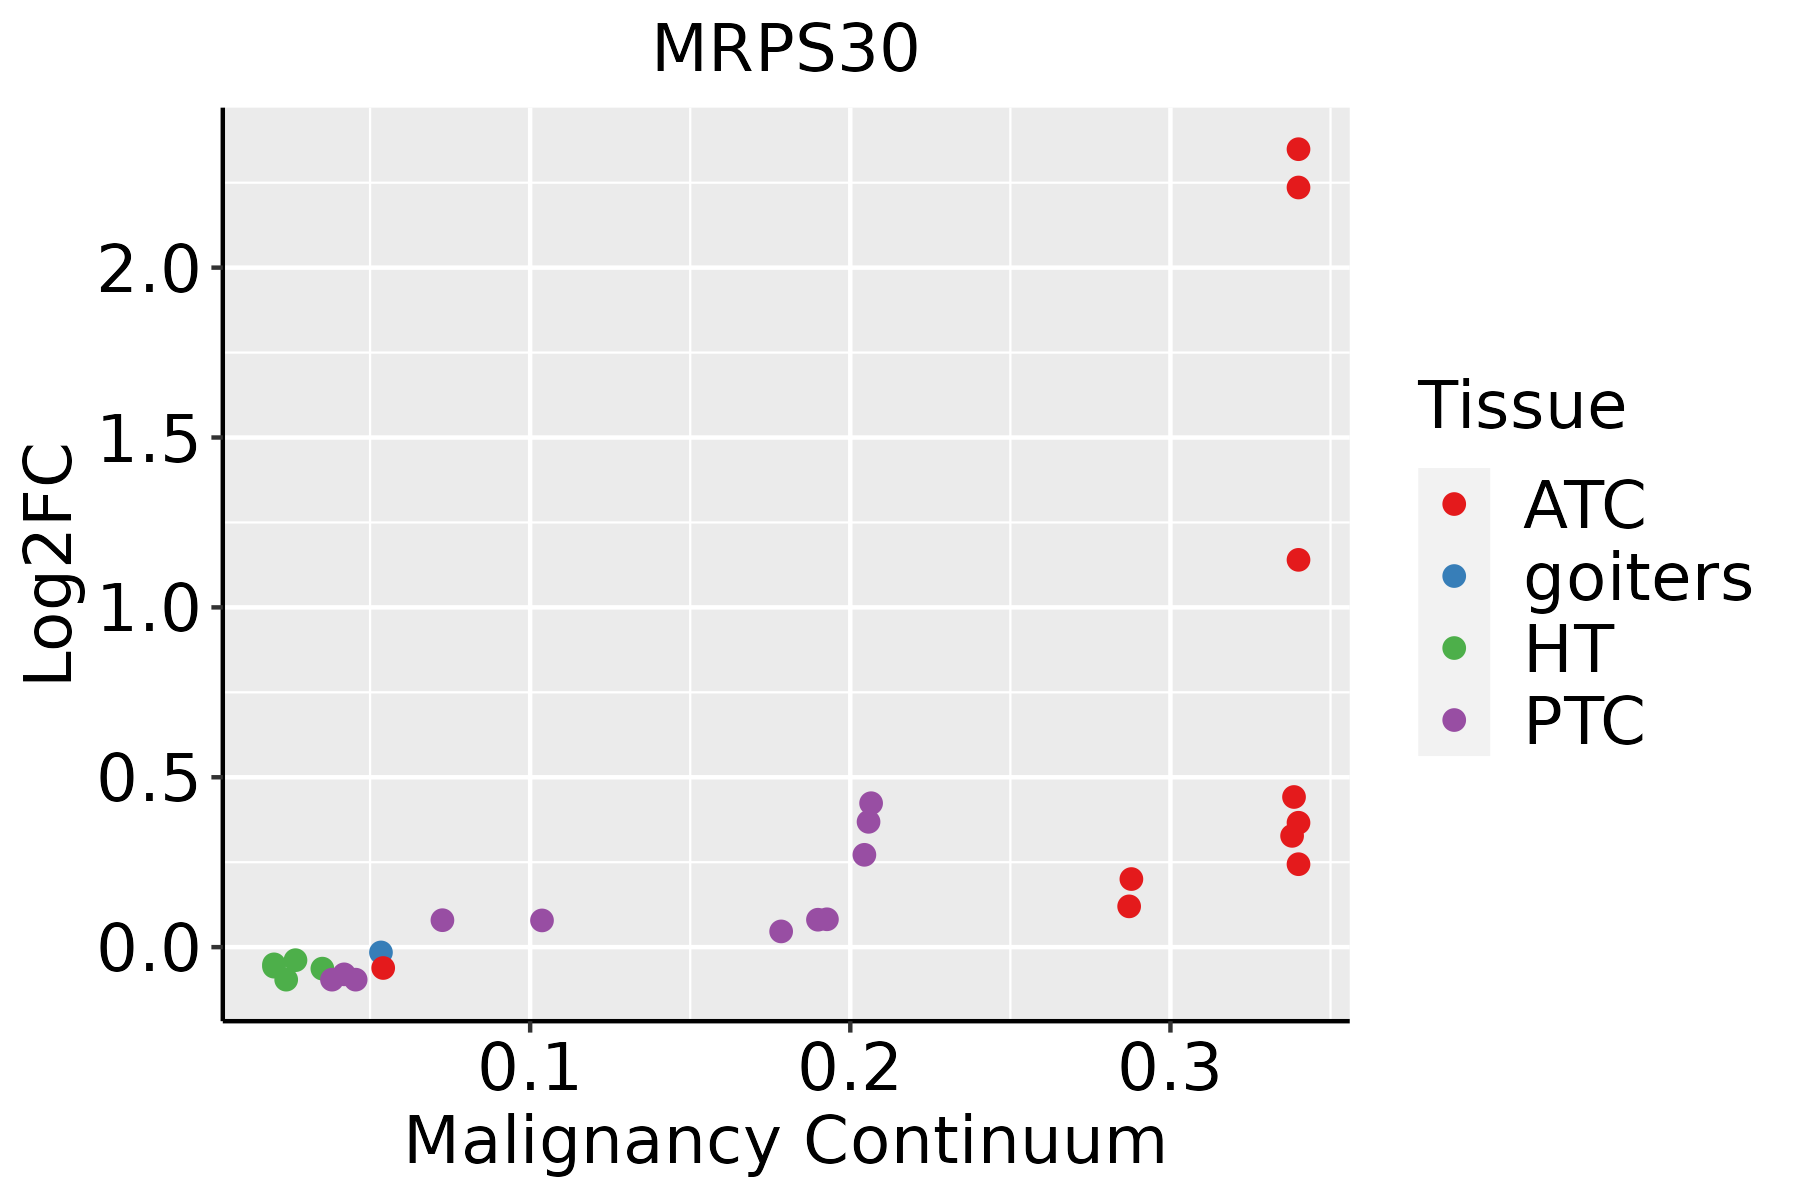 | ATC: Anaplastic thyroid cancer |
| HT: Hashimoto's thyroiditis | ||
| PTC: Papillary thyroid cancer |
| ∗log2FC in expression of this searched gene in stem-like cells from each diseased tissue sample relative to stem-like cells in normal samples in each tissue plotted against the malignancy continuum. Samples are colored based on if they are from different disease stage. |
Top |
Malignant transformation related pathway analysis |
| Find out the enriched GO biological processes and KEGG pathways involved in transition from healthy to precancer to cancer |
| Tissue | Disease Stage | Enriched GO biological Processes |
| Colorectum | AD |  |
| Colorectum | SER |  |
| Colorectum | MSS |  |
| Colorectum | MSI-H |  |
| Colorectum | FAP |  |
| ∗Top 15 enriched GO BP terms are showed in the bar plot of each disease state in each tissue. Each row represents a significant GO biological process which is colored according to the -log10(p.adjust). |
| Page: 1 2 3 4 5 6 7 8 9 |
| GO ID | Tissue | Disease Stage | Description | Gene Ratio | Bg Ratio | pvalue | p.adjust | Count |
| Page: 1 |
| Pathway ID | Tissue | Disease Stage | Description | Gene Ratio | Bg Ratio | pvalue | p.adjust | qvalue | Count |
| Page: 1 |
Top |
Cell-cell communication analysis |
| Identification of potential cell-cell interactions between two cell types and their ligand-receptor pairs for different disease states |
| Ligand | Receptor | LRpair | Pathway | Tissue | Disease Stage |
| Page: 1 |
Top |
Single-cell gene regulatory network inference analysis |
| Find out the significant the regulons (TFs) and the target genes of each regulon across cell types for different disease states |
| TF | Cell Type | Tissue | Disease Stage | Target Gene | RSS | Regulon Activity |
| ∗The dot plots of a searched regulon are shown for all cell subpopulations in each disease state of each tissue based on the regulon specific score inferred using pySCENIC and by calculating the average expression. |
| Page: 1 |
Top |
Somatic mutation of malignant transformation related genes |
| Annotation of somatic variants for genes involved in malignant transformation |
| Hugo Symbol | Variant Class | Variant Classification | dbSNP RS | HGVSc | HGVSp | HGVSp Short | SWISSPROT | BIOTYPE | SIFT | PolyPhen | Tumor Sample Barcode | Tissue | Histology | Sex | Age | Stage | Therapy Types | Drugs | Outcome |
| MRPS30 | SNV | Missense_Mutation | c.949G>A | p.Ala317Thr | p.A317T | Q9NP92 | protein_coding | tolerated(0.35) | possibly_damaging(0.657) | TCGA-DS-A0VM-01 | Cervix | cervical & endocervical cancer | Female | <65 | I/II | Chemotherapy | cisplatin | PD | |
| MRPS30 | SNV | Missense_Mutation | novel | c.113C>T | p.Ala38Val | p.A38V | Q9NP92 | protein_coding | tolerated(0.08) | benign(0.022) | TCGA-ZJ-AAXD-01 | Cervix | cervical & endocervical cancer | Female | <65 | III/IV | Unknown | Unknown | SD |
| MRPS30 | SNV | Missense_Mutation | rs534375825 | c.634C>T | p.Arg212Cys | p.R212C | Q9NP92 | protein_coding | deleterious(0.02) | benign(0.111) | TCGA-AA-3950-01 | Colorectum | colon adenocarcinoma | Female | >=65 | I/II | Unknown | Unknown | SD |
| MRPS30 | SNV | Missense_Mutation | c.253N>G | p.Lys85Glu | p.K85E | Q9NP92 | protein_coding | deleterious(0.01) | possibly_damaging(0.858) | TCGA-AD-6964-01 | Colorectum | colon adenocarcinoma | Male | <65 | III/IV | Chemotherapy | folfox | PD | |
| MRPS30 | SNV | Missense_Mutation | rs780785088 | c.689N>A | p.Arg230Gln | p.R230Q | Q9NP92 | protein_coding | deleterious(0) | probably_damaging(0.998) | TCGA-AZ-4615-01 | Colorectum | colon adenocarcinoma | Male | >=65 | III/IV | Chemotherapy | xeloda | PD |
| MRPS30 | SNV | Missense_Mutation | c.518N>A | p.Ser173Tyr | p.S173Y | Q9NP92 | protein_coding | tolerated(0.82) | benign(0.038) | TCGA-CA-6717-01 | Colorectum | colon adenocarcinoma | Male | <65 | I/II | Chemotherapy | oxaliplatin | CR | |
| MRPS30 | SNV | Missense_Mutation | c.1182G>T | p.Trp394Cys | p.W394C | Q9NP92 | protein_coding | deleterious(0) | probably_damaging(1) | TCGA-CM-4743-01 | Colorectum | colon adenocarcinoma | Male | >=65 | I/II | Chemotherapy | capecitabine | SD | |
| MRPS30 | SNV | Missense_Mutation | c.1150N>A | p.Asp384Asn | p.D384N | Q9NP92 | protein_coding | deleterious(0.04) | benign(0.206) | TCGA-CM-5863-01 | Colorectum | colon adenocarcinoma | Female | <65 | III/IV | Chemotherapy | oxaliplatin | SD | |
| MRPS30 | SNV | Missense_Mutation | c.778G>A | p.Glu260Lys | p.E260K | Q9NP92 | protein_coding | deleterious(0.02) | possibly_damaging(0.871) | TCGA-AG-A002-01 | Colorectum | rectum adenocarcinoma | Male | <65 | I/II | Unknown | Unknown | SD | |
| MRPS30 | deletion | Frame_Shift_Del | rs764773638 | c.968delN | p.Phe324LeufsTer37 | p.F324Lfs*37 | Q9NP92 | protein_coding | TCGA-D5-6530-01 | Colorectum | colon adenocarcinoma | Male | <65 | I/II | Unknown | Unknown | SD |
| Page: 1 2 3 4 5 |
Top |
Related drugs of malignant transformation related genes |
| Identification of chemicals and drugs interact with genes involved in malignant transfromation |
| (DGIdb 4.0) |
| Entrez ID | Symbol | Category | Interaction Types | Drug Claim Name | Drug Name | PMIDs |
| Page: 1 |

Copyright 2023-Present -The University of Texas Health Science Center at Houston |