
|
|||||
|
 | |
| |
| |
| |
| |
| |
|
Gene: MRPS27 |
Gene summary for MRPS27 |
| Gene information | Species | Human | Gene symbol | MRPS27 | Gene ID | 23107 |
| Gene name | mitochondrial ribosomal protein S27 | |
| Gene Alias | MRP-S27 | |
| Cytomap | 5q13.2 | |
| Gene Type | protein-coding | GO ID | GO:0006412 | UniProtAcc | Q6PKB3 |
Top |
Malignant transformation analysis |
| Identification of the aberrant gene expression in precancerous and cancerous lesions by comparing the gene expression of stem-like cells in diseased tissues with normal stem cells |
| Entrez ID | Symbol | Replicates | Species | Organ | Tissue | Adj P-value | Log2FC | Malignancy |
| 23107 | MRPS27 | LZE2T | Human | Esophagus | ESCC | 3.32e-04 | 3.95e-01 | 0.082 |
| 23107 | MRPS27 | LZE4T | Human | Esophagus | ESCC | 1.84e-03 | 6.27e-02 | 0.0811 |
| 23107 | MRPS27 | LZE8T | Human | Esophagus | ESCC | 1.29e-05 | 1.56e-01 | 0.067 |
| 23107 | MRPS27 | LZE24T | Human | Esophagus | ESCC | 1.69e-12 | 2.77e-01 | 0.0596 |
| 23107 | MRPS27 | LZE6T | Human | Esophagus | ESCC | 1.38e-03 | 9.99e-02 | 0.0845 |
| 23107 | MRPS27 | P1T-E | Human | Esophagus | ESCC | 1.32e-02 | 2.11e-01 | 0.0875 |
| 23107 | MRPS27 | P2T-E | Human | Esophagus | ESCC | 5.31e-28 | 6.33e-01 | 0.1177 |
| 23107 | MRPS27 | P4T-E | Human | Esophagus | ESCC | 9.86e-16 | 3.01e-01 | 0.1323 |
| 23107 | MRPS27 | P5T-E | Human | Esophagus | ESCC | 9.33e-08 | 1.68e-01 | 0.1327 |
| 23107 | MRPS27 | P8T-E | Human | Esophagus | ESCC | 6.53e-13 | 6.57e-02 | 0.0889 |
| 23107 | MRPS27 | P9T-E | Human | Esophagus | ESCC | 2.26e-08 | 1.33e-01 | 0.1131 |
| 23107 | MRPS27 | P10T-E | Human | Esophagus | ESCC | 1.03e-17 | 1.42e-01 | 0.116 |
| 23107 | MRPS27 | P11T-E | Human | Esophagus | ESCC | 3.89e-14 | 4.30e-01 | 0.1426 |
| 23107 | MRPS27 | P12T-E | Human | Esophagus | ESCC | 1.43e-17 | 3.97e-01 | 0.1122 |
| 23107 | MRPS27 | P15T-E | Human | Esophagus | ESCC | 1.34e-18 | 5.09e-01 | 0.1149 |
| 23107 | MRPS27 | P16T-E | Human | Esophagus | ESCC | 5.61e-22 | 4.17e-01 | 0.1153 |
| 23107 | MRPS27 | P17T-E | Human | Esophagus | ESCC | 1.73e-04 | 2.39e-01 | 0.1278 |
| 23107 | MRPS27 | P19T-E | Human | Esophagus | ESCC | 3.72e-03 | 6.01e-01 | 0.1662 |
| 23107 | MRPS27 | P20T-E | Human | Esophagus | ESCC | 2.65e-12 | 3.18e-01 | 0.1124 |
| 23107 | MRPS27 | P21T-E | Human | Esophagus | ESCC | 1.53e-17 | 3.91e-01 | 0.1617 |
| Page: 1 2 3 4 5 |
| Tissue | Expression Dynamics | Abbreviation |
| Esophagus | 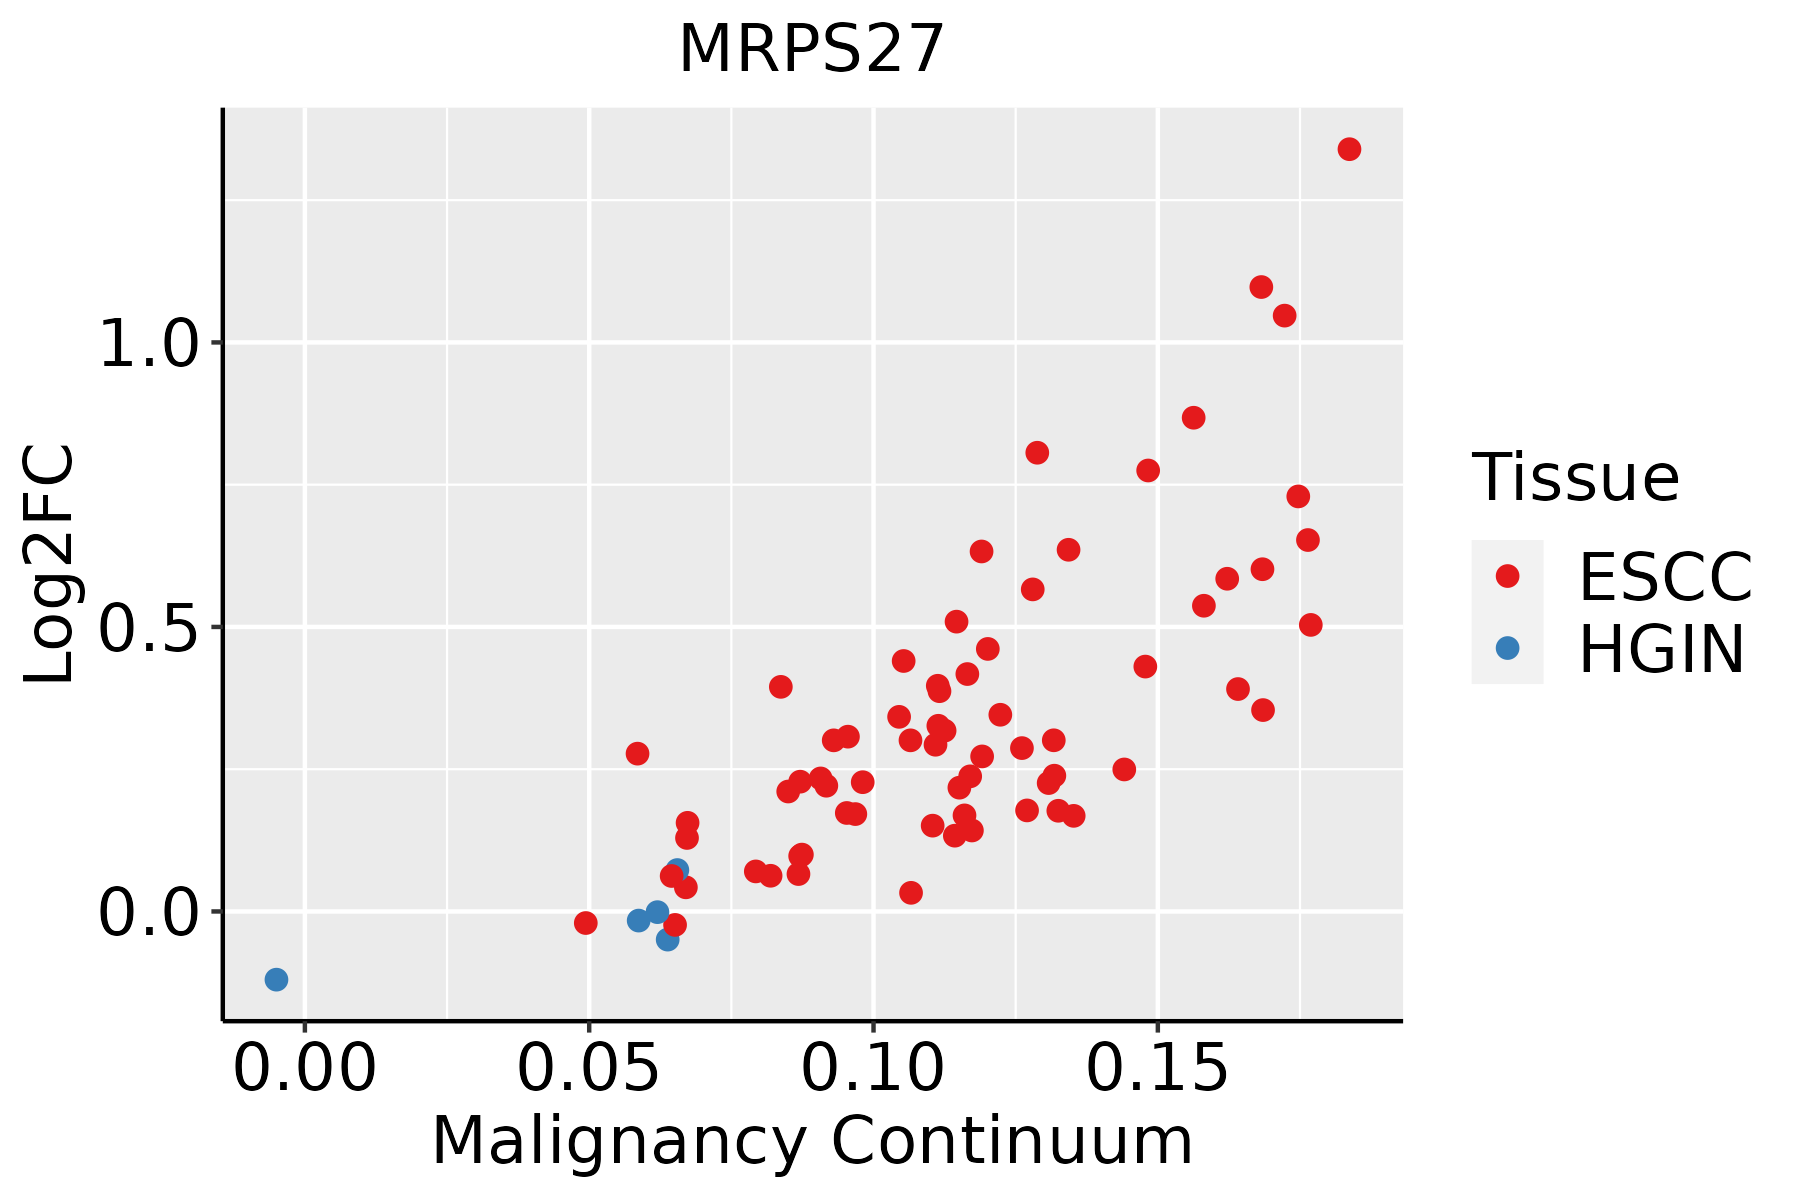 | ESCC: Esophageal squamous cell carcinoma |
| HGIN: High-grade intraepithelial neoplasias | ||
| LGIN: Low-grade intraepithelial neoplasias | ||
| Liver | 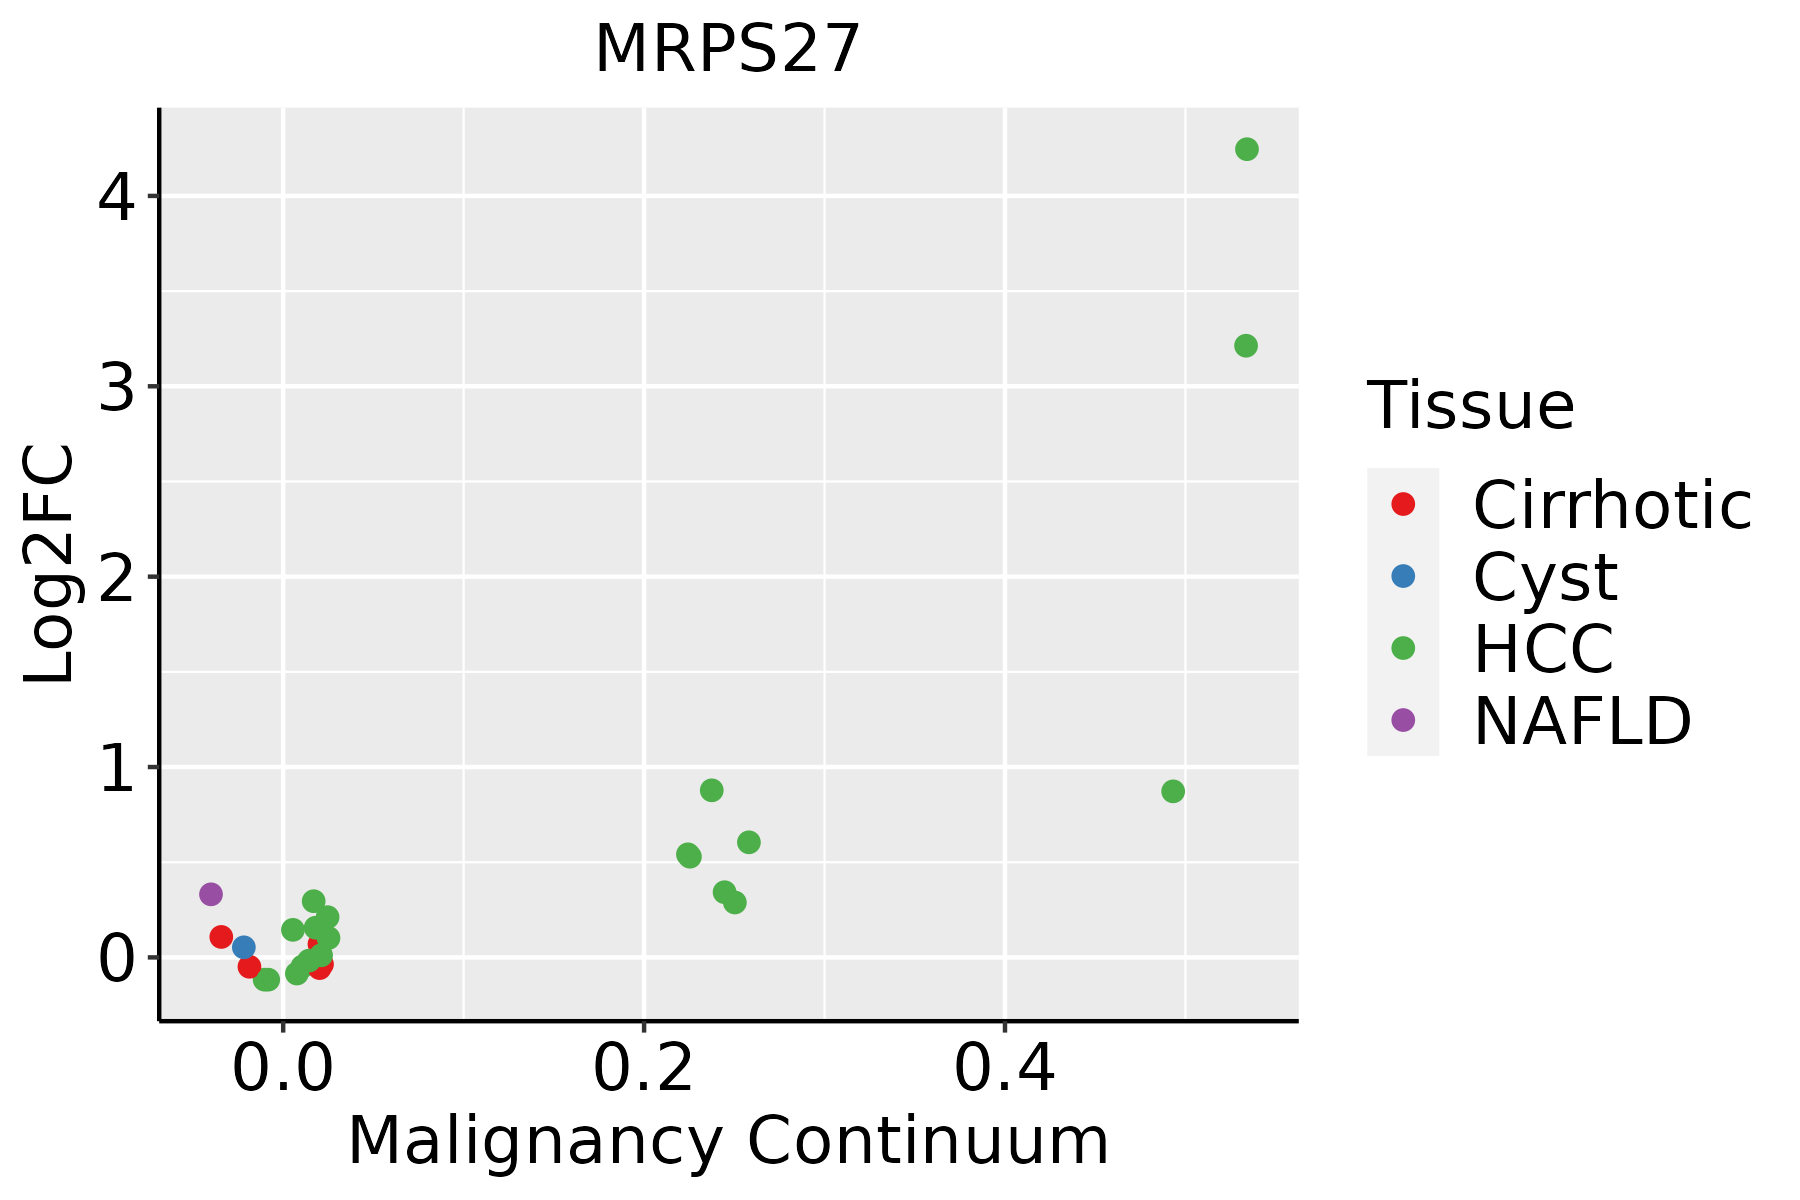 | HCC: Hepatocellular carcinoma |
| NAFLD: Non-alcoholic fatty liver disease | ||
| Oral Cavity | 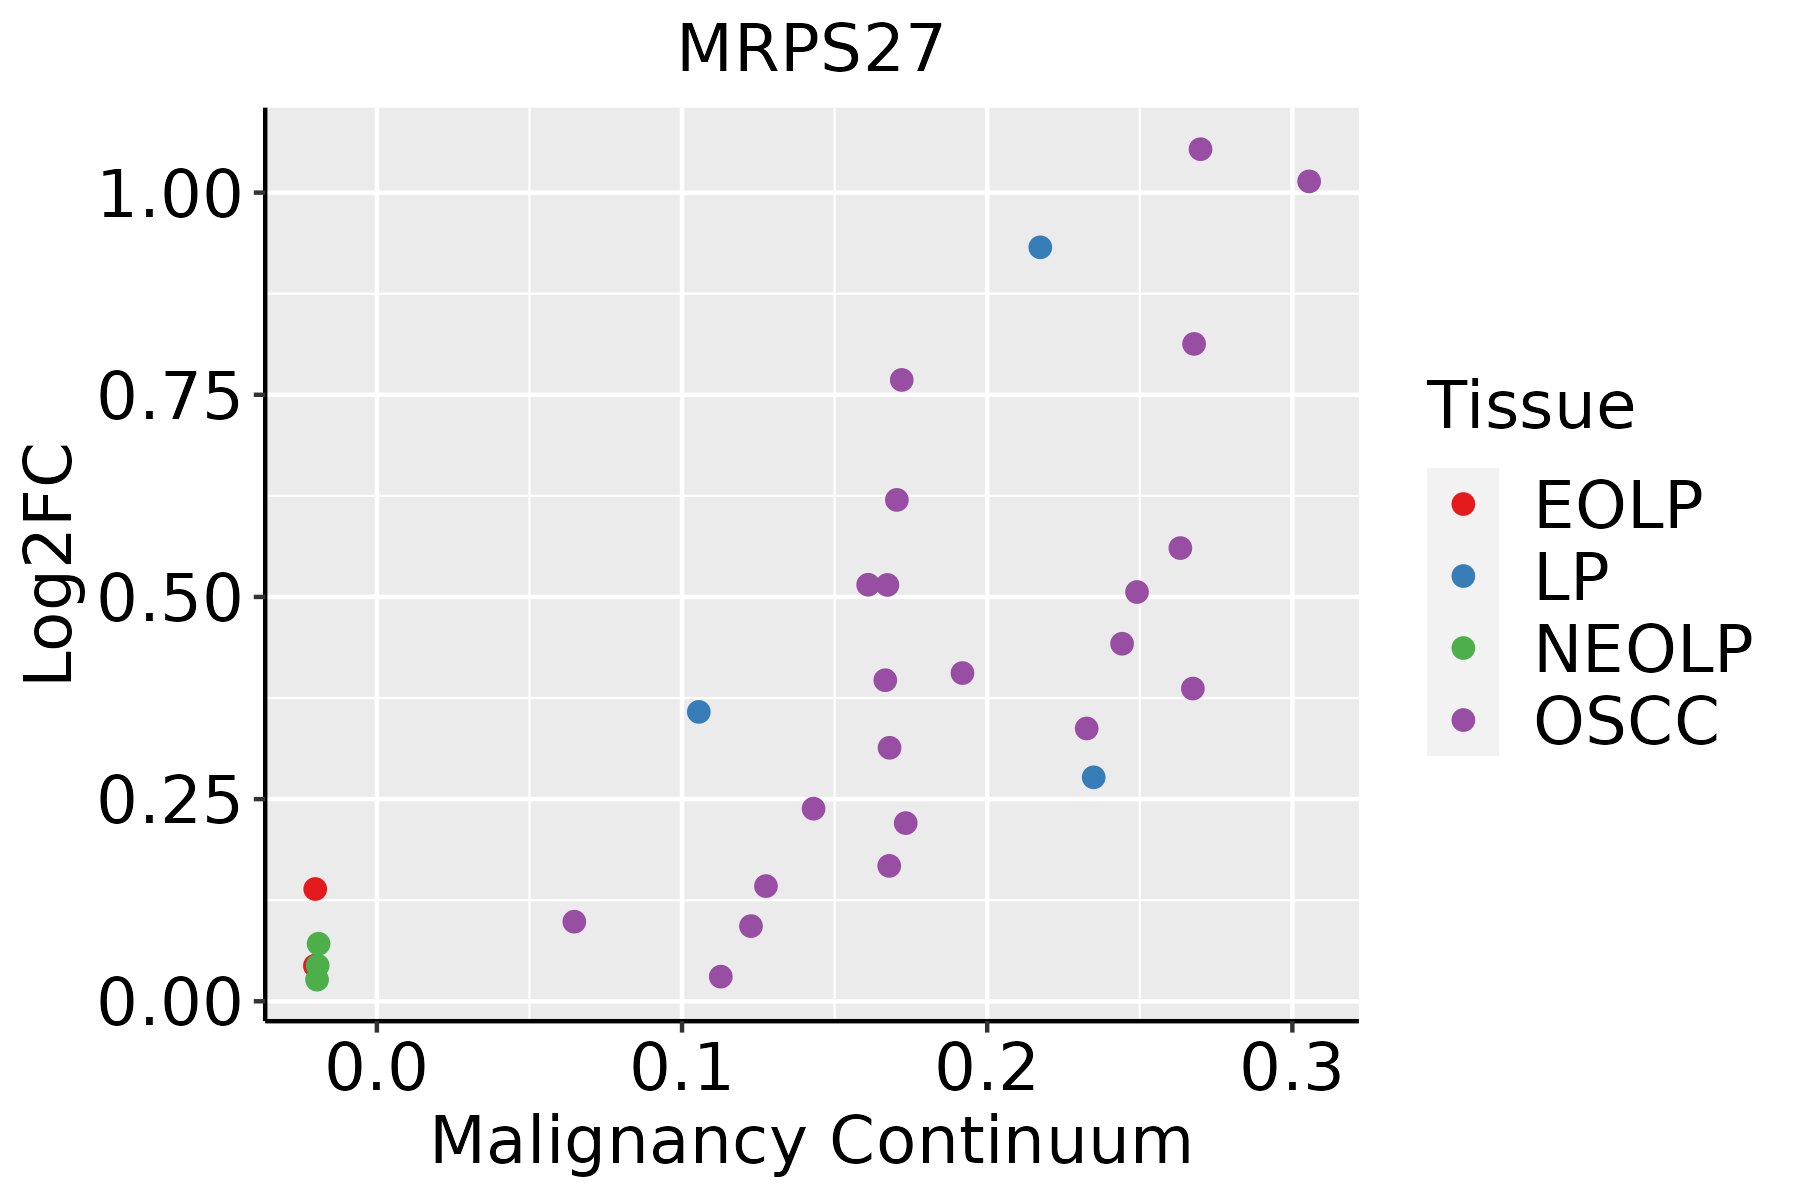 | EOLP: Erosive Oral lichen planus |
| LP: leukoplakia | ||
| NEOLP: Non-erosive oral lichen planus | ||
| OSCC: Oral squamous cell carcinoma | ||
| Skin |  | AK: Actinic keratosis |
| cSCC: Cutaneous squamous cell carcinoma | ||
| SCCIS:squamous cell carcinoma in situ |
| ∗log2FC in expression of this searched gene in stem-like cells from each diseased tissue sample relative to stem-like cells in normal samples in each tissue plotted against the malignancy continuum. Samples are colored based on if they are from different disease stage. |
Top |
Malignant transformation related pathway analysis |
| Find out the enriched GO biological processes and KEGG pathways involved in transition from healthy to precancer to cancer |
| Tissue | Disease Stage | Enriched GO biological Processes |
| Colorectum | AD |  |
| Colorectum | SER |  |
| Colorectum | MSS |  |
| Colorectum | MSI-H |  |
| Colorectum | FAP |  |
| ∗Top 15 enriched GO BP terms are showed in the bar plot of each disease state in each tissue. Each row represents a significant GO biological process which is colored according to the -log10(p.adjust). |
| Page: 1 2 3 4 5 6 7 8 9 |
| GO ID | Tissue | Disease Stage | Description | Gene Ratio | Bg Ratio | pvalue | p.adjust | Count |
| GO:014005313 | Esophagus | ESCC | mitochondrial gene expression | 93/8552 | 108/18723 | 1.96e-18 | 2.03e-16 | 93 |
| GO:0006417111 | Esophagus | ESCC | regulation of translation | 304/8552 | 468/18723 | 1.53e-17 | 1.33e-15 | 304 |
| GO:003254314 | Esophagus | ESCC | mitochondrial translation | 68/8552 | 76/18723 | 1.02e-15 | 6.86e-14 | 68 |
| GO:0045727111 | Esophagus | ESCC | positive regulation of translation | 107/8552 | 136/18723 | 2.79e-15 | 1.68e-13 | 107 |
| GO:0034250111 | Esophagus | ESCC | positive regulation of cellular amide metabolic process | 123/8552 | 162/18723 | 3.32e-15 | 1.93e-13 | 123 |
| GO:00701292 | Esophagus | ESCC | regulation of mitochondrial translation | 22/8552 | 24/18723 | 2.82e-06 | 3.21e-05 | 22 |
| GO:00621252 | Esophagus | ESCC | regulation of mitochondrial gene expression | 24/8552 | 28/18723 | 1.37e-05 | 1.25e-04 | 24 |
| GO:00701312 | Esophagus | ESCC | positive regulation of mitochondrial translation | 14/8552 | 15/18723 | 1.47e-04 | 9.85e-04 | 14 |
| GO:000641722 | Liver | HCC | regulation of translation | 287/7958 | 468/18723 | 8.79e-17 | 8.08e-15 | 287 |
| GO:01400531 | Liver | HCC | mitochondrial gene expression | 82/7958 | 108/18723 | 1.49e-12 | 7.20e-11 | 82 |
| GO:00325431 | Liver | HCC | mitochondrial translation | 62/7958 | 76/18723 | 2.95e-12 | 1.34e-10 | 62 |
| GO:004572712 | Liver | HCC | positive regulation of translation | 97/7958 | 136/18723 | 8.51e-12 | 3.55e-10 | 97 |
| GO:003425022 | Liver | HCC | positive regulation of cellular amide metabolic process | 110/7958 | 162/18723 | 5.14e-11 | 1.92e-09 | 110 |
| GO:0070129 | Liver | HCC | regulation of mitochondrial translation | 19/7958 | 24/18723 | 2.80e-04 | 2.02e-03 | 19 |
| GO:0062125 | Liver | HCC | regulation of mitochondrial gene expression | 21/7958 | 28/18723 | 4.94e-04 | 3.23e-03 | 21 |
| GO:0070131 | Liver | HCC | positive regulation of mitochondrial translation | 12/7958 | 15/18723 | 3.56e-03 | 1.59e-02 | 12 |
| GO:000641720 | Oral cavity | OSCC | regulation of translation | 274/7305 | 468/18723 | 4.39e-18 | 4.63e-16 | 274 |
| GO:004572719 | Oral cavity | OSCC | positive regulation of translation | 101/7305 | 136/18723 | 5.85e-17 | 4.94e-15 | 101 |
| GO:003425019 | Oral cavity | OSCC | positive regulation of cellular amide metabolic process | 115/7305 | 162/18723 | 1.28e-16 | 1.05e-14 | 115 |
| GO:01400533 | Oral cavity | OSCC | mitochondrial gene expression | 78/7305 | 108/18723 | 2.37e-12 | 9.86e-11 | 78 |
| Page: 1 2 |
| Pathway ID | Tissue | Disease Stage | Description | Gene Ratio | Bg Ratio | pvalue | p.adjust | qvalue | Count |
| Page: 1 |
Top |
Cell-cell communication analysis |
| Identification of potential cell-cell interactions between two cell types and their ligand-receptor pairs for different disease states |
| Ligand | Receptor | LRpair | Pathway | Tissue | Disease Stage |
| Page: 1 |
Top |
Single-cell gene regulatory network inference analysis |
| Find out the significant the regulons (TFs) and the target genes of each regulon across cell types for different disease states |
| TF | Cell Type | Tissue | Disease Stage | Target Gene | RSS | Regulon Activity |
| ∗The dot plots of a searched regulon are shown for all cell subpopulations in each disease state of each tissue based on the regulon specific score inferred using pySCENIC and by calculating the average expression. |
| Page: 1 |
Top |
Somatic mutation of malignant transformation related genes |
| Annotation of somatic variants for genes involved in malignant transformation |
| Hugo Symbol | Variant Class | Variant Classification | dbSNP RS | HGVSc | HGVSp | HGVSp Short | SWISSPROT | BIOTYPE | SIFT | PolyPhen | Tumor Sample Barcode | Tissue | Histology | Sex | Age | Stage | Therapy Types | Drugs | Outcome |
| MRPS27 | SNV | Missense_Mutation | novel | c.712N>A | p.Gln238Lys | p.Q238K | Q92552 | protein_coding | tolerated(0.1) | possibly_damaging(0.754) | TCGA-A7-A0DB-01 | Breast | breast invasive carcinoma | Female | <65 | I/II | Hormone Therapy | arimidex | SD |
| MRPS27 | SNV | Missense_Mutation | novel | c.521N>A | p.Ala174Asp | p.A174D | Q92552 | protein_coding | deleterious(0) | probably_damaging(1) | TCGA-AN-A046-01 | Breast | breast invasive carcinoma | Female | >=65 | I/II | Unknown | Unknown | SD |
| MRPS27 | SNV | Missense_Mutation | rs147211361 | c.30G>A | p.Met10Ile | p.M10I | Q92552 | protein_coding | tolerated(0.47) | benign(0) | TCGA-E9-A1RE-01 | Breast | breast invasive carcinoma | Female | >=65 | III/IV | Hormone Therapy | tamoxiphen | SD |
| MRPS27 | insertion | Nonsense_Mutation | novel | c.518_519insGTCCTCGTGCATATTTTGAAACTTGAGCTAGGCTGAG | p.Asp173GlufsTer7 | p.D173Efs*7 | Q92552 | protein_coding | TCGA-AO-A0JD-01 | Breast | breast invasive carcinoma | Female | <65 | III/IV | Chemotherapy | cyclophosphamide | SD | ||
| MRPS27 | SNV | Missense_Mutation | c.853N>C | p.Glu285Gln | p.E285Q | Q92552 | protein_coding | tolerated(0.18) | possibly_damaging(0.783) | TCGA-JW-A5VL-01 | Cervix | cervical & endocervical cancer | Female | <65 | I/II | Unknown | Unknown | SD | |
| MRPS27 | SNV | Missense_Mutation | c.574N>G | p.Thr192Ala | p.T192A | Q92552 | protein_coding | deleterious(0.01) | probably_damaging(0.998) | TCGA-AA-3672-01 | Colorectum | colon adenocarcinoma | Female | >=65 | III/IV | Unknown | Unknown | SD | |
| MRPS27 | SNV | Missense_Mutation | c.80N>T | p.Arg27Ile | p.R27I | Q92552 | protein_coding | deleterious(0) | probably_damaging(0.999) | TCGA-AA-A010-01 | Colorectum | colon adenocarcinoma | Female | <65 | I/II | Chemotherapy | folinic | CR | |
| MRPS27 | SNV | Missense_Mutation | c.461N>G | p.Asp154Gly | p.D154G | Q92552 | protein_coding | deleterious(0) | probably_damaging(0.988) | TCGA-AY-A54L-01 | Colorectum | colon adenocarcinoma | Female | >=65 | I/II | Unknown | Unknown | PD | |
| MRPS27 | SNV | Missense_Mutation | c.1159G>A | p.Ala387Thr | p.A387T | Q92552 | protein_coding | tolerated(0.19) | benign(0.007) | TCGA-CK-4951-01 | Colorectum | colon adenocarcinoma | Female | >=65 | I/II | Unknown | Unknown | PD | |
| MRPS27 | SNV | Missense_Mutation | c.218N>T | p.Ser73Leu | p.S73L | Q92552 | protein_coding | deleterious(0) | possibly_damaging(0.802) | TCGA-G4-6314-01 | Colorectum | colon adenocarcinoma | Female | >=65 | III/IV | Ancillary | leucovorin | SD |
| Page: 1 2 3 4 |
Top |
Related drugs of malignant transformation related genes |
| Identification of chemicals and drugs interact with genes involved in malignant transfromation |
| (DGIdb 4.0) |
| Entrez ID | Symbol | Category | Interaction Types | Drug Claim Name | Drug Name | PMIDs |
| Page: 1 |

Copyright 2023-Present -The University of Texas Health Science Center at Houston |