
|
|||||
|
 | |
| |
| |
| |
| |
| |
|
Gene: MRPS26 |
Gene summary for MRPS26 |
| Gene information | Species | Human | Gene symbol | MRPS26 | Gene ID | 64949 |
| Gene name | mitochondrial ribosomal protein S26 | |
| Gene Alias | C20orf193 | |
| Cytomap | 20p13 | |
| Gene Type | protein-coding | GO ID | GO:0006950 | UniProtAcc | Q9BYN8 |
Top |
Malignant transformation analysis |
| Identification of the aberrant gene expression in precancerous and cancerous lesions by comparing the gene expression of stem-like cells in diseased tissues with normal stem cells |
| Entrez ID | Symbol | Replicates | Species | Organ | Tissue | Adj P-value | Log2FC | Malignancy |
| 64949 | MRPS26 | HTA11_347_2000001011 | Human | Colorectum | AD | 4.31e-07 | 2.07e-01 | -0.1954 |
| 64949 | MRPS26 | HTA11_1391_2000001011 | Human | Colorectum | AD | 6.92e-08 | 2.78e-01 | -0.059 |
| 64949 | MRPS26 | HTA11_866_3004761011 | Human | Colorectum | AD | 3.92e-06 | 2.34e-01 | 0.096 |
| 64949 | MRPS26 | HTA11_99999965062_69753 | Human | Colorectum | MSI-H | 1.77e-02 | 6.24e-01 | 0.3487 |
| 64949 | MRPS26 | HTA11_99999974143_84620 | Human | Colorectum | MSS | 1.09e-04 | 2.46e-01 | 0.3005 |
| 64949 | MRPS26 | AEH-subject1 | Human | Endometrium | AEH | 3.98e-06 | -2.03e-01 | -0.3059 |
| 64949 | MRPS26 | AEH-subject2 | Human | Endometrium | AEH | 7.11e-06 | -2.75e-01 | -0.2525 |
| 64949 | MRPS26 | AEH-subject3 | Human | Endometrium | AEH | 1.14e-03 | -1.41e-01 | -0.2576 |
| 64949 | MRPS26 | AEH-subject4 | Human | Endometrium | AEH | 6.02e-07 | -3.46e-01 | -0.2657 |
| 64949 | MRPS26 | AEH-subject5 | Human | Endometrium | AEH | 1.05e-05 | -3.42e-01 | -0.2953 |
| 64949 | MRPS26 | EEC-subject1 | Human | Endometrium | EEC | 7.63e-08 | -2.40e-01 | -0.2682 |
| 64949 | MRPS26 | EEC-subject2 | Human | Endometrium | EEC | 3.76e-05 | -1.53e-01 | -0.2607 |
| 64949 | MRPS26 | EEC-subject3 | Human | Endometrium | EEC | 6.85e-34 | -4.81e-01 | -0.2525 |
| 64949 | MRPS26 | EEC-subject4 | Human | Endometrium | EEC | 1.93e-04 | -2.68e-01 | -0.2571 |
| 64949 | MRPS26 | EEC-subject5 | Human | Endometrium | EEC | 2.16e-04 | -1.53e-01 | -0.249 |
| 64949 | MRPS26 | GSM5276934 | Human | Endometrium | EEC | 2.52e-18 | -4.47e-01 | -0.0913 |
| 64949 | MRPS26 | GSM5276937 | Human | Endometrium | EEC | 1.18e-08 | -3.55e-01 | -0.0897 |
| 64949 | MRPS26 | GSM6177620_NYU_UCEC1_lib1_lib1 | Human | Endometrium | EEC | 9.02e-30 | -2.95e-01 | -0.1869 |
| 64949 | MRPS26 | GSM6177620_NYU_UCEC1_lib2_lib2 | Human | Endometrium | EEC | 5.63e-24 | -2.83e-01 | -0.1875 |
| 64949 | MRPS26 | GSM6177620_NYU_UCEC1_lib3_lib3 | Human | Endometrium | EEC | 5.73e-28 | -3.61e-01 | -0.1883 |
| Page: 1 2 3 4 5 6 7 8 |
| Tissue | Expression Dynamics | Abbreviation |
| Colorectum (GSE201348) |  | FAP: Familial adenomatous polyposis |
| CRC: Colorectal cancer | ||
| Colorectum (HTA11) |  | AD: Adenomas |
| SER: Sessile serrated lesions | ||
| MSI-H: Microsatellite-high colorectal cancer | ||
| MSS: Microsatellite stable colorectal cancer | ||
| Endometrium | 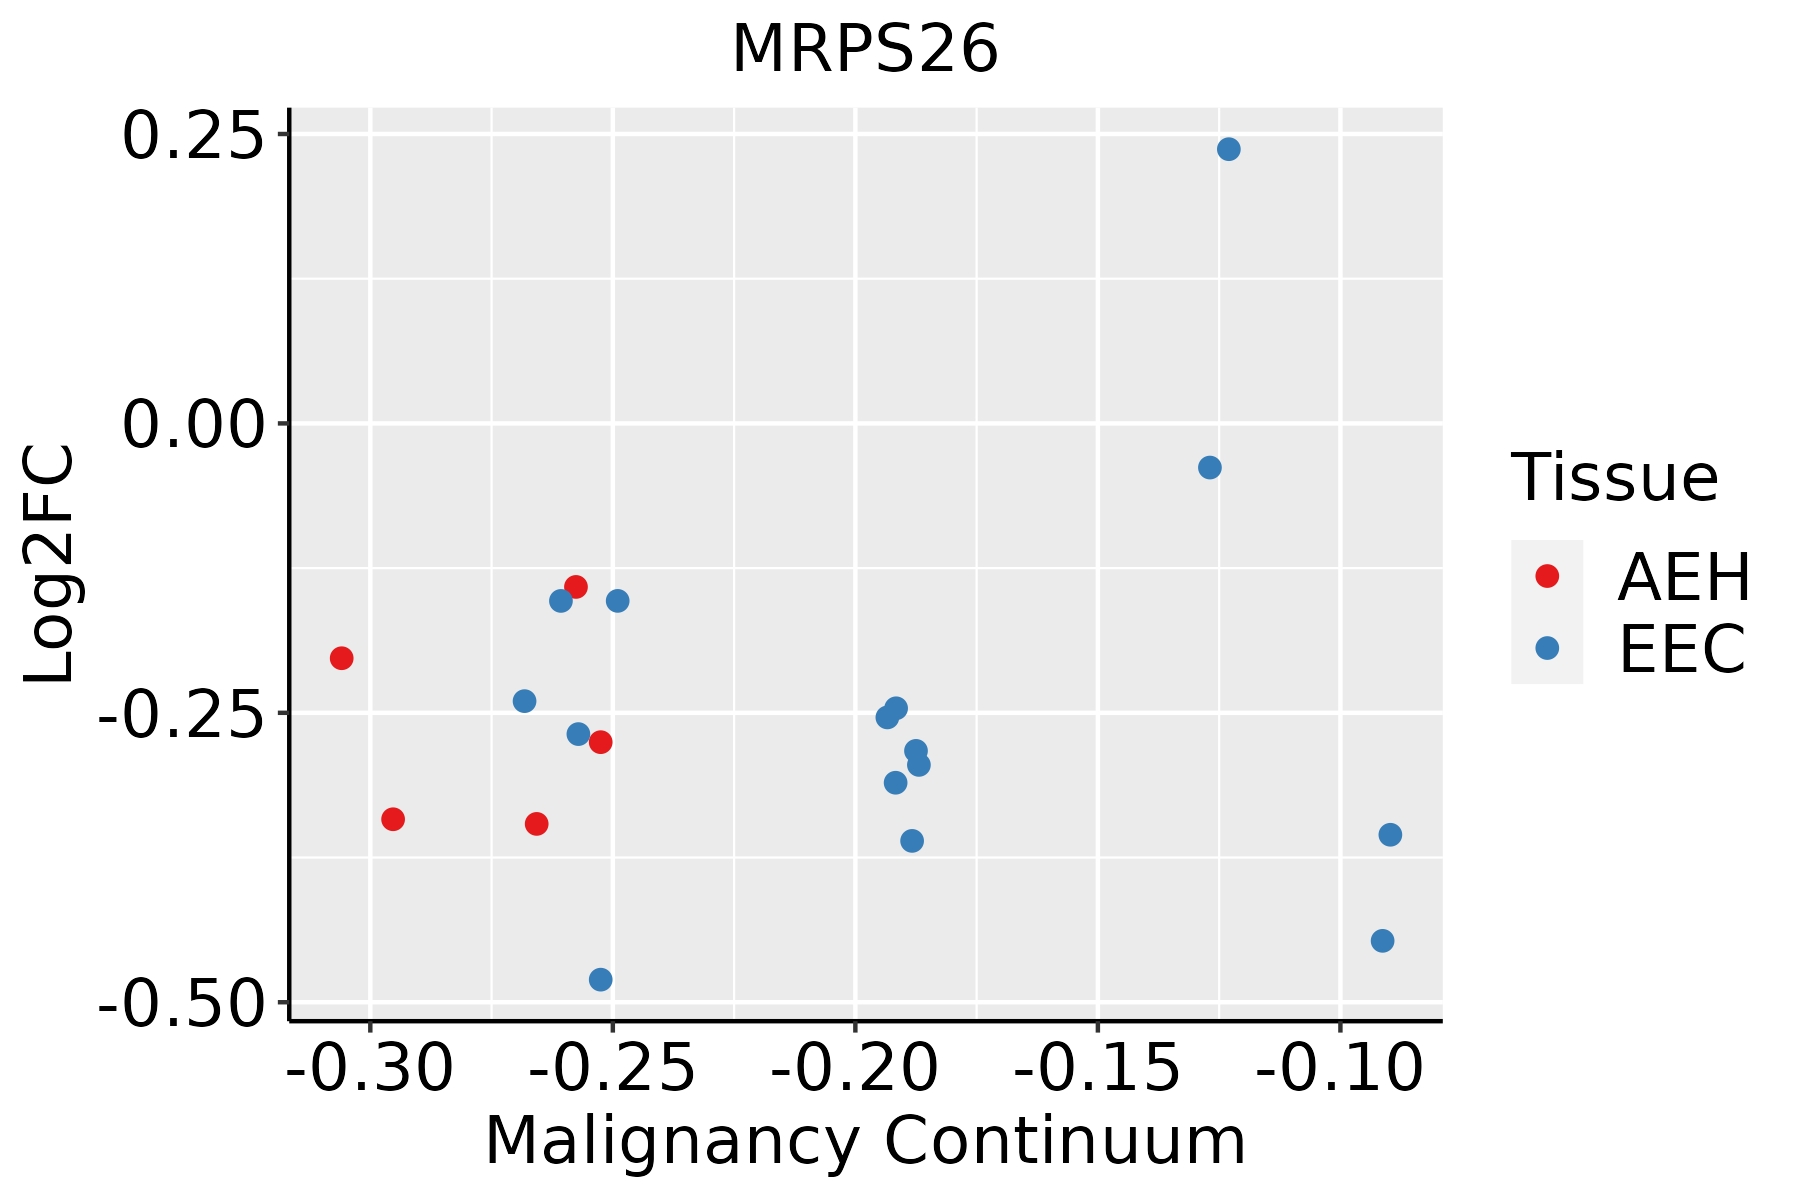 | AEH: Atypical endometrial hyperplasia |
| EEC: Endometrioid Cancer | ||
| Esophagus | 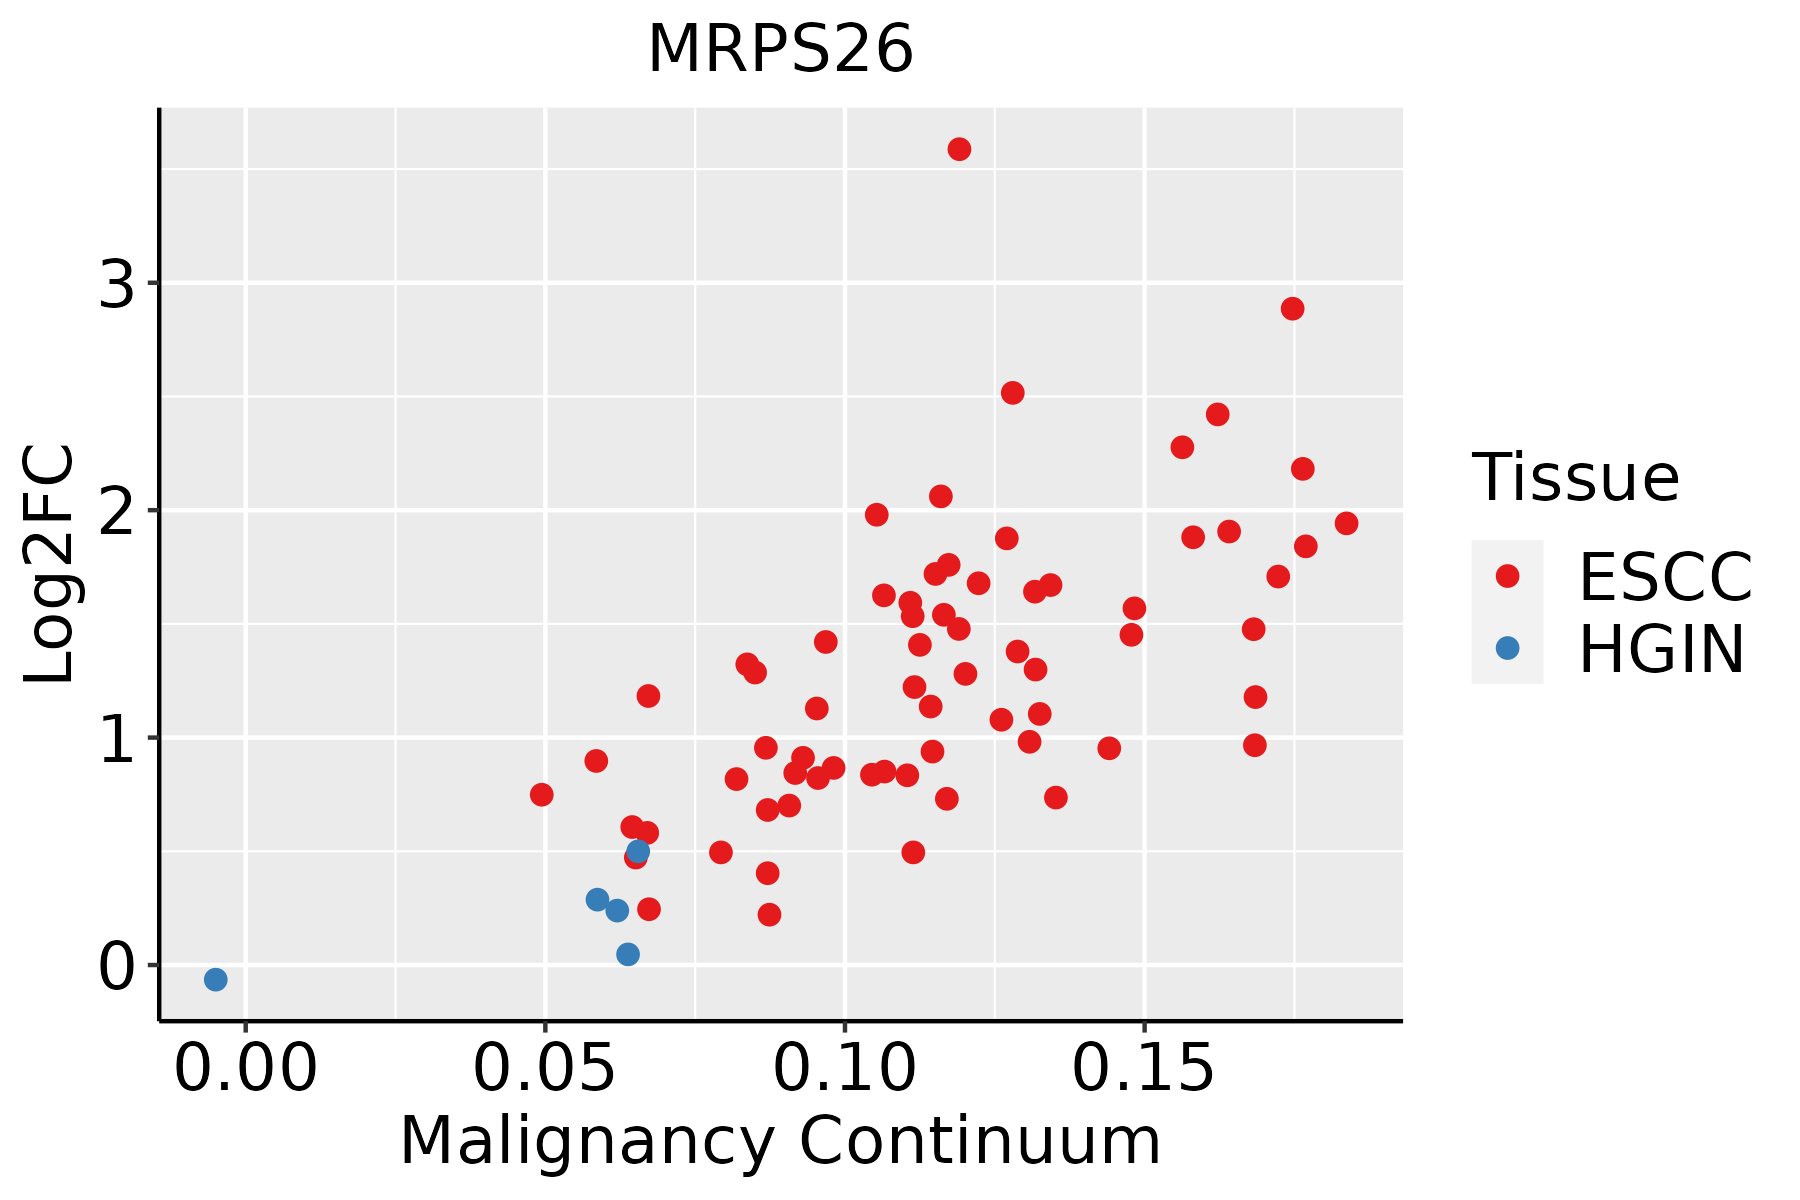 | ESCC: Esophageal squamous cell carcinoma |
| HGIN: High-grade intraepithelial neoplasias | ||
| LGIN: Low-grade intraepithelial neoplasias | ||
| Liver | 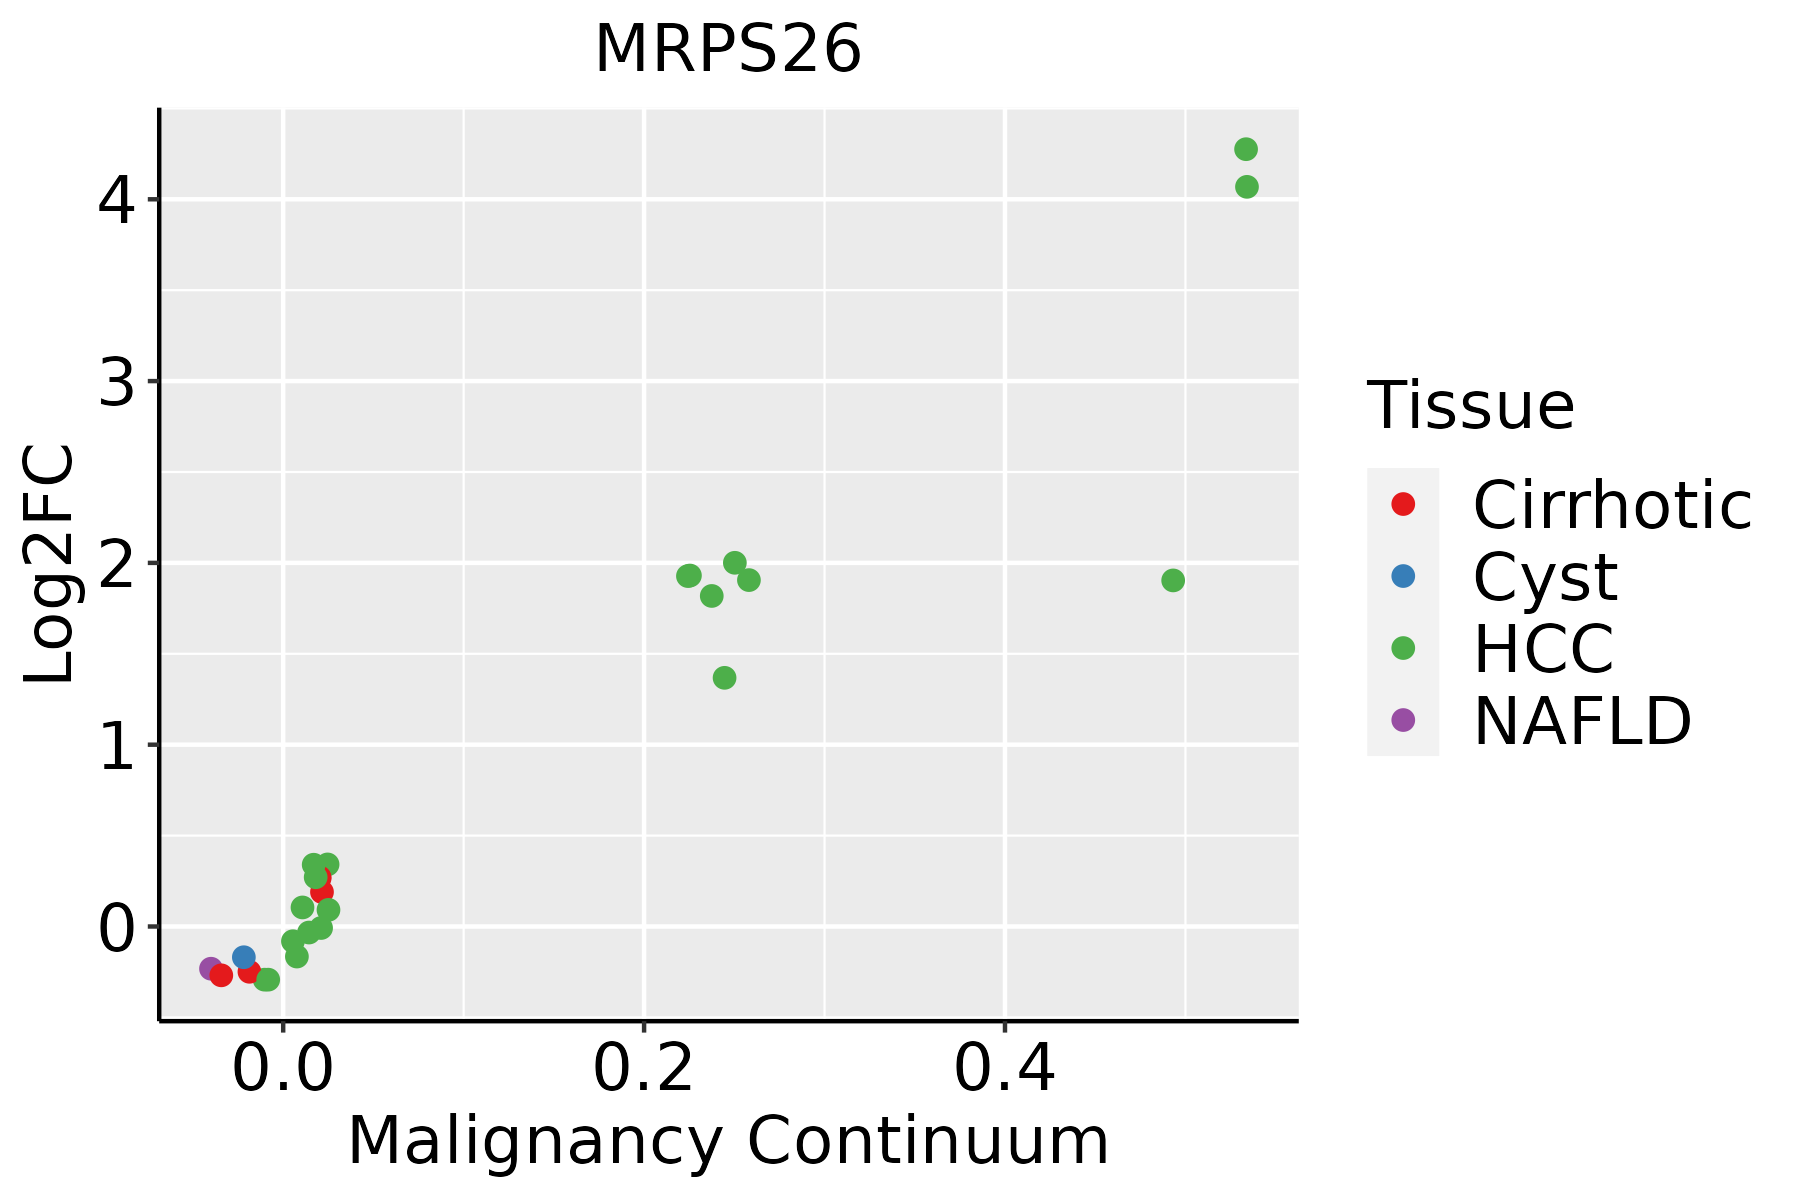 | HCC: Hepatocellular carcinoma |
| NAFLD: Non-alcoholic fatty liver disease | ||
| Oral Cavity | 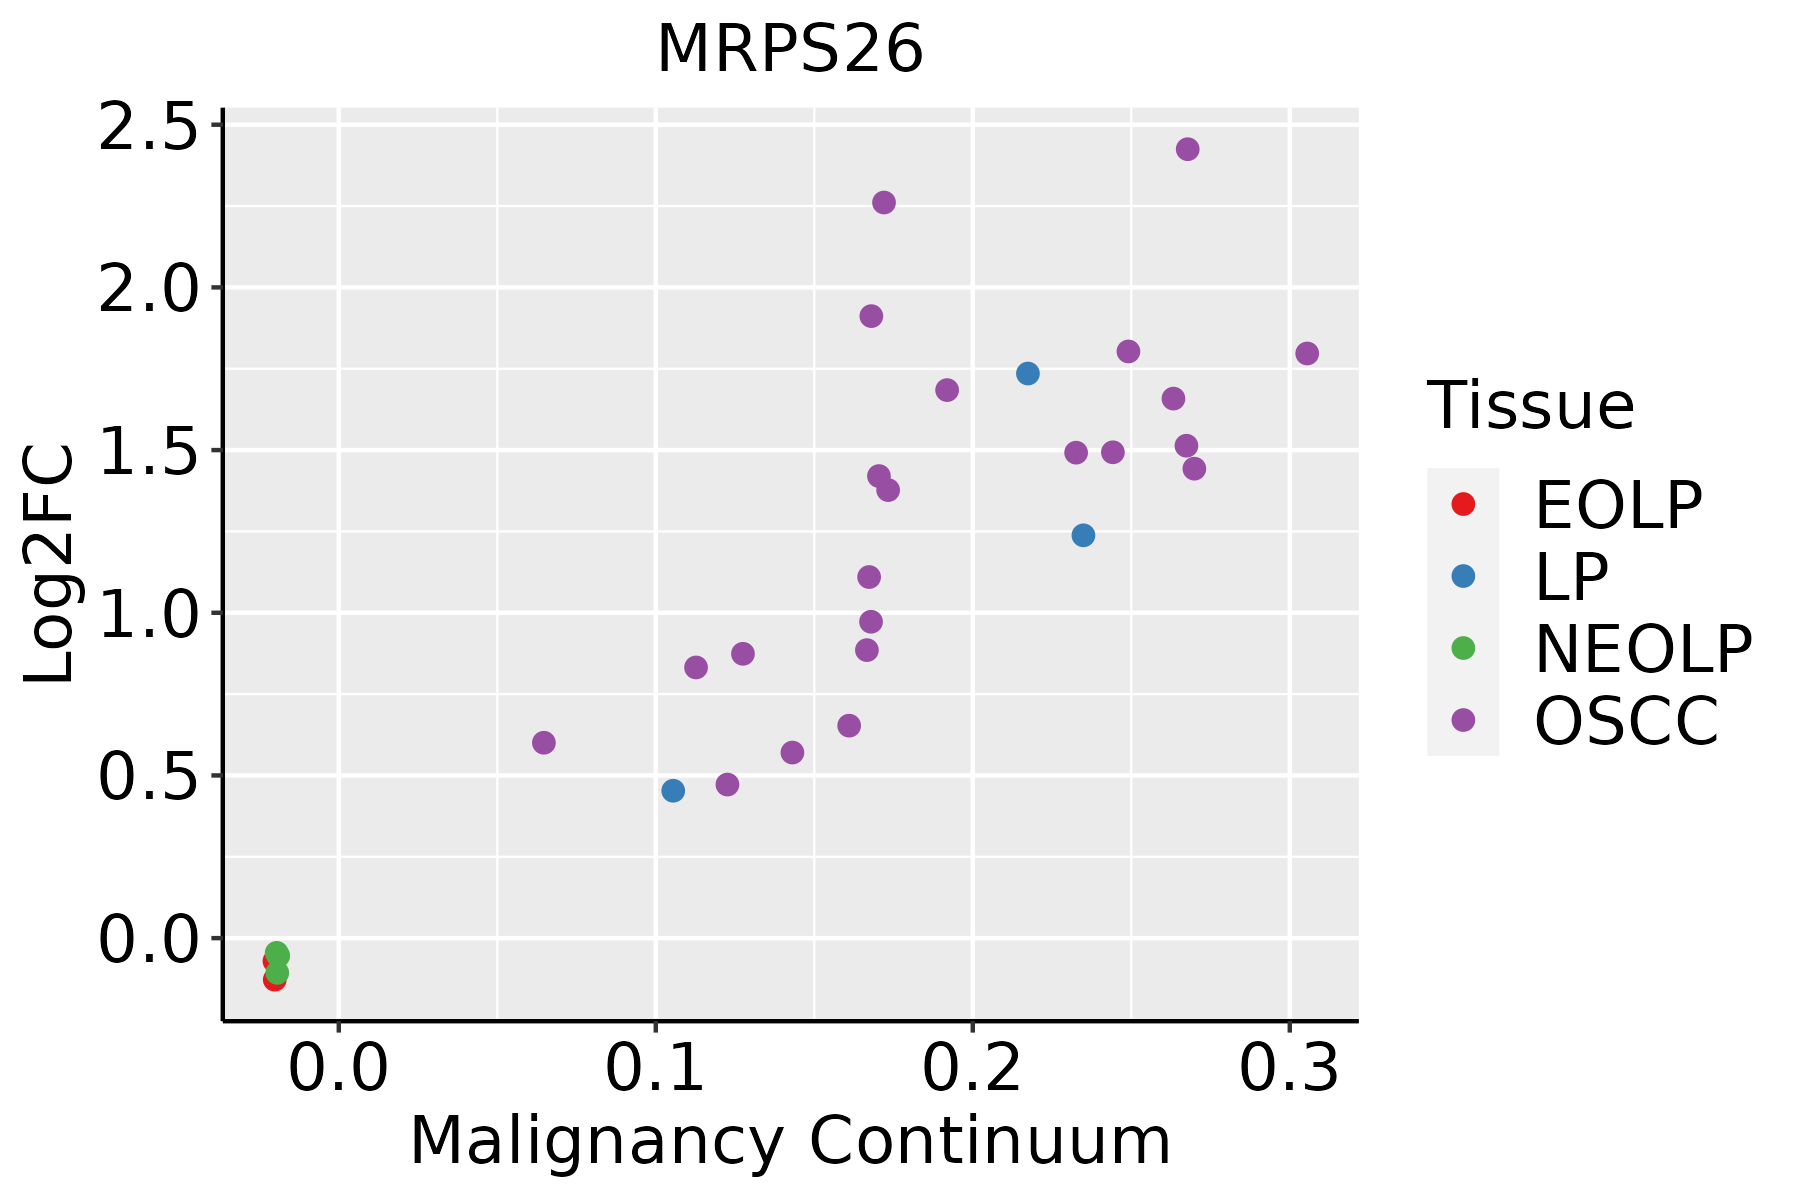 | EOLP: Erosive Oral lichen planus |
| LP: leukoplakia | ||
| NEOLP: Non-erosive oral lichen planus | ||
| OSCC: Oral squamous cell carcinoma | ||
| Prostate |  | BPH: Benign Prostatic Hyperplasia |
| Skin |  | AK: Actinic keratosis |
| cSCC: Cutaneous squamous cell carcinoma | ||
| SCCIS:squamous cell carcinoma in situ | ||
| Thyroid |  | ATC: Anaplastic thyroid cancer |
| HT: Hashimoto's thyroiditis | ||
| PTC: Papillary thyroid cancer |
| ∗log2FC in expression of this searched gene in stem-like cells from each diseased tissue sample relative to stem-like cells in normal samples in each tissue plotted against the malignancy continuum. Samples are colored based on if they are from different disease stage. |
Top |
Malignant transformation related pathway analysis |
| Find out the enriched GO biological processes and KEGG pathways involved in transition from healthy to precancer to cancer |
| Tissue | Disease Stage | Enriched GO biological Processes |
| Colorectum | AD |  |
| Colorectum | SER |  |
| Colorectum | MSS |  |
| Colorectum | MSI-H |  |
| Colorectum | FAP |  |
| ∗Top 15 enriched GO BP terms are showed in the bar plot of each disease state in each tissue. Each row represents a significant GO biological process which is colored according to the -log10(p.adjust). |
| Page: 1 2 3 4 5 6 7 8 9 |
| GO ID | Tissue | Disease Stage | Description | Gene Ratio | Bg Ratio | pvalue | p.adjust | Count |
| GO:0042769 | Colorectum | AD | DNA damage response, detection of DNA damage | 8/3918 | 13/18723 | 1.70e-03 | 1.41e-02 | 8 |
| GO:00427691 | Colorectum | MSS | DNA damage response, detection of DNA damage | 7/3467 | 13/18723 | 4.46e-03 | 3.15e-02 | 7 |
| GO:00427692 | Colorectum | MSI-H | DNA damage response, detection of DNA damage | 6/1319 | 13/18723 | 1.35e-04 | 3.98e-03 | 6 |
| GO:00427697 | Esophagus | ESCC | DNA damage response, detection of DNA damage | 12/8552 | 13/18723 | 6.18e-04 | 3.32e-03 | 12 |
| GO:00427693 | Liver | Cirrhotic | DNA damage response, detection of DNA damage | 10/4634 | 13/18723 | 1.14e-04 | 1.14e-03 | 10 |
| GO:004276911 | Liver | HCC | DNA damage response, detection of DNA damage | 11/7958 | 13/18723 | 2.38e-03 | 1.16e-02 | 11 |
| GO:00427696 | Oral cavity | OSCC | DNA damage response, detection of DNA damage | 11/7305 | 13/18723 | 1.02e-03 | 5.29e-03 | 11 |
| GO:004276913 | Oral cavity | LP | DNA damage response, detection of DNA damage | 9/4623 | 13/18723 | 8.93e-04 | 7.64e-03 | 9 |
| GO:00427695 | Prostate | BPH | DNA damage response, detection of DNA damage | 6/3107 | 13/18723 | 1.24e-02 | 4.94e-02 | 6 |
| GO:00427698 | Skin | cSCC | DNA damage response, detection of DNA damage | 10/4864 | 13/18723 | 1.78e-04 | 1.50e-03 | 10 |
| GO:00427699 | Thyroid | PTC | DNA damage response, detection of DNA damage | 10/5968 | 13/18723 | 1.11e-03 | 6.51e-03 | 10 |
| GO:004276914 | Thyroid | ATC | DNA damage response, detection of DNA damage | 10/6293 | 13/18723 | 1.77e-03 | 8.71e-03 | 10 |
| Page: 1 |
| Pathway ID | Tissue | Disease Stage | Description | Gene Ratio | Bg Ratio | pvalue | p.adjust | qvalue | Count |
| Page: 1 |
Top |
Cell-cell communication analysis |
| Identification of potential cell-cell interactions between two cell types and their ligand-receptor pairs for different disease states |
| Ligand | Receptor | LRpair | Pathway | Tissue | Disease Stage |
| Page: 1 |
Top |
Single-cell gene regulatory network inference analysis |
| Find out the significant the regulons (TFs) and the target genes of each regulon across cell types for different disease states |
| TF | Cell Type | Tissue | Disease Stage | Target Gene | RSS | Regulon Activity |
| ∗The dot plots of a searched regulon are shown for all cell subpopulations in each disease state of each tissue based on the regulon specific score inferred using pySCENIC and by calculating the average expression. |
| Page: 1 |
Top |
Somatic mutation of malignant transformation related genes |
| Annotation of somatic variants for genes involved in malignant transformation |
| Hugo Symbol | Variant Class | Variant Classification | dbSNP RS | HGVSc | HGVSp | HGVSp Short | SWISSPROT | BIOTYPE | SIFT | PolyPhen | Tumor Sample Barcode | Tissue | Histology | Sex | Age | Stage | Therapy Types | Drugs | Outcome |
| MRPS26 | SNV | Missense_Mutation | novel | c.590N>G | p.Val197Gly | p.V197G | Q9BYN8 | protein_coding | deleterious(0) | possibly_damaging(0.787) | TCGA-BH-A0HO-01 | Breast | breast invasive carcinoma | Female | <65 | I/II | Chemotherapy | cyclophosphamide | SD |
| MRPS26 | SNV | Missense_Mutation | c.583N>T | p.Gly195Trp | p.G195W | Q9BYN8 | protein_coding | deleterious(0) | probably_damaging(1) | TCGA-D8-A1XK-01 | Breast | breast invasive carcinoma | Female | <65 | I/II | Chemotherapy | doxorubicine+cyclophosphamide | SD | |
| MRPS26 | SNV | Missense_Mutation | novel | c.590T>G | p.Val197Gly | p.V197G | Q9BYN8 | protein_coding | deleterious(0) | possibly_damaging(0.787) | TCGA-E9-A1R5-01 | Breast | breast invasive carcinoma | Female | <65 | I/II | Hormone Therapy | tamoxiphen | SD |
| MRPS26 | SNV | Missense_Mutation | novel | c.268N>G | p.Leu90Val | p.L90V | Q9BYN8 | protein_coding | tolerated(0.1) | benign(0.009) | TCGA-V7-A7HQ-01 | Breast | breast invasive carcinoma | Female | >=65 | III/IV | Hormone Therapy | letrozole | CR |
| MRPS26 | SNV | Missense_Mutation | novel | c.170N>C | p.Met57Thr | p.M57T | Q9BYN8 | protein_coding | tolerated(1) | benign(0) | TCGA-2W-A8YY-01 | Cervix | cervical & endocervical cancer | Female | <65 | I/II | Chemotherapy | cisplatin | CR |
| MRPS26 | SNV | Missense_Mutation | c.176N>A | p.Arg59His | p.R59H | Q9BYN8 | protein_coding | deleterious(0.01) | probably_damaging(0.999) | TCGA-CK-4951-01 | Colorectum | colon adenocarcinoma | Female | >=65 | I/II | Unknown | Unknown | PD | |
| MRPS26 | SNV | Missense_Mutation | novel | c.254N>T | p.Ala85Val | p.A85V | Q9BYN8 | protein_coding | tolerated(0.11) | benign(0.019) | TCGA-AP-A0LM-01 | Endometrium | uterine corpus endometrioid carcinoma | Female | <65 | III/IV | Chemotherapy | cisplatin | SD |
| MRPS26 | SNV | Missense_Mutation | novel | c.575N>T | p.Thr192Ile | p.T192I | Q9BYN8 | protein_coding | deleterious(0.01) | possibly_damaging(0.731) | TCGA-AX-A2HD-01 | Endometrium | uterine corpus endometrioid carcinoma | Female | >=65 | III/IV | Unknown | Unknown | SD |
| MRPS26 | SNV | Missense_Mutation | novel | c.548N>A | p.Ser183Tyr | p.S183Y | Q9BYN8 | protein_coding | deleterious(0) | possibly_damaging(0.711) | TCGA-B5-A1MR-01 | Endometrium | uterine corpus endometrioid carcinoma | Female | >=65 | III/IV | Unknown | Unknown | SD |
| MRPS26 | SNV | Missense_Mutation | novel | c.149N>T | p.Pro50Leu | p.P50L | Q9BYN8 | protein_coding | deleterious(0.01) | probably_damaging(0.99) | TCGA-EO-A22U-01 | Endometrium | uterine corpus endometrioid carcinoma | Female | >=65 | I/II | Unknown | Unknown | SD |
| Page: 1 2 |
Top |
Related drugs of malignant transformation related genes |
| Identification of chemicals and drugs interact with genes involved in malignant transfromation |
| (DGIdb 4.0) |
| Entrez ID | Symbol | Category | Interaction Types | Drug Claim Name | Drug Name | PMIDs |
| Page: 1 |

Copyright 2023-Present -The University of Texas Health Science Center at Houston |