
|
|||||
|
 | |
| |
| |
| |
| |
| |
|
Gene: MRPS25 |
Gene summary for MRPS25 |
| Gene information | Species | Human | Gene symbol | MRPS25 | Gene ID | 64432 |
| Gene name | mitochondrial ribosomal protein S25 | |
| Gene Alias | COXPD50 | |
| Cytomap | 3p25.1 | |
| Gene Type | protein-coding | GO ID | GO:0005575 | UniProtAcc | P82663 |
Top |
Malignant transformation analysis |
| Identification of the aberrant gene expression in precancerous and cancerous lesions by comparing the gene expression of stem-like cells in diseased tissues with normal stem cells |
| Entrez ID | Symbol | Replicates | Species | Organ | Tissue | Adj P-value | Log2FC | Malignancy |
| 64432 | MRPS25 | HTA11_347_2000001011 | Human | Colorectum | AD | 2.81e-02 | 3.14e-01 | -0.1954 |
| 64432 | MRPS25 | HTA11_1391_2000001011 | Human | Colorectum | AD | 1.34e-03 | 5.02e-01 | -0.059 |
| 64432 | MRPS25 | HTA11_99999970781_79442 | Human | Colorectum | MSS | 1.45e-07 | 4.20e-01 | 0.294 |
| 64432 | MRPS25 | HTA11_99999971662_82457 | Human | Colorectum | MSS | 8.90e-04 | 4.92e-01 | 0.3859 |
| 64432 | MRPS25 | A015-C-203 | Human | Colorectum | FAP | 3.05e-11 | -1.73e-01 | -0.1294 |
| 64432 | MRPS25 | A002-C-201 | Human | Colorectum | FAP | 6.88e-08 | -2.07e-01 | 0.0324 |
| 64432 | MRPS25 | A001-C-119 | Human | Colorectum | FAP | 4.67e-07 | -3.85e-01 | -0.1557 |
| 64432 | MRPS25 | A001-C-108 | Human | Colorectum | FAP | 1.31e-04 | -9.14e-02 | -0.0272 |
| 64432 | MRPS25 | A002-C-205 | Human | Colorectum | FAP | 1.19e-11 | -1.81e-01 | -0.1236 |
| 64432 | MRPS25 | A015-C-006 | Human | Colorectum | FAP | 3.39e-07 | -1.05e-01 | -0.0994 |
| 64432 | MRPS25 | A015-C-106 | Human | Colorectum | FAP | 6.67e-05 | -6.29e-03 | -0.0511 |
| 64432 | MRPS25 | A002-C-114 | Human | Colorectum | FAP | 1.88e-09 | -2.43e-01 | -0.1561 |
| 64432 | MRPS25 | A015-C-104 | Human | Colorectum | FAP | 3.62e-13 | -1.40e-01 | -0.1899 |
| 64432 | MRPS25 | A001-C-014 | Human | Colorectum | FAP | 4.09e-06 | -2.06e-01 | 0.0135 |
| 64432 | MRPS25 | A002-C-016 | Human | Colorectum | FAP | 1.78e-13 | -2.70e-01 | 0.0521 |
| 64432 | MRPS25 | A015-C-002 | Human | Colorectum | FAP | 1.74e-04 | -1.75e-01 | -0.0763 |
| 64432 | MRPS25 | A001-C-203 | Human | Colorectum | FAP | 5.62e-03 | 8.49e-03 | -0.0481 |
| 64432 | MRPS25 | A002-C-116 | Human | Colorectum | FAP | 1.88e-18 | -2.93e-01 | -0.0452 |
| 64432 | MRPS25 | A014-C-008 | Human | Colorectum | FAP | 4.27e-06 | -1.41e-01 | -0.191 |
| 64432 | MRPS25 | A018-E-020 | Human | Colorectum | FAP | 2.71e-10 | -1.15e-01 | -0.2034 |
| Page: 1 2 3 4 5 6 7 8 |
| Tissue | Expression Dynamics | Abbreviation |
| Colorectum (GSE201348) |  | FAP: Familial adenomatous polyposis |
| CRC: Colorectal cancer | ||
| Colorectum (HTA11) |  | AD: Adenomas |
| SER: Sessile serrated lesions | ||
| MSI-H: Microsatellite-high colorectal cancer | ||
| MSS: Microsatellite stable colorectal cancer | ||
| Esophagus | 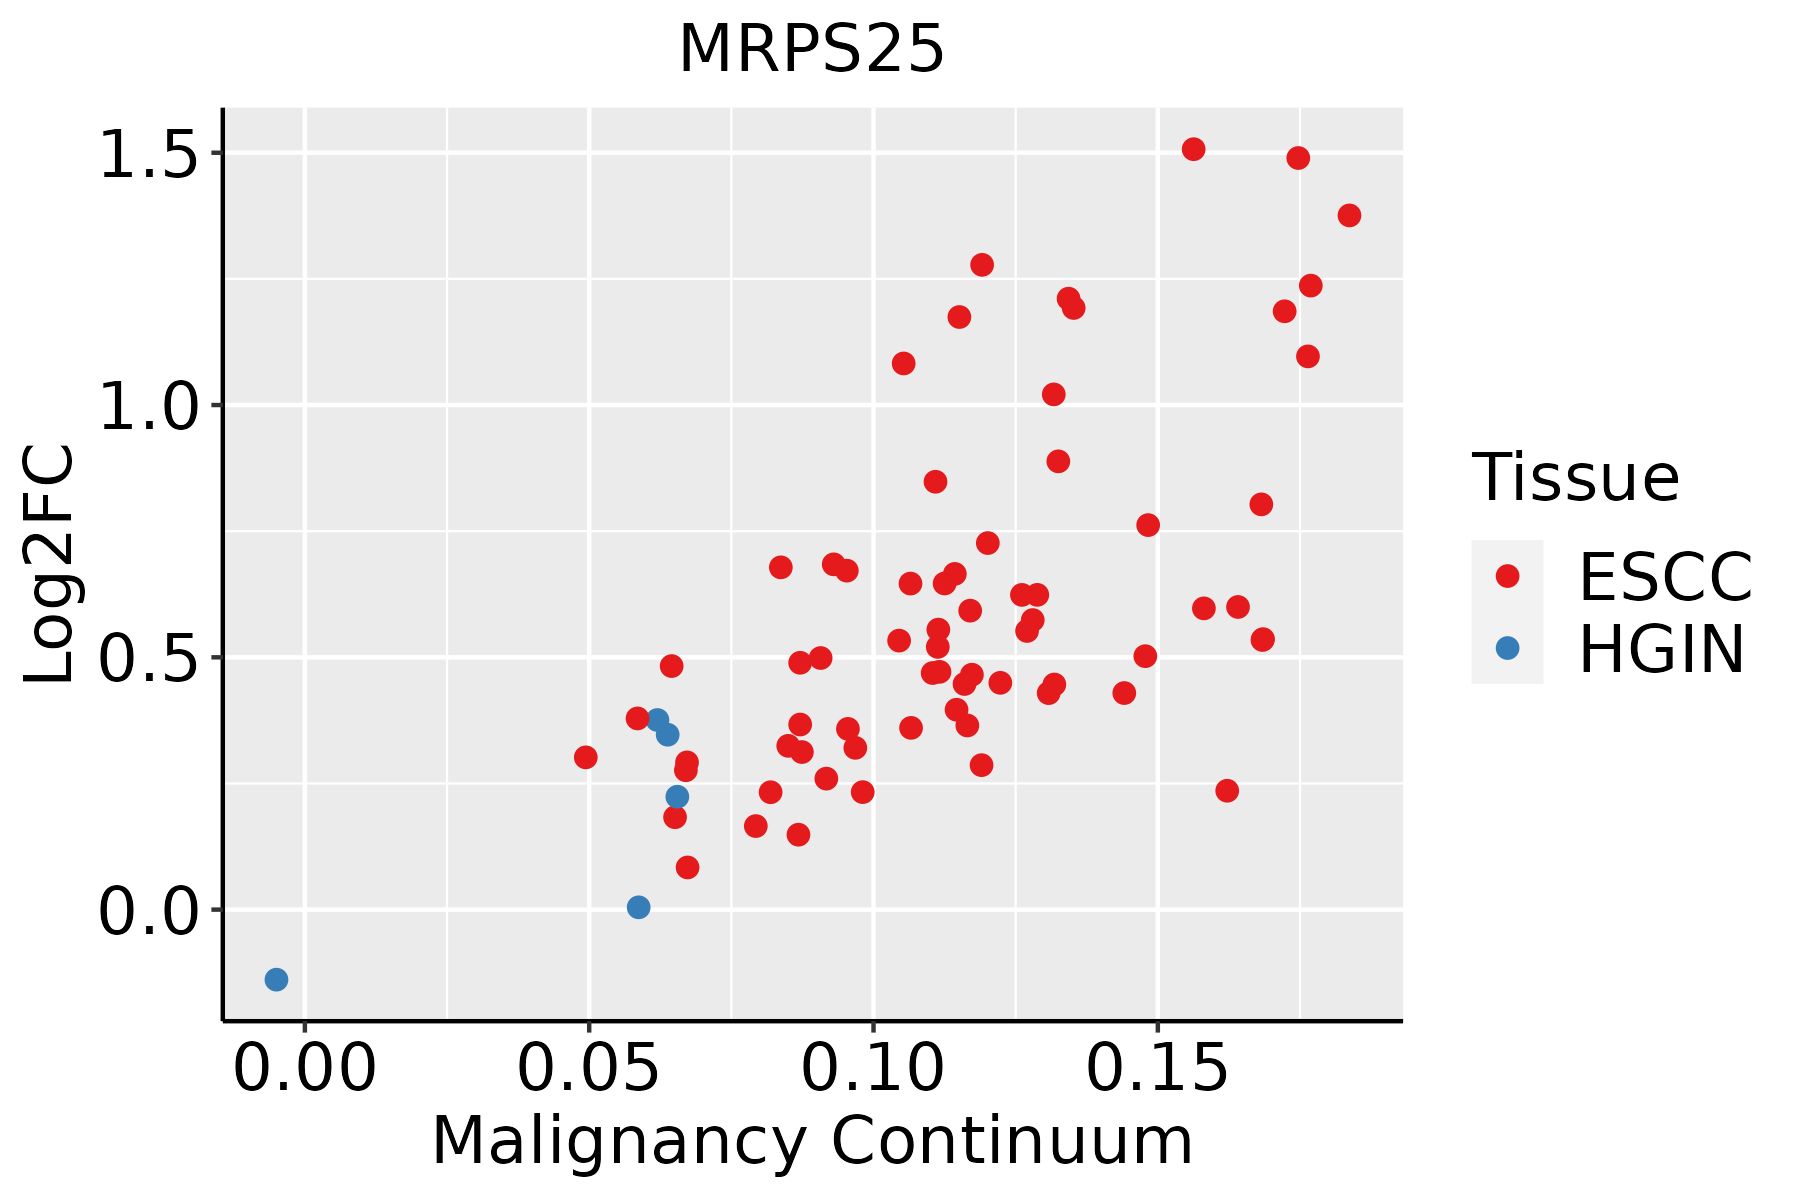 | ESCC: Esophageal squamous cell carcinoma |
| HGIN: High-grade intraepithelial neoplasias | ||
| LGIN: Low-grade intraepithelial neoplasias | ||
| Liver | 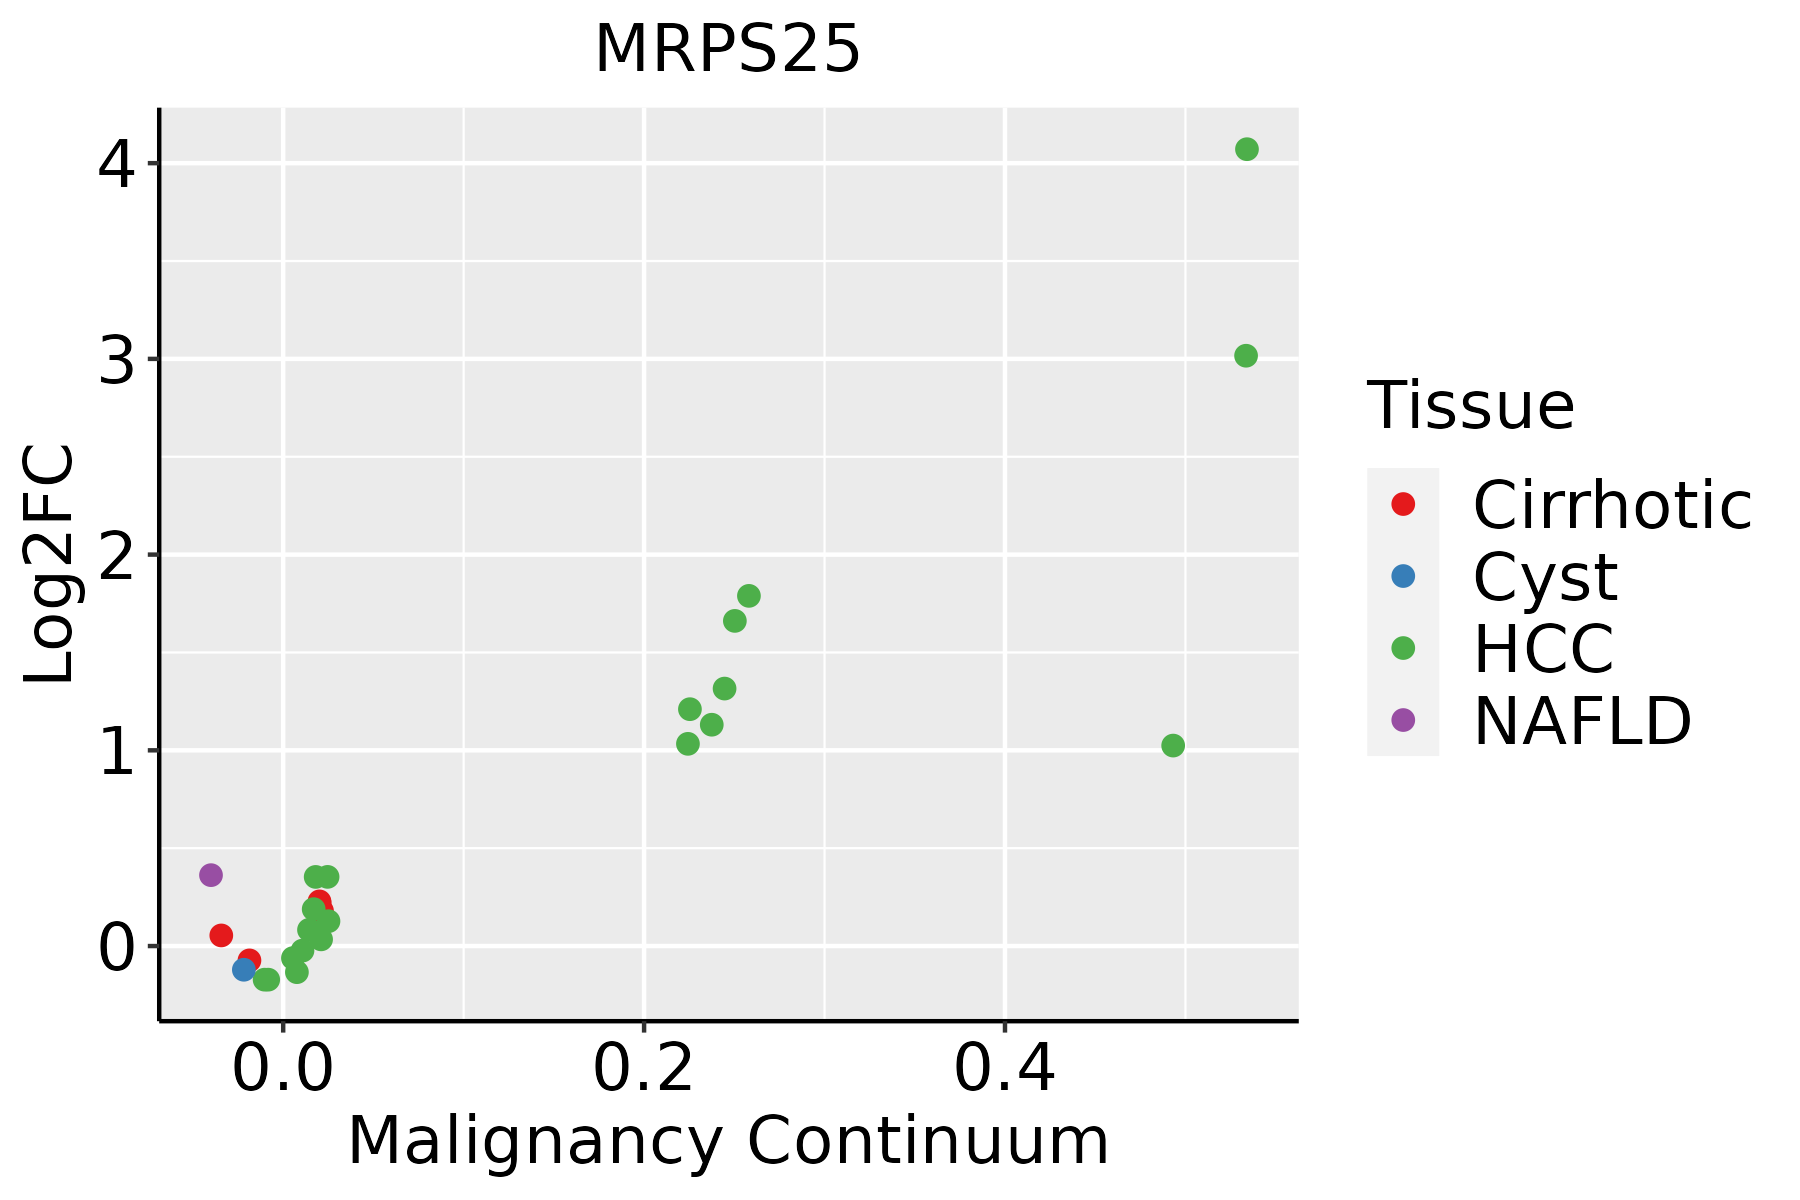 | HCC: Hepatocellular carcinoma |
| NAFLD: Non-alcoholic fatty liver disease | ||
| Oral Cavity | 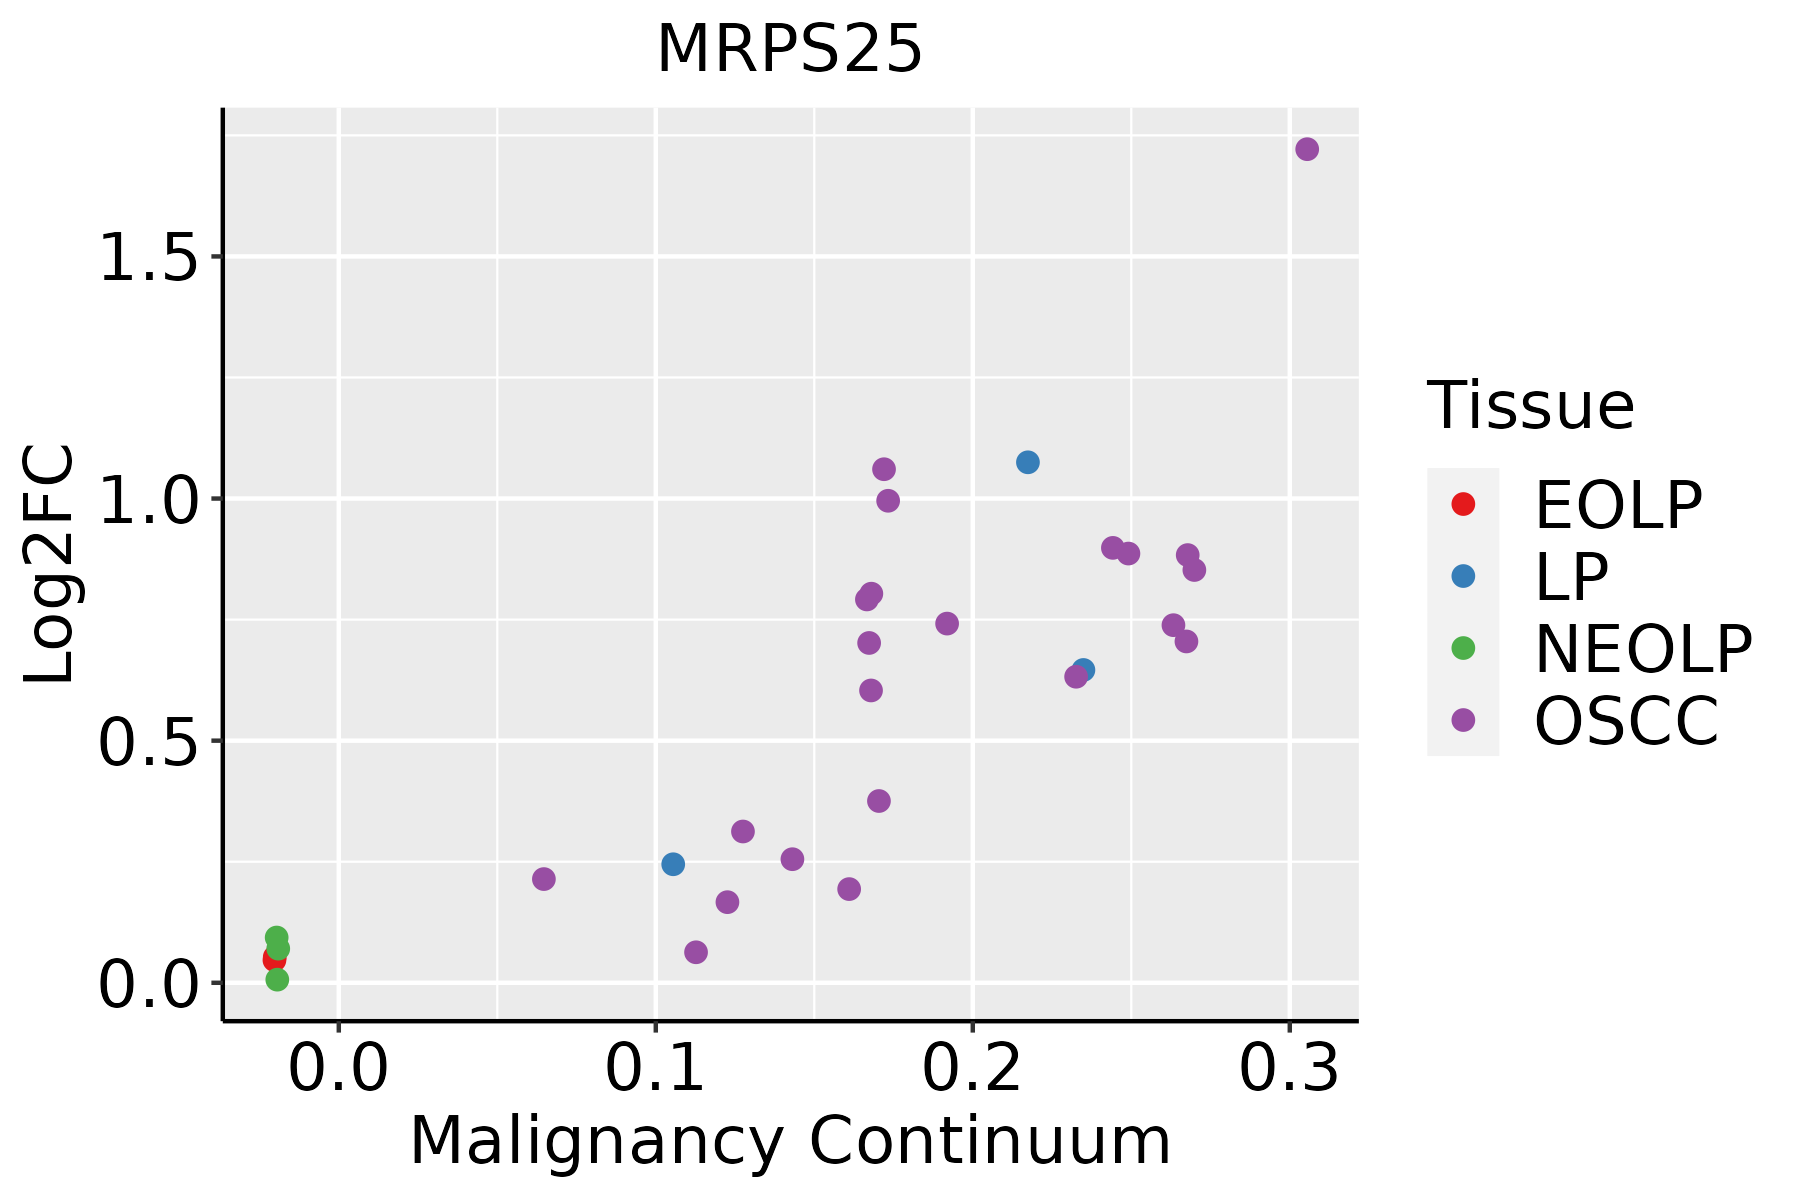 | EOLP: Erosive Oral lichen planus |
| LP: leukoplakia | ||
| NEOLP: Non-erosive oral lichen planus | ||
| OSCC: Oral squamous cell carcinoma | ||
| Skin | 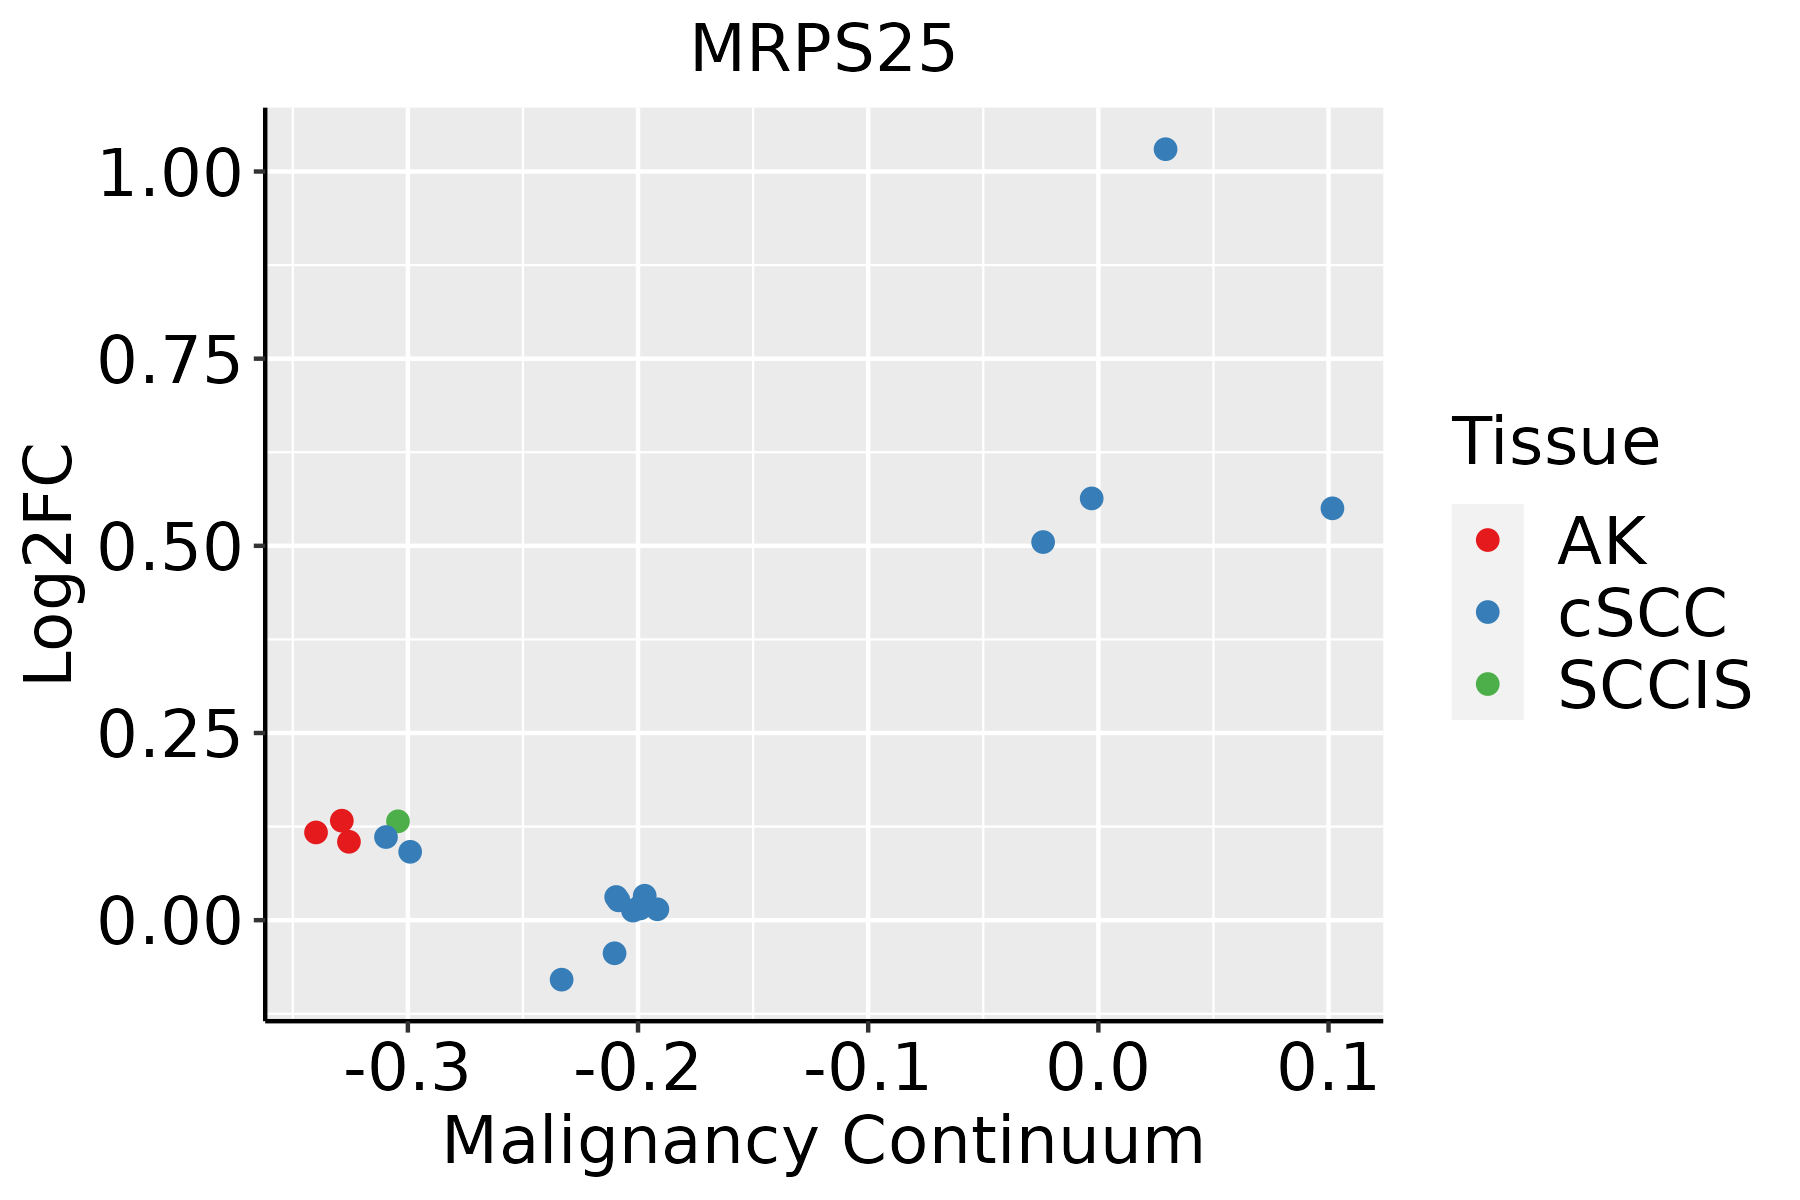 | AK: Actinic keratosis |
| cSCC: Cutaneous squamous cell carcinoma | ||
| SCCIS:squamous cell carcinoma in situ | ||
| Thyroid | 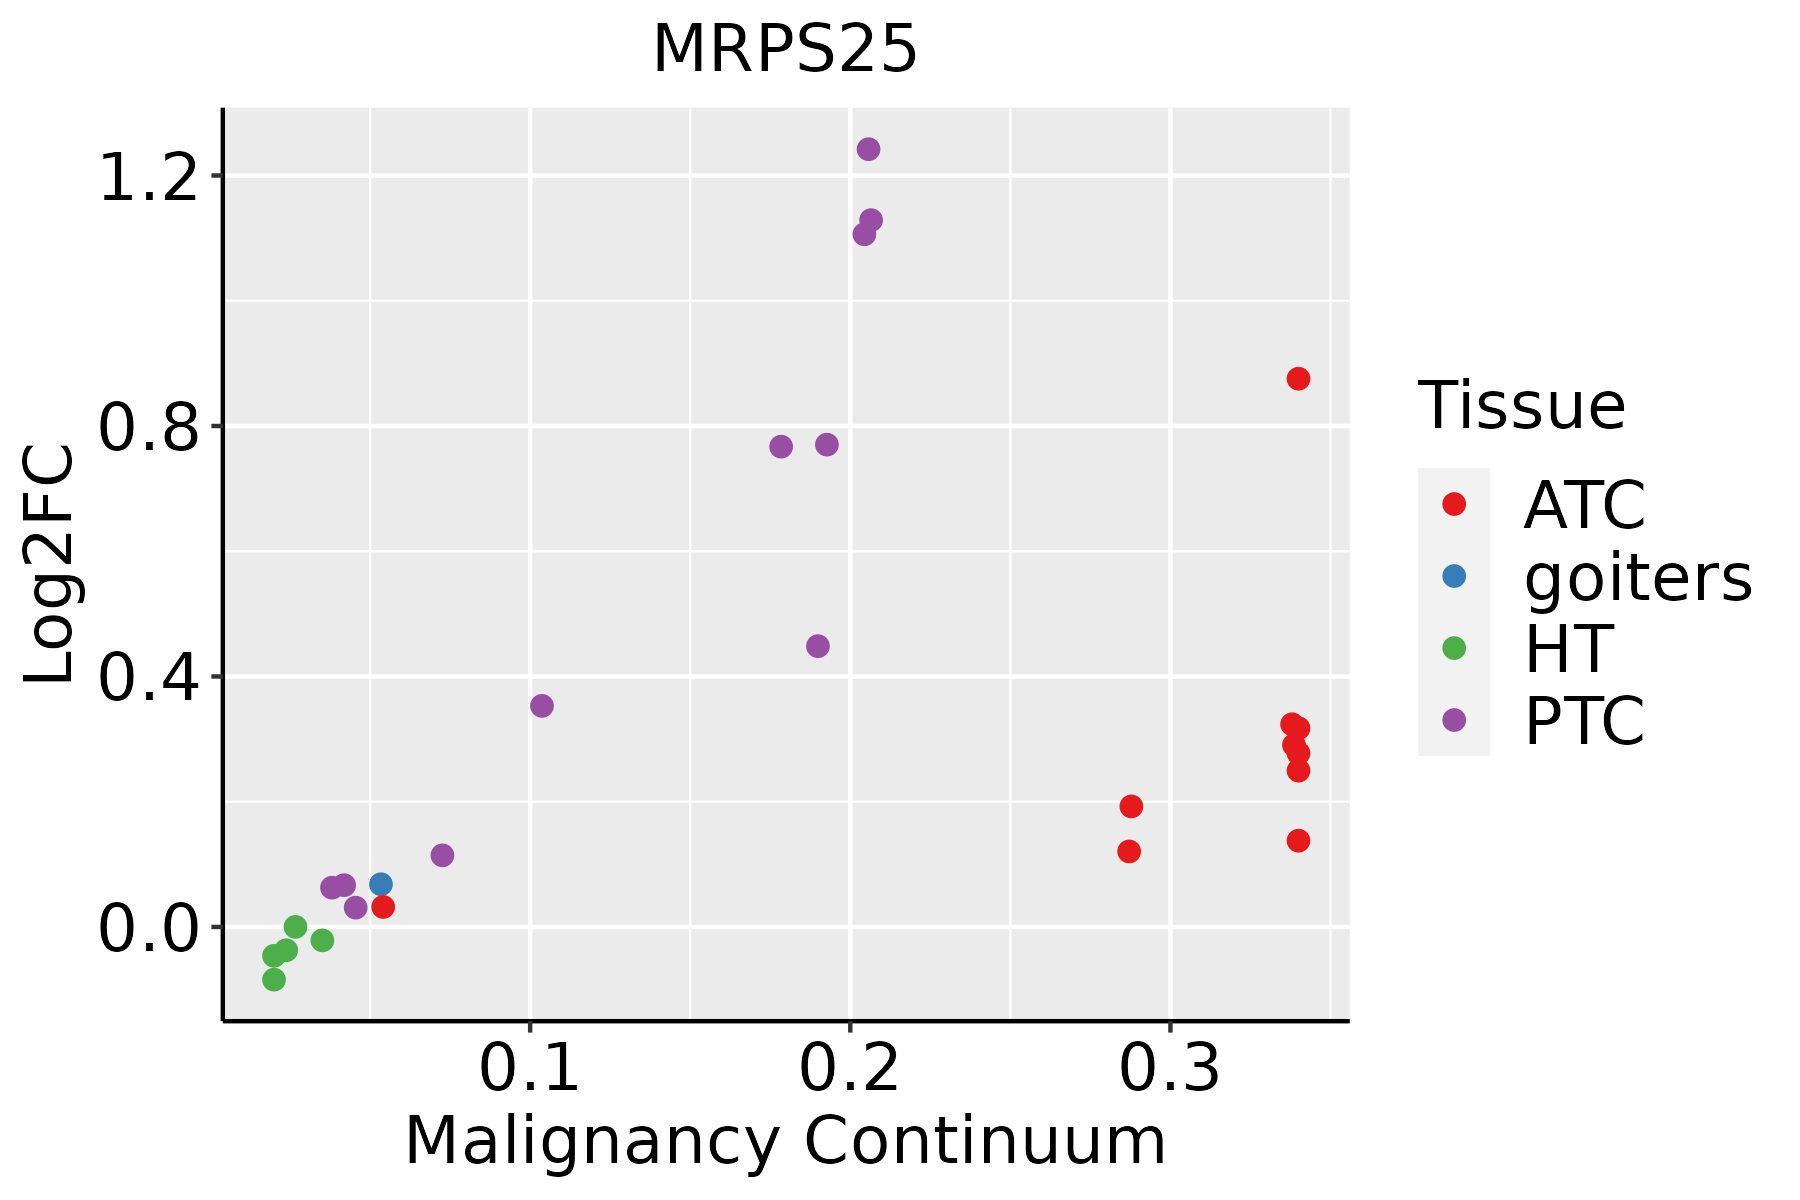 | ATC: Anaplastic thyroid cancer |
| HT: Hashimoto's thyroiditis | ||
| PTC: Papillary thyroid cancer |
| ∗log2FC in expression of this searched gene in stem-like cells from each diseased tissue sample relative to stem-like cells in normal samples in each tissue plotted against the malignancy continuum. Samples are colored based on if they are from different disease stage. |
Top |
Malignant transformation related pathway analysis |
| Find out the enriched GO biological processes and KEGG pathways involved in transition from healthy to precancer to cancer |
| Tissue | Disease Stage | Enriched GO biological Processes |
| Colorectum | AD |  |
| Colorectum | SER |  |
| Colorectum | MSS |  |
| Colorectum | MSI-H |  |
| Colorectum | FAP |  |
| ∗Top 15 enriched GO BP terms are showed in the bar plot of each disease state in each tissue. Each row represents a significant GO biological process which is colored according to the -log10(p.adjust). |
| Page: 1 2 3 4 5 6 7 8 9 |
| GO ID | Tissue | Disease Stage | Description | Gene Ratio | Bg Ratio | pvalue | p.adjust | Count |
| Page: 1 |
| Pathway ID | Tissue | Disease Stage | Description | Gene Ratio | Bg Ratio | pvalue | p.adjust | qvalue | Count |
| Page: 1 |
Top |
Cell-cell communication analysis |
| Identification of potential cell-cell interactions between two cell types and their ligand-receptor pairs for different disease states |
| Ligand | Receptor | LRpair | Pathway | Tissue | Disease Stage |
| Page: 1 |
Top |
Single-cell gene regulatory network inference analysis |
| Find out the significant the regulons (TFs) and the target genes of each regulon across cell types for different disease states |
| TF | Cell Type | Tissue | Disease Stage | Target Gene | RSS | Regulon Activity |
| ∗The dot plots of a searched regulon are shown for all cell subpopulations in each disease state of each tissue based on the regulon specific score inferred using pySCENIC and by calculating the average expression. |
| Page: 1 |
Top |
Somatic mutation of malignant transformation related genes |
| Annotation of somatic variants for genes involved in malignant transformation |
| Hugo Symbol | Variant Class | Variant Classification | dbSNP RS | HGVSc | HGVSp | HGVSp Short | SWISSPROT | BIOTYPE | SIFT | PolyPhen | Tumor Sample Barcode | Tissue | Histology | Sex | Age | Stage | Therapy Types | Drugs | Outcome |
| MRPS25 | SNV | Missense_Mutation | novel | c.215N>T | p.Pro72Leu | p.P72L | P82663 | protein_coding | deleterious(0) | probably_damaging(1) | TCGA-AA-3492-01 | Colorectum | colon adenocarcinoma | Female | >=65 | I/II | Unknown | Unknown | SD |
| MRPS25 | SNV | Missense_Mutation | novel | c.8N>C | p.Met3Thr | p.M3T | P82663 | protein_coding | deleterious(0) | possibly_damaging(0.69) | TCGA-AA-A01R-01 | Colorectum | colon adenocarcinoma | Male | <65 | III/IV | Chemotherapy | 5-fluorouracil | PD |
| MRPS25 | SNV | Missense_Mutation | rs750588798 | c.388N>A | p.Gly130Ser | p.G130S | P82663 | protein_coding | deleterious(0.02) | probably_damaging(0.999) | TCGA-A5-A0G1-01 | Endometrium | uterine corpus endometrioid carcinoma | Female | >=65 | I/II | Unknown | Unknown | SD |
| MRPS25 | SNV | Missense_Mutation | rs762185729 | c.230N>A | p.Arg77Gln | p.R77Q | P82663 | protein_coding | tolerated(0.17) | benign(0.078) | TCGA-AJ-A3EL-01 | Endometrium | uterine corpus endometrioid carcinoma | Female | <65 | I/II | Unknown | Unknown | SD |
| MRPS25 | SNV | Missense_Mutation | rs750455782 | c.496N>A | p.Ala166Thr | p.A166T | P82663 | protein_coding | tolerated(0.27) | benign(0) | TCGA-AP-A059-01 | Endometrium | uterine corpus endometrioid carcinoma | Female | >=65 | I/II | Unknown | Unknown | SD |
| MRPS25 | SNV | Missense_Mutation | c.288N>T | p.Lys96Asn | p.K96N | P82663 | protein_coding | tolerated(0.25) | benign(0.003) | TCGA-AP-A059-01 | Endometrium | uterine corpus endometrioid carcinoma | Female | >=65 | I/II | Unknown | Unknown | SD | |
| MRPS25 | SNV | Missense_Mutation | novel | c.215N>T | p.Pro72Leu | p.P72L | P82663 | protein_coding | deleterious(0) | probably_damaging(1) | TCGA-AP-A0LM-01 | Endometrium | uterine corpus endometrioid carcinoma | Female | <65 | III/IV | Chemotherapy | cisplatin | SD |
| MRPS25 | SNV | Missense_Mutation | novel | c.206A>G | p.Asn69Ser | p.N69S | P82663 | protein_coding | deleterious(0) | probably_damaging(0.946) | TCGA-B5-A3FC-01 | Endometrium | uterine corpus endometrioid carcinoma | Female | <65 | I/II | Unknown | Unknown | SD |
| MRPS25 | SNV | Missense_Mutation | novel | c.89N>C | p.Met30Thr | p.M30T | P82663 | protein_coding | deleterious(0) | benign(0.273) | TCGA-BK-A13B-01 | Endometrium | uterine corpus endometrioid carcinoma | Female | <65 | I/II | Unknown | Unknown | PD |
| MRPS25 | SNV | Missense_Mutation | rs143426565 | c.395N>A | p.Arg132Gln | p.R132Q | P82663 | protein_coding | tolerated(0.32) | benign(0.001) | TCGA-D1-A17Q-01 | Endometrium | uterine corpus endometrioid carcinoma | Female | <65 | I/II | Unknown | Unknown | SD |
| Page: 1 2 |
Top |
Related drugs of malignant transformation related genes |
| Identification of chemicals and drugs interact with genes involved in malignant transfromation |
| (DGIdb 4.0) |
| Entrez ID | Symbol | Category | Interaction Types | Drug Claim Name | Drug Name | PMIDs |
| Page: 1 |

Copyright 2023-Present -The University of Texas Health Science Center at Houston |