
|
|||||
|
 | |
| |
| |
| |
| |
| |
|
Gene: MRPS24 |
Gene summary for MRPS24 |
| Gene information | Species | Human | Gene symbol | MRPS24 | Gene ID | 64951 |
| Gene name | mitochondrial ribosomal protein S24 | |
| Gene Alias | HSPC335 | |
| Cytomap | 7p13 | |
| Gene Type | protein-coding | GO ID | GO:0006412 | UniProtAcc | Q96EL2 |
Top |
Malignant transformation analysis |
| Identification of the aberrant gene expression in precancerous and cancerous lesions by comparing the gene expression of stem-like cells in diseased tissues with normal stem cells |
| Entrez ID | Symbol | Replicates | Species | Organ | Tissue | Adj P-value | Log2FC | Malignancy |
| 64951 | MRPS24 | sample1 | Human | Cervix | CC | 6.70e-16 | 6.29e-01 | 0.0959 |
| 64951 | MRPS24 | sample3 | Human | Cervix | CC | 9.30e-31 | 4.74e-01 | 0.1387 |
| 64951 | MRPS24 | H2 | Human | Cervix | HSIL_HPV | 1.22e-12 | 3.52e-01 | 0.0632 |
| 64951 | MRPS24 | L1 | Human | Cervix | CC | 1.47e-09 | 4.89e-01 | 0.0802 |
| 64951 | MRPS24 | T1 | Human | Cervix | CC | 7.22e-29 | 6.48e-01 | 0.0918 |
| 64951 | MRPS24 | T2 | Human | Cervix | CC | 4.60e-15 | 6.42e-01 | 0.0709 |
| 64951 | MRPS24 | T3 | Human | Cervix | CC | 1.51e-31 | 4.69e-01 | 0.1389 |
| 64951 | MRPS24 | HTA11_3410_2000001011 | Human | Colorectum | AD | 2.10e-20 | 4.19e-01 | 0.0155 |
| 64951 | MRPS24 | HTA11_2487_2000001011 | Human | Colorectum | SER | 2.65e-28 | 7.17e-01 | -0.1808 |
| 64951 | MRPS24 | HTA11_2951_2000001011 | Human | Colorectum | AD | 1.20e-12 | 6.95e-01 | 0.0216 |
| 64951 | MRPS24 | HTA11_1938_2000001011 | Human | Colorectum | AD | 3.90e-21 | 6.50e-01 | -0.0811 |
| 64951 | MRPS24 | HTA11_78_2000001011 | Human | Colorectum | AD | 5.51e-17 | 4.17e-01 | -0.1088 |
| 64951 | MRPS24 | HTA11_347_2000001011 | Human | Colorectum | AD | 5.41e-38 | 7.09e-01 | -0.1954 |
| 64951 | MRPS24 | HTA11_411_2000001011 | Human | Colorectum | SER | 4.42e-10 | 6.00e-01 | -0.2602 |
| 64951 | MRPS24 | HTA11_2112_2000001011 | Human | Colorectum | SER | 8.76e-08 | 4.24e-01 | -0.2196 |
| 64951 | MRPS24 | HTA11_3361_2000001011 | Human | Colorectum | AD | 3.54e-19 | 6.31e-01 | -0.1207 |
| 64951 | MRPS24 | HTA11_83_2000001011 | Human | Colorectum | SER | 2.68e-22 | 7.34e-01 | -0.1526 |
| 64951 | MRPS24 | HTA11_696_2000001011 | Human | Colorectum | AD | 3.10e-42 | 7.89e-01 | -0.1464 |
| 64951 | MRPS24 | HTA11_866_2000001011 | Human | Colorectum | AD | 2.11e-21 | 4.36e-01 | -0.1001 |
| 64951 | MRPS24 | HTA11_1391_2000001011 | Human | Colorectum | AD | 1.75e-40 | 9.19e-01 | -0.059 |
| Page: 1 2 3 4 5 6 7 8 9 10 |
| Tissue | Expression Dynamics | Abbreviation |
| Cervix | 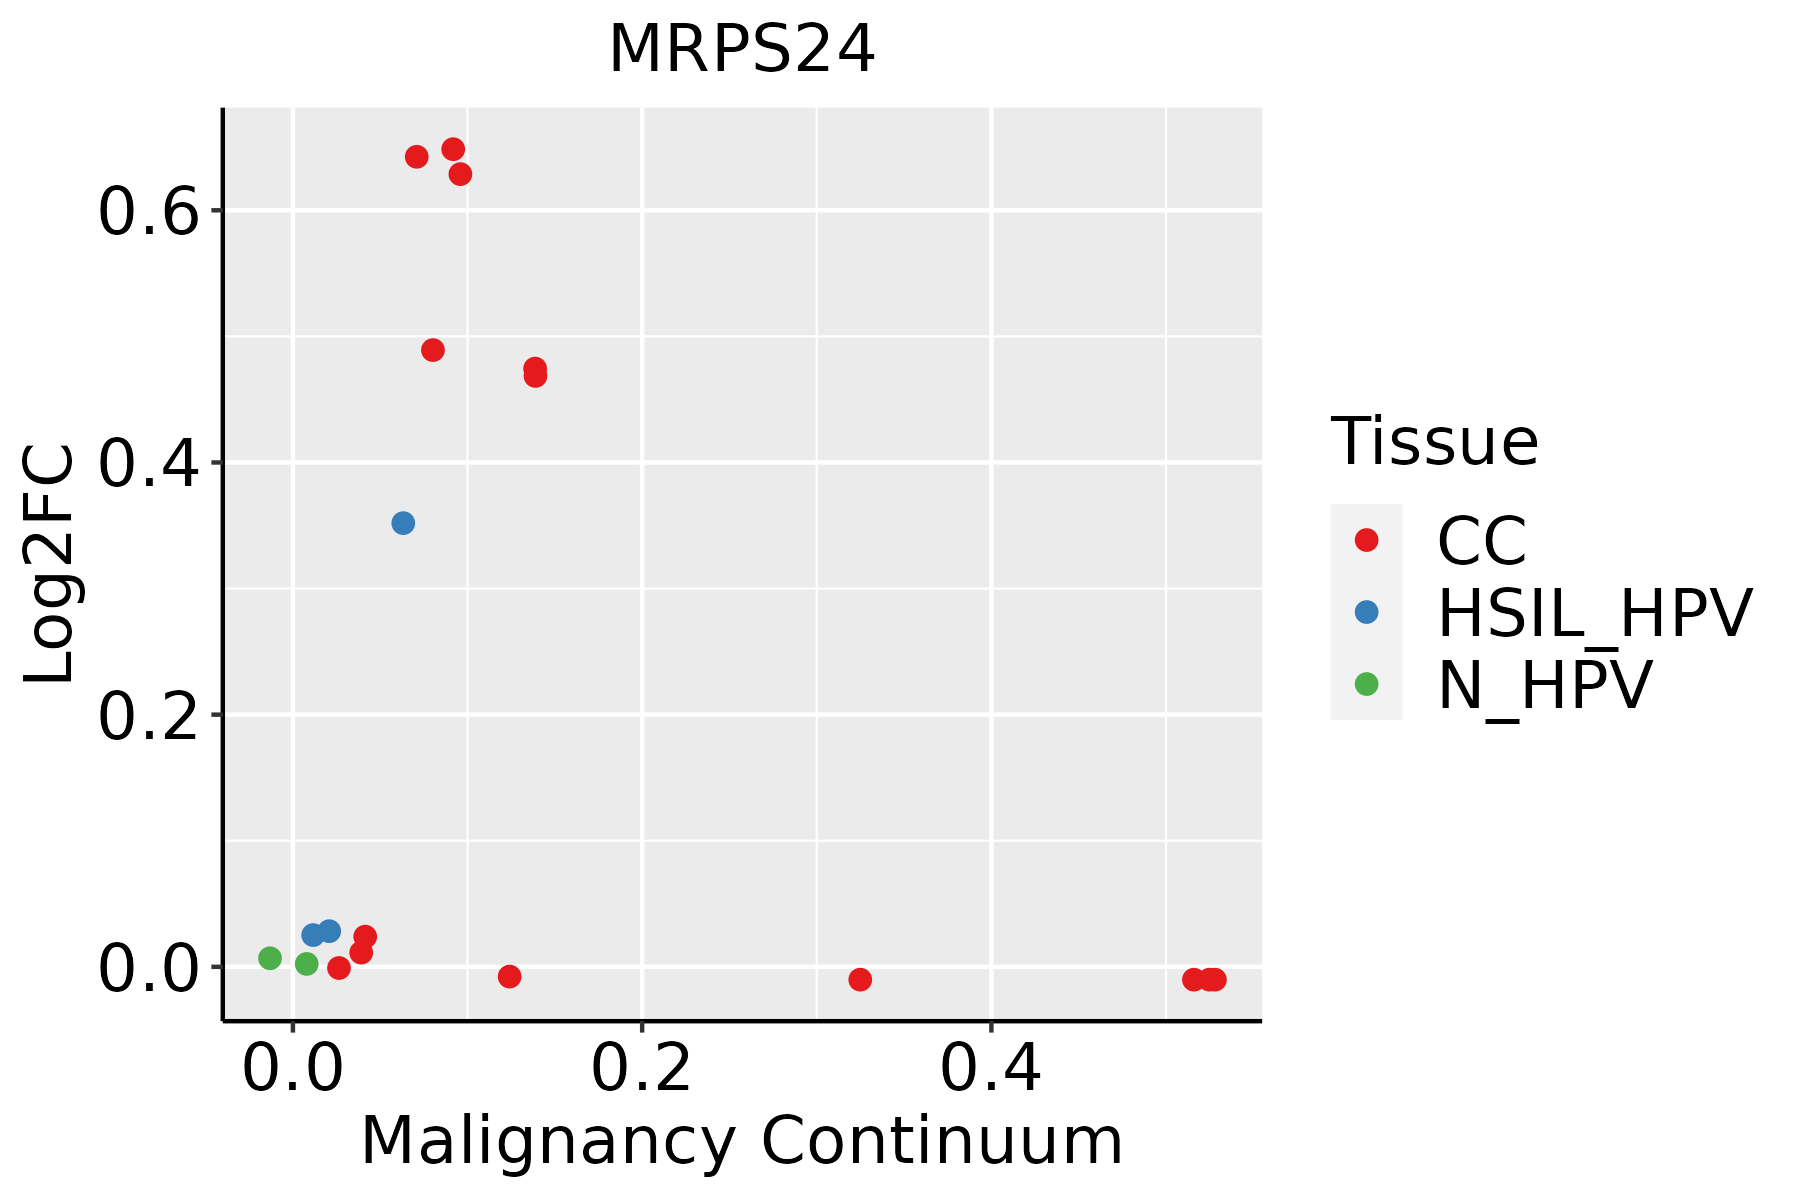 | CC: Cervix cancer |
| HSIL_HPV: HPV-infected high-grade squamous intraepithelial lesions | ||
| N_HPV: HPV-infected normal cervix | ||
| Colorectum (GSE201348) |  | FAP: Familial adenomatous polyposis |
| CRC: Colorectal cancer | ||
| Colorectum (HTA11) |  | AD: Adenomas |
| SER: Sessile serrated lesions | ||
| MSI-H: Microsatellite-high colorectal cancer | ||
| MSS: Microsatellite stable colorectal cancer | ||
| Esophagus | 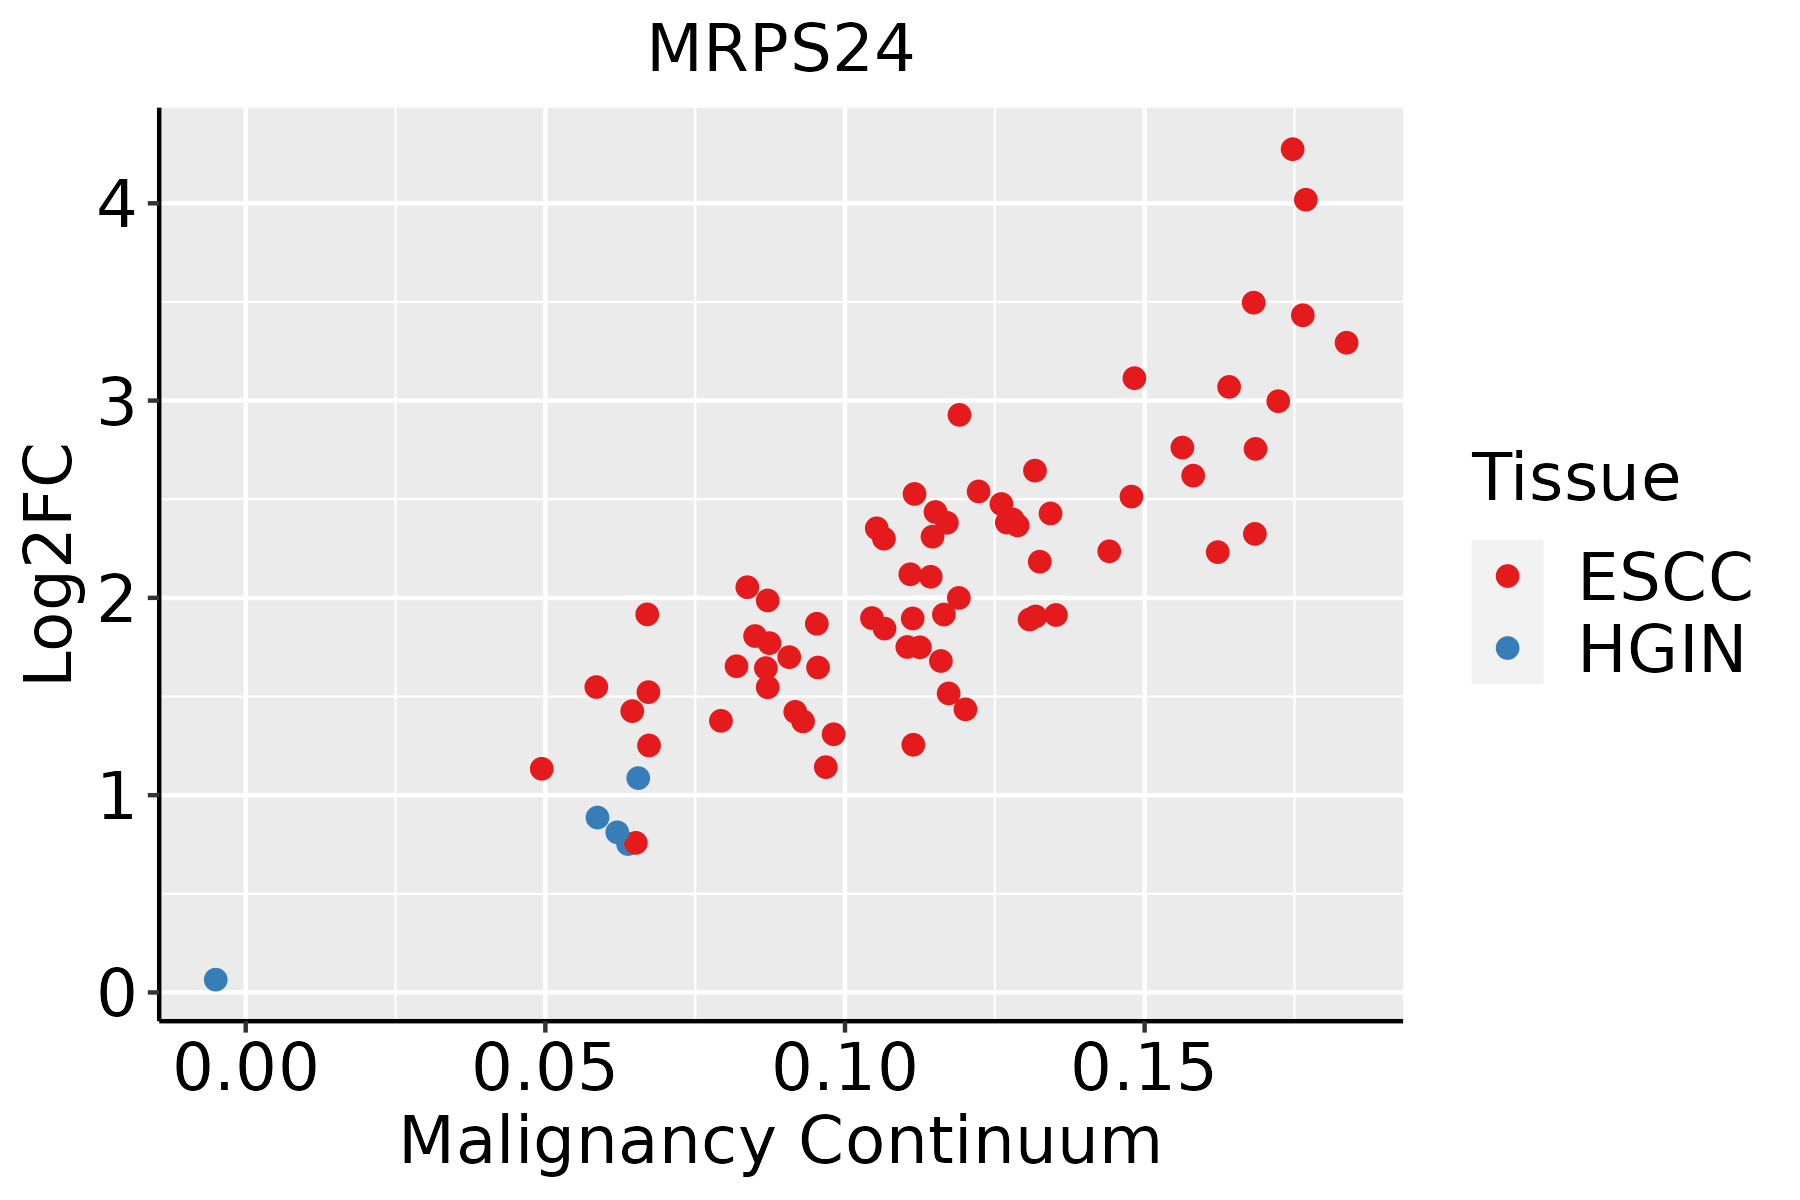 | ESCC: Esophageal squamous cell carcinoma |
| HGIN: High-grade intraepithelial neoplasias | ||
| LGIN: Low-grade intraepithelial neoplasias | ||
| GC |  | CAG: Chronic atrophic gastritis |
| CAG with IM: Chronic atrophic gastritis with intestinal metaplasia | ||
| CSG: Chronic superficial gastritis | ||
| GC: Gastric cancer | ||
| SIM: Severe intestinal metaplasia | ||
| WIM: Wild intestinal metaplasia | ||
| Liver | 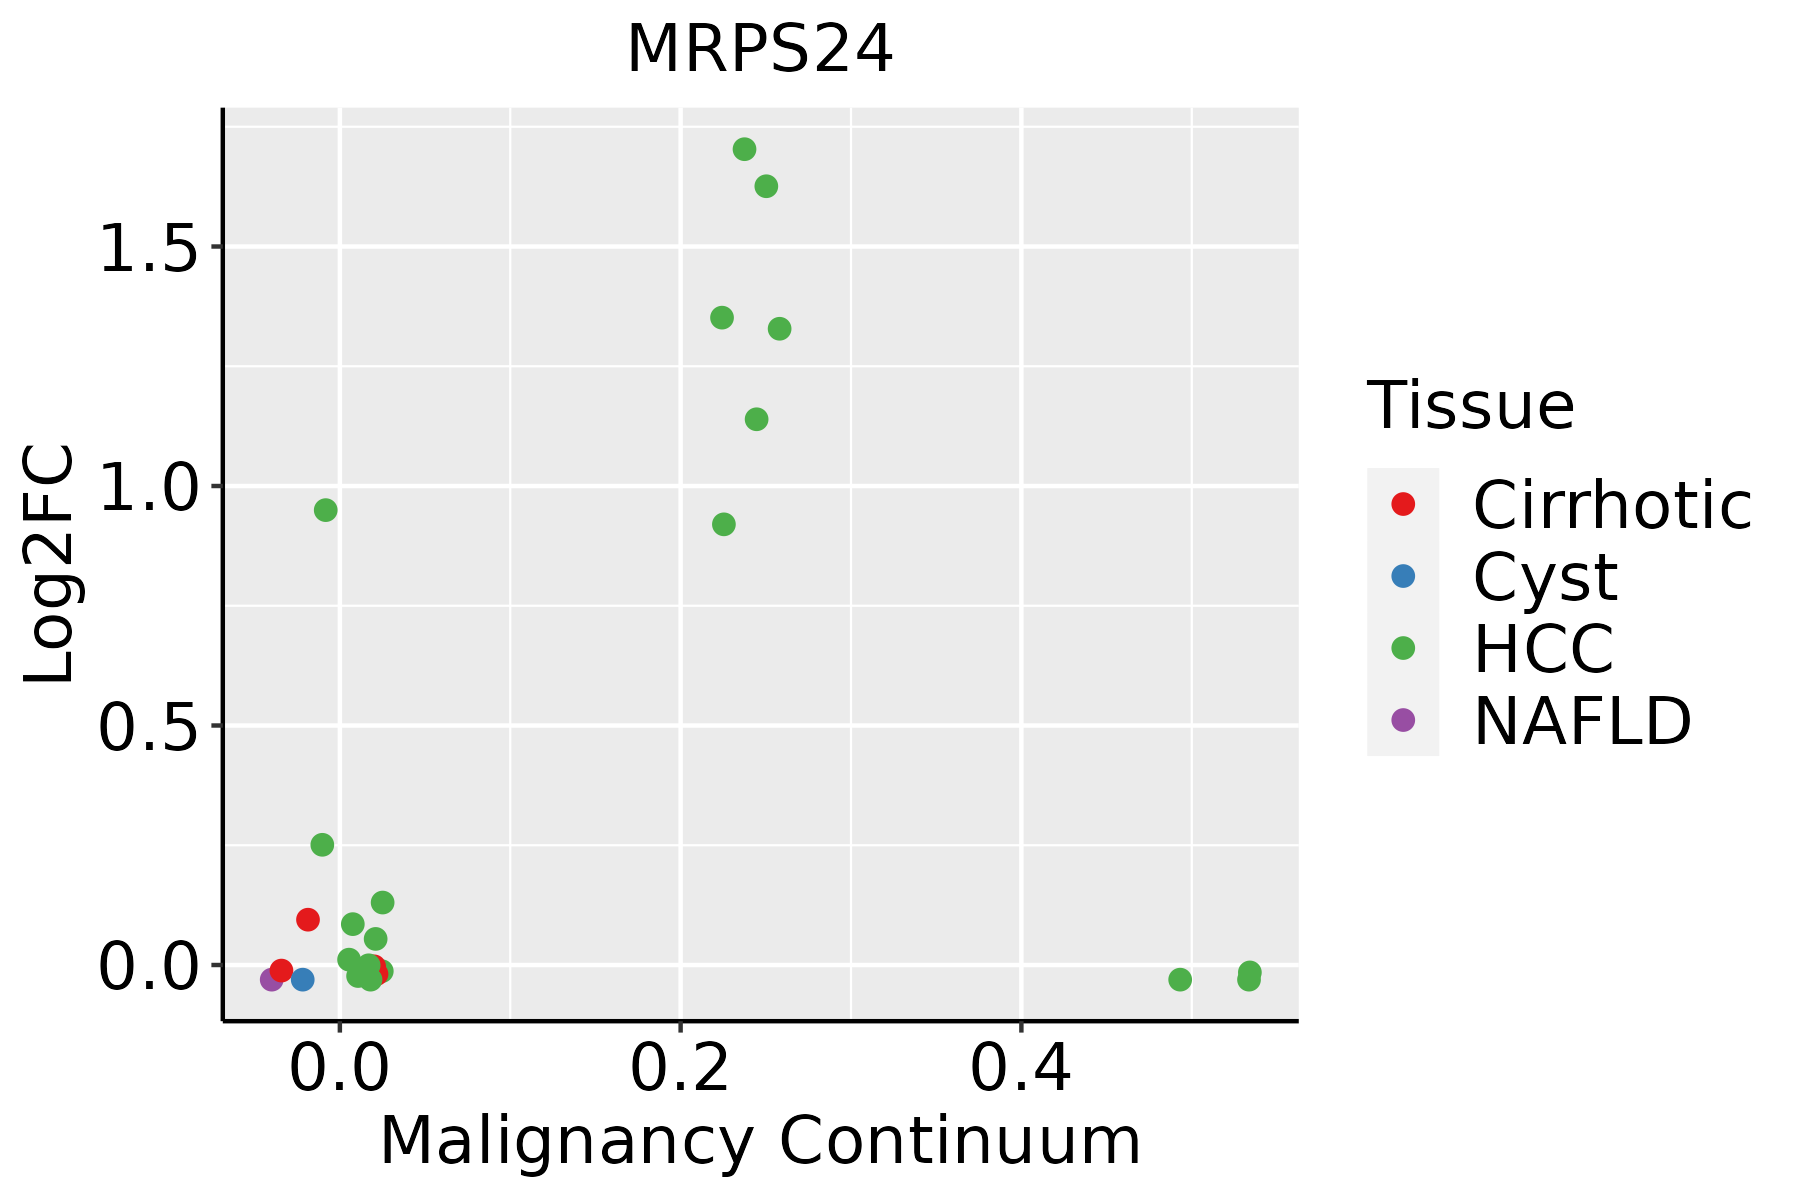 | HCC: Hepatocellular carcinoma |
| NAFLD: Non-alcoholic fatty liver disease | ||
| Prostate | 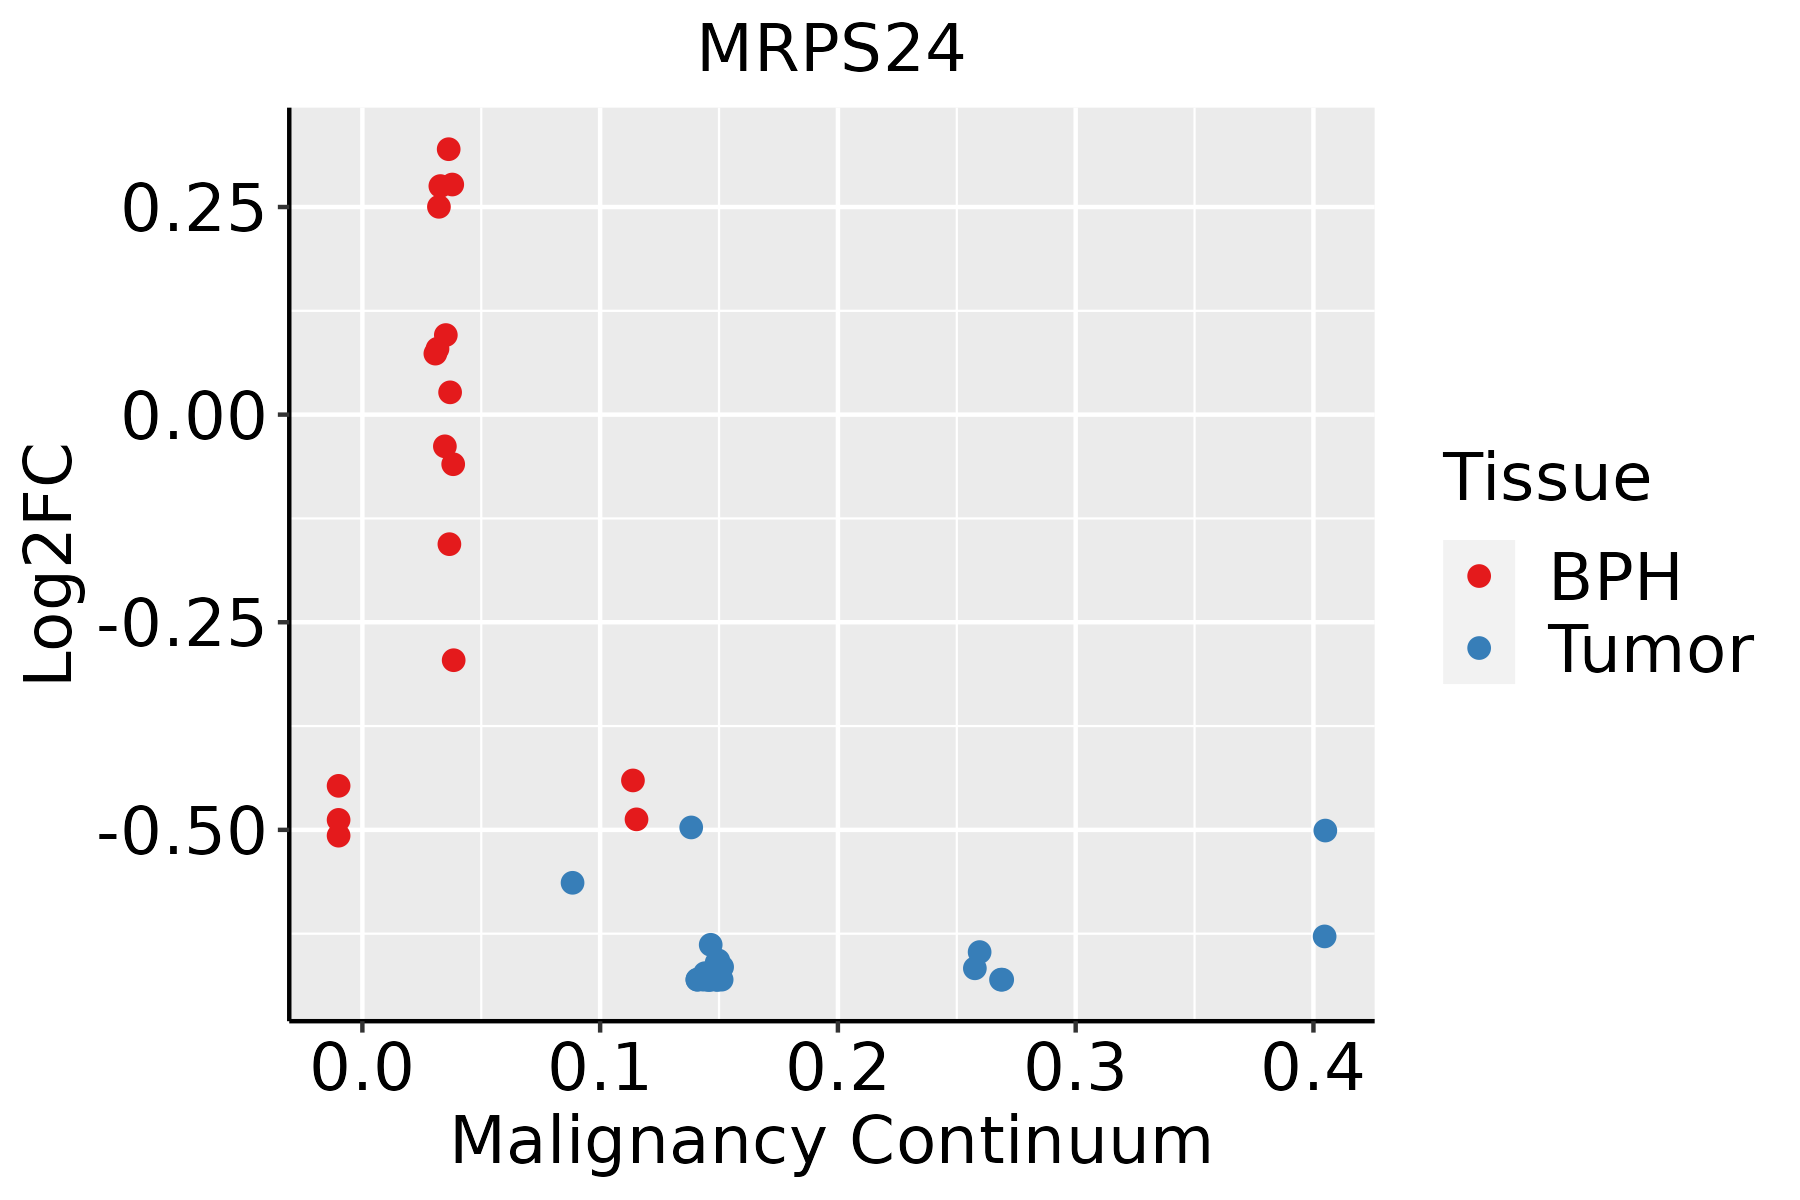 | BPH: Benign Prostatic Hyperplasia |
| Skin | 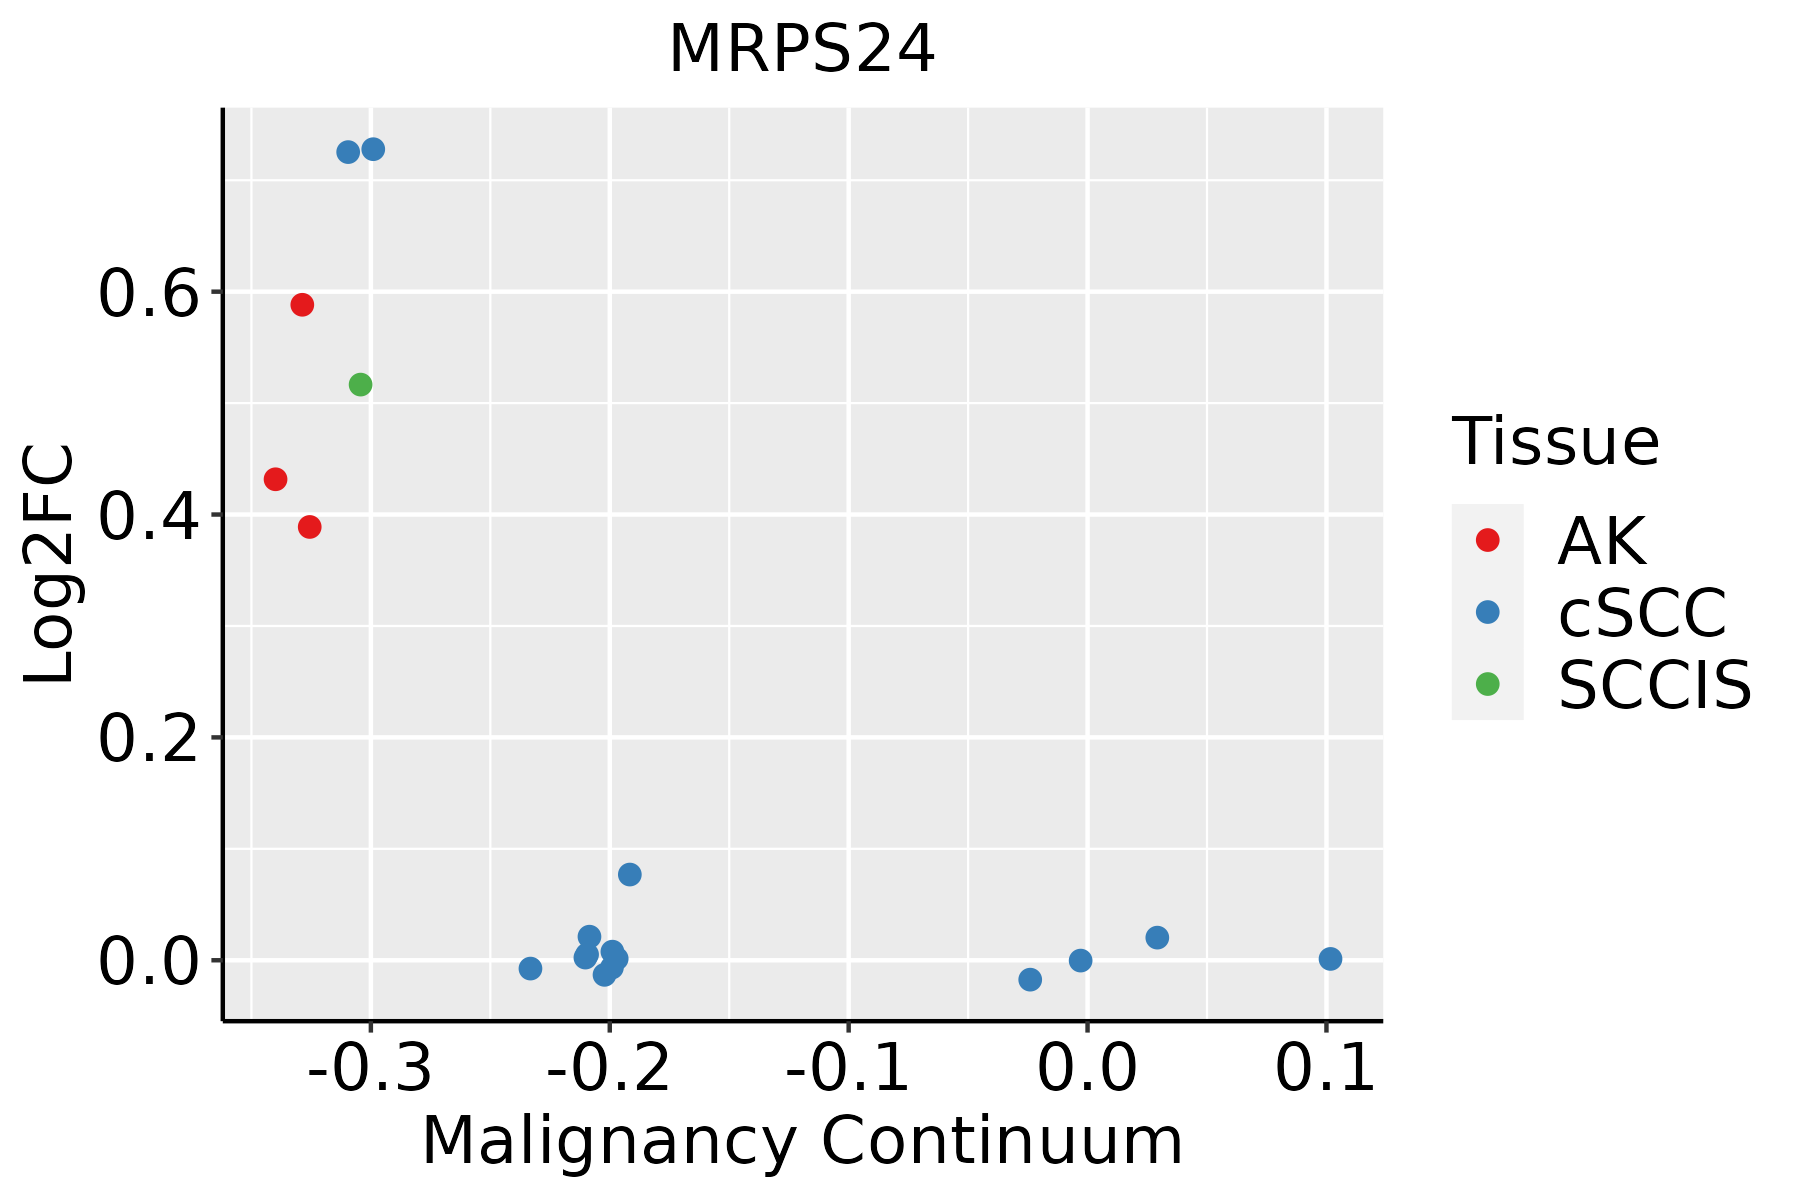 | AK: Actinic keratosis |
| cSCC: Cutaneous squamous cell carcinoma | ||
| SCCIS:squamous cell carcinoma in situ |
| ∗log2FC in expression of this searched gene in stem-like cells from each diseased tissue sample relative to stem-like cells in normal samples in each tissue plotted against the malignancy continuum. Samples are colored based on if they are from different disease stage. |
Top |
Malignant transformation related pathway analysis |
| Find out the enriched GO biological processes and KEGG pathways involved in transition from healthy to precancer to cancer |
| Tissue | Disease Stage | Enriched GO biological Processes |
| Colorectum | AD |  |
| Colorectum | SER |  |
| Colorectum | MSS |  |
| Colorectum | MSI-H |  |
| Colorectum | FAP |  |
| ∗Top 15 enriched GO BP terms are showed in the bar plot of each disease state in each tissue. Each row represents a significant GO biological process which is colored according to the -log10(p.adjust). |
| Page: 1 2 3 4 5 6 7 8 9 |
| GO ID | Tissue | Disease Stage | Description | Gene Ratio | Bg Ratio | pvalue | p.adjust | Count |
| GO:00325435 | Esophagus | HGIN | mitochondrial translation | 23/2587 | 76/18723 | 1.61e-04 | 3.16e-03 | 23 |
| GO:01400534 | Esophagus | HGIN | mitochondrial gene expression | 27/2587 | 108/18723 | 1.34e-03 | 1.57e-02 | 27 |
| GO:014005313 | Esophagus | ESCC | mitochondrial gene expression | 93/8552 | 108/18723 | 1.96e-18 | 2.03e-16 | 93 |
| GO:003254314 | Esophagus | ESCC | mitochondrial translation | 68/8552 | 76/18723 | 1.02e-15 | 6.86e-14 | 68 |
| GO:01400531 | Liver | HCC | mitochondrial gene expression | 82/7958 | 108/18723 | 1.49e-12 | 7.20e-11 | 82 |
| GO:00325431 | Liver | HCC | mitochondrial translation | 62/7958 | 76/18723 | 2.95e-12 | 1.34e-10 | 62 |
| GO:00325433 | Prostate | BPH | mitochondrial translation | 23/3107 | 76/18723 | 2.21e-03 | 1.22e-02 | 23 |
| GO:01400532 | Prostate | BPH | mitochondrial gene expression | 29/3107 | 108/18723 | 4.68e-03 | 2.25e-02 | 29 |
| GO:003254312 | Prostate | Tumor | mitochondrial translation | 24/3246 | 76/18723 | 1.73e-03 | 1.03e-02 | 24 |
| GO:014005311 | Prostate | Tumor | mitochondrial gene expression | 31/3246 | 108/18723 | 2.31e-03 | 1.30e-02 | 31 |
| GO:00325436 | Skin | cSCC | mitochondrial translation | 47/4864 | 76/18723 | 4.70e-11 | 2.22e-09 | 47 |
| GO:01400535 | Skin | cSCC | mitochondrial gene expression | 56/4864 | 108/18723 | 8.06e-09 | 2.56e-07 | 56 |
| Page: 1 |
| Pathway ID | Tissue | Disease Stage | Description | Gene Ratio | Bg Ratio | pvalue | p.adjust | qvalue | Count |
| Page: 1 |
Top |
Cell-cell communication analysis |
| Identification of potential cell-cell interactions between two cell types and their ligand-receptor pairs for different disease states |
| Ligand | Receptor | LRpair | Pathway | Tissue | Disease Stage |
| Page: 1 |
Top |
Single-cell gene regulatory network inference analysis |
| Find out the significant the regulons (TFs) and the target genes of each regulon across cell types for different disease states |
| TF | Cell Type | Tissue | Disease Stage | Target Gene | RSS | Regulon Activity |
| ∗The dot plots of a searched regulon are shown for all cell subpopulations in each disease state of each tissue based on the regulon specific score inferred using pySCENIC and by calculating the average expression. |
| Page: 1 |
Top |
Somatic mutation of malignant transformation related genes |
| Annotation of somatic variants for genes involved in malignant transformation |
| Hugo Symbol | Variant Class | Variant Classification | dbSNP RS | HGVSc | HGVSp | HGVSp Short | SWISSPROT | BIOTYPE | SIFT | PolyPhen | Tumor Sample Barcode | Tissue | Histology | Sex | Age | Stage | Therapy Types | Drugs | Outcome |
| MRPS24 | SNV | Missense_Mutation | rs370194870 | c.277C>T | p.Arg93Cys | p.R93C | Q96EL2 | protein_coding | deleterious(0.01) | benign(0.034) | TCGA-AN-A046-01 | Breast | breast invasive carcinoma | Female | >=65 | I/II | Unknown | Unknown | SD |
| MRPS24 | insertion | In_Frame_Ins | novel | c.470_471insATTTCATTCCAA | p.Thr157_Val158insPheHisSerAsn | p.T157_V158insFHSN | Q96EL2 | protein_coding | TCGA-A2-A0EQ-01 | Breast | breast invasive carcinoma | Female | <65 | I/II | Chemotherapy | adriamycin | SD | ||
| MRPS24 | insertion | Nonsense_Mutation | novel | c.360_361insCATCGATACTAAACTCTTATCGAGTGCCTCCTCCGG | p.Cys120_Ala121insHisArgTyrTerThrLeuIleGluCysLeuLeuArg | p.C120_A121insHRY*TLIECLLR | Q96EL2 | protein_coding | TCGA-B6-A0IA-01 | Breast | breast invasive carcinoma | Female | <65 | I/II | Unknown | Unknown | SD | ||
| MRPS24 | SNV | Missense_Mutation | rs375775056 | c.334C>T | p.Arg112Cys | p.R112C | Q96EL2 | protein_coding | deleterious(0) | probably_damaging(0.947) | TCGA-C5-A7UE-01 | Cervix | cervical & endocervical cancer | Female | <65 | I/II | Chemotherapy | cisplatin | SD |
| MRPS24 | SNV | Missense_Mutation | rs746219127 | c.175C>T | p.Pro59Ser | p.P59S | Q96EL2 | protein_coding | deleterious(0) | probably_damaging(1) | TCGA-IR-A3LA-01 | Cervix | cervical & endocervical cancer | Female | <65 | I/II | Chemotherapy | cisplatin | CR |
| MRPS24 | SNV | Missense_Mutation | c.406N>A | p.Val136Met | p.V136M | Q96EL2 | protein_coding | deleterious(0.01) | probably_damaging(0.951) | TCGA-AA-3864-01 | Colorectum | colon adenocarcinoma | Male | >=65 | I/II | Unknown | Unknown | SD | |
| MRPS24 | SNV | Missense_Mutation | rs778186629 | c.257C>T | p.Thr86Met | p.T86M | Q96EL2 | protein_coding | deleterious(0.04) | probably_damaging(0.96) | TCGA-D5-6930-01 | Colorectum | colon adenocarcinoma | Male | >=65 | I/II | Unknown | Unknown | SD |
| MRPS24 | SNV | Missense_Mutation | rs747409691 | c.254N>A | p.Arg85Gln | p.R85Q | Q96EL2 | protein_coding | tolerated(0.07) | possibly_damaging(0.784) | TCGA-EI-6882-01 | Colorectum | rectum adenocarcinoma | Male | <65 | I/II | Unknown | Unknown | SD |
| MRPS24 | SNV | Missense_Mutation | c.22G>C | p.Gly8Arg | p.G8R | Q96EL2 | protein_coding | tolerated_low_confidence(0.58) | benign(0) | TCGA-F5-6811-01 | Colorectum | rectum adenocarcinoma | Female | >=65 | I/II | Unknown | Unknown | SD | |
| MRPS24 | SNV | Missense_Mutation | novel | c.317A>G | p.Asp106Gly | p.D106G | Q96EL2 | protein_coding | deleterious(0.02) | possibly_damaging(0.843) | TCGA-A5-A0G2-01 | Endometrium | uterine corpus endometrioid carcinoma | Female | <65 | III/IV | Unknown | Unknown | SD |
| Page: 1 2 |
Top |
Related drugs of malignant transformation related genes |
| Identification of chemicals and drugs interact with genes involved in malignant transfromation |
| (DGIdb 4.0) |
| Entrez ID | Symbol | Category | Interaction Types | Drug Claim Name | Drug Name | PMIDs |
| Page: 1 |

Copyright 2023-Present -The University of Texas Health Science Center at Houston |