
|
|||||
|
 | |
| |
| |
| |
| |
| |
|
Gene: MRPS23 |
Gene summary for MRPS23 |
| Gene information | Species | Human | Gene symbol | MRPS23 | Gene ID | 51649 |
| Gene name | mitochondrial ribosomal protein S23 | |
| Gene Alias | CGI-138 | |
| Cytomap | 17q22 | |
| Gene Type | protein-coding | GO ID | GO:0006412 | UniProtAcc | Q9Y3D9 |
Top |
Malignant transformation analysis |
| Identification of the aberrant gene expression in precancerous and cancerous lesions by comparing the gene expression of stem-like cells in diseased tissues with normal stem cells |
| Entrez ID | Symbol | Replicates | Species | Organ | Tissue | Adj P-value | Log2FC | Malignancy |
| 51649 | MRPS23 | GSM4909286 | Human | Breast | IDC | 3.85e-02 | 1.89e-01 | 0.1081 |
| 51649 | MRPS23 | GSM4909290 | Human | Breast | IDC | 5.96e-09 | 3.76e-01 | 0.2096 |
| 51649 | MRPS23 | GSM4909294 | Human | Breast | IDC | 4.45e-16 | 5.63e-01 | 0.2022 |
| 51649 | MRPS23 | GSM4909296 | Human | Breast | IDC | 2.22e-05 | 1.05e-03 | 0.1524 |
| 51649 | MRPS23 | GSM4909308 | Human | Breast | IDC | 9.71e-05 | 2.35e-01 | 0.158 |
| 51649 | MRPS23 | GSM4909311 | Human | Breast | IDC | 1.85e-14 | -7.84e-02 | 0.1534 |
| 51649 | MRPS23 | GSM4909312 | Human | Breast | IDC | 2.47e-07 | 3.91e-02 | 0.1552 |
| 51649 | MRPS23 | GSM4909317 | Human | Breast | IDC | 4.31e-07 | 2.67e-01 | 0.1355 |
| 51649 | MRPS23 | GSM4909318 | Human | Breast | IDC | 1.43e-03 | 4.86e-01 | 0.2031 |
| 51649 | MRPS23 | GSM4909319 | Human | Breast | IDC | 7.92e-18 | 1.02e-03 | 0.1563 |
| 51649 | MRPS23 | GSM4909320 | Human | Breast | IDC | 2.01e-02 | 8.63e-02 | 0.1575 |
| 51649 | MRPS23 | GSM4909321 | Human | Breast | IDC | 3.05e-09 | 1.63e-01 | 0.1559 |
| 51649 | MRPS23 | brca1 | Human | Breast | Precancer | 8.85e-08 | 3.46e-01 | -0.0338 |
| 51649 | MRPS23 | brca2 | Human | Breast | Precancer | 3.19e-02 | 2.26e-01 | -0.024 |
| 51649 | MRPS23 | M1 | Human | Breast | IDC | 2.80e-09 | 3.76e-01 | 0.1577 |
| 51649 | MRPS23 | NCCBC14 | Human | Breast | DCIS | 3.10e-04 | 2.77e-01 | 0.2021 |
| 51649 | MRPS23 | NCCBC2 | Human | Breast | DCIS | 1.62e-06 | 4.96e-01 | 0.1554 |
| 51649 | MRPS23 | NCCBC5 | Human | Breast | DCIS | 1.91e-04 | 1.70e-01 | 0.2046 |
| 51649 | MRPS23 | P1 | Human | Breast | IDC | 9.20e-03 | 4.71e-02 | 0.1527 |
| 51649 | MRPS23 | P2 | Human | Breast | IDC | 9.01e-10 | 4.80e-01 | 0.21 |
| Page: 1 2 3 4 5 6 7 8 |
| Tissue | Expression Dynamics | Abbreviation |
| Breast | 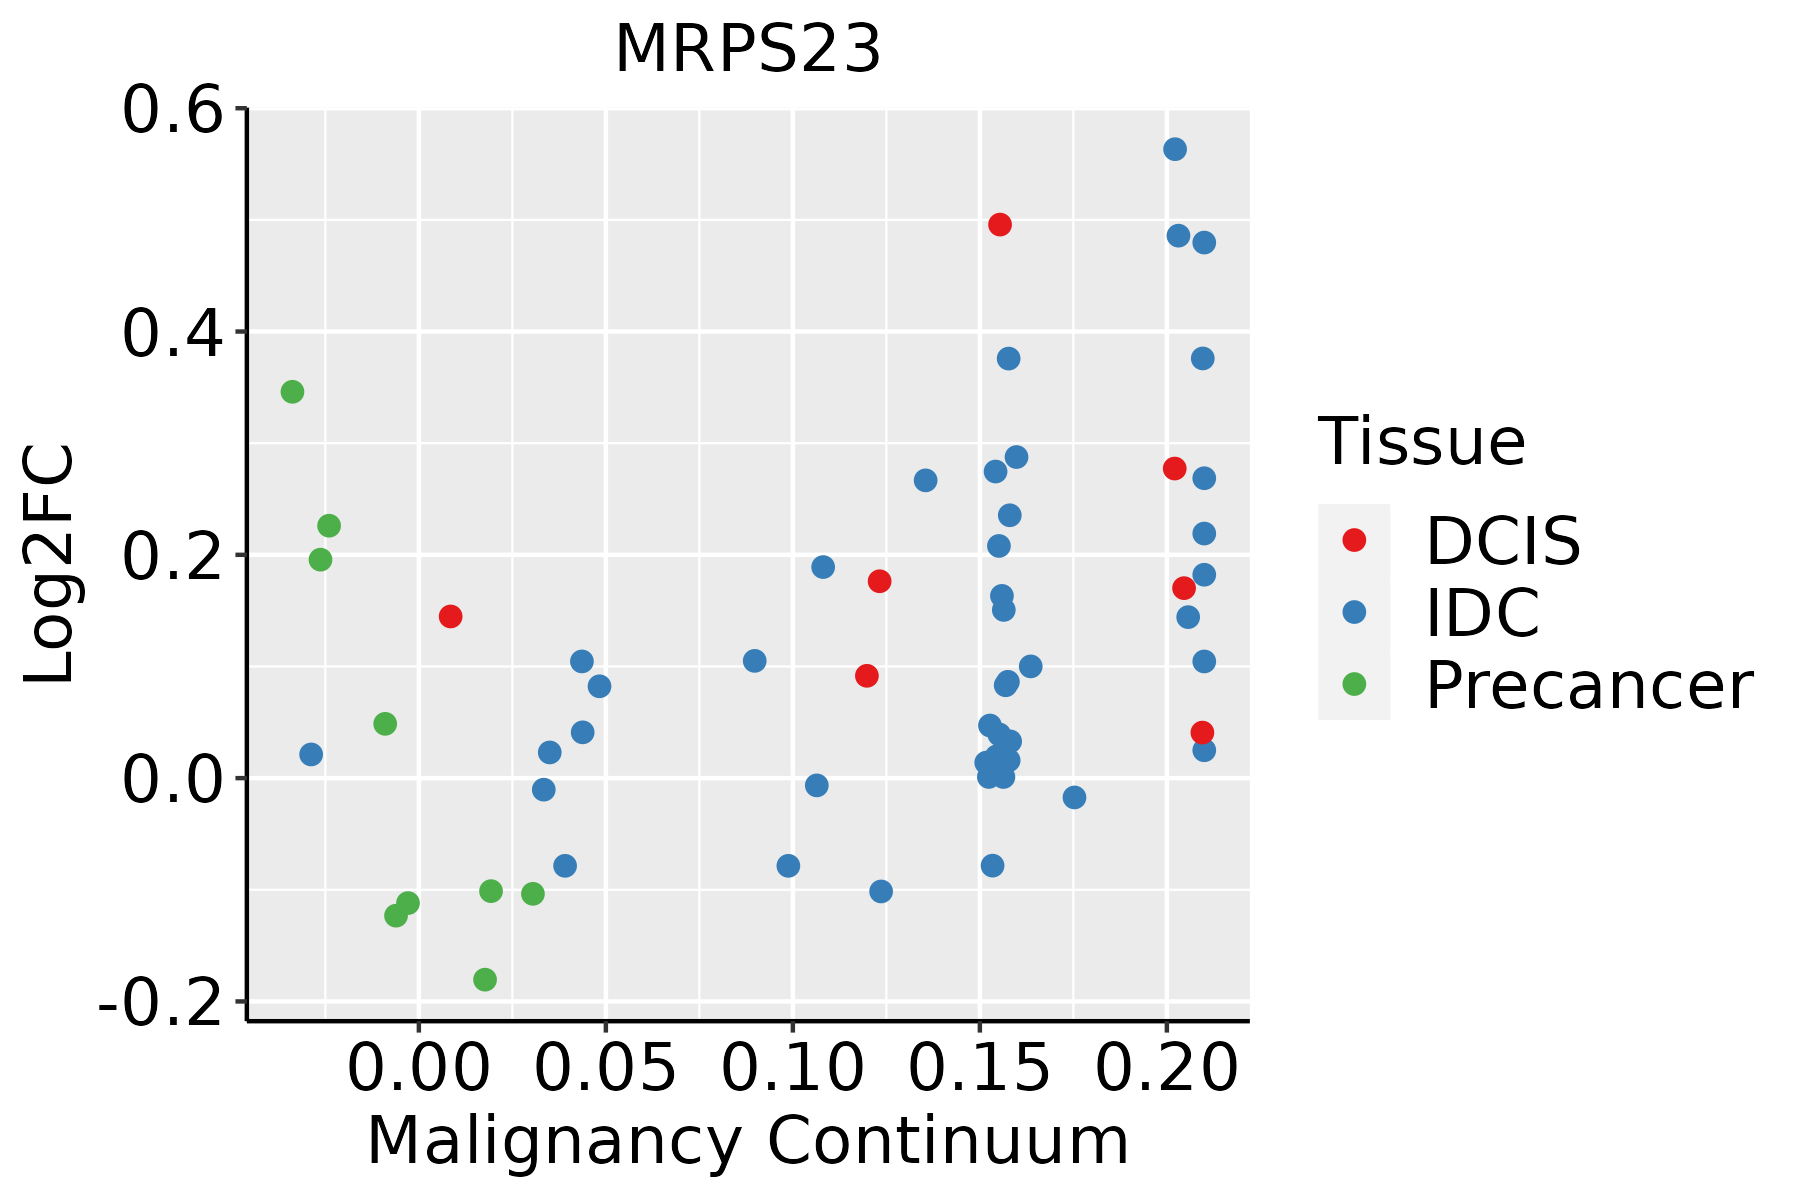 | IDC: Invasive ductal carcinoma |
| DCIS: Ductal carcinoma in situ | ||
| Precancer(BRCA1-mut): Precancerous lesion from BRCA1 mutation carriers | ||
| Colorectum (GSE201348) |  | FAP: Familial adenomatous polyposis |
| CRC: Colorectal cancer | ||
| Colorectum (HTA11) |  | AD: Adenomas |
| SER: Sessile serrated lesions | ||
| MSI-H: Microsatellite-high colorectal cancer | ||
| MSS: Microsatellite stable colorectal cancer | ||
| Esophagus |  | ESCC: Esophageal squamous cell carcinoma |
| HGIN: High-grade intraepithelial neoplasias | ||
| LGIN: Low-grade intraepithelial neoplasias | ||
| Liver | 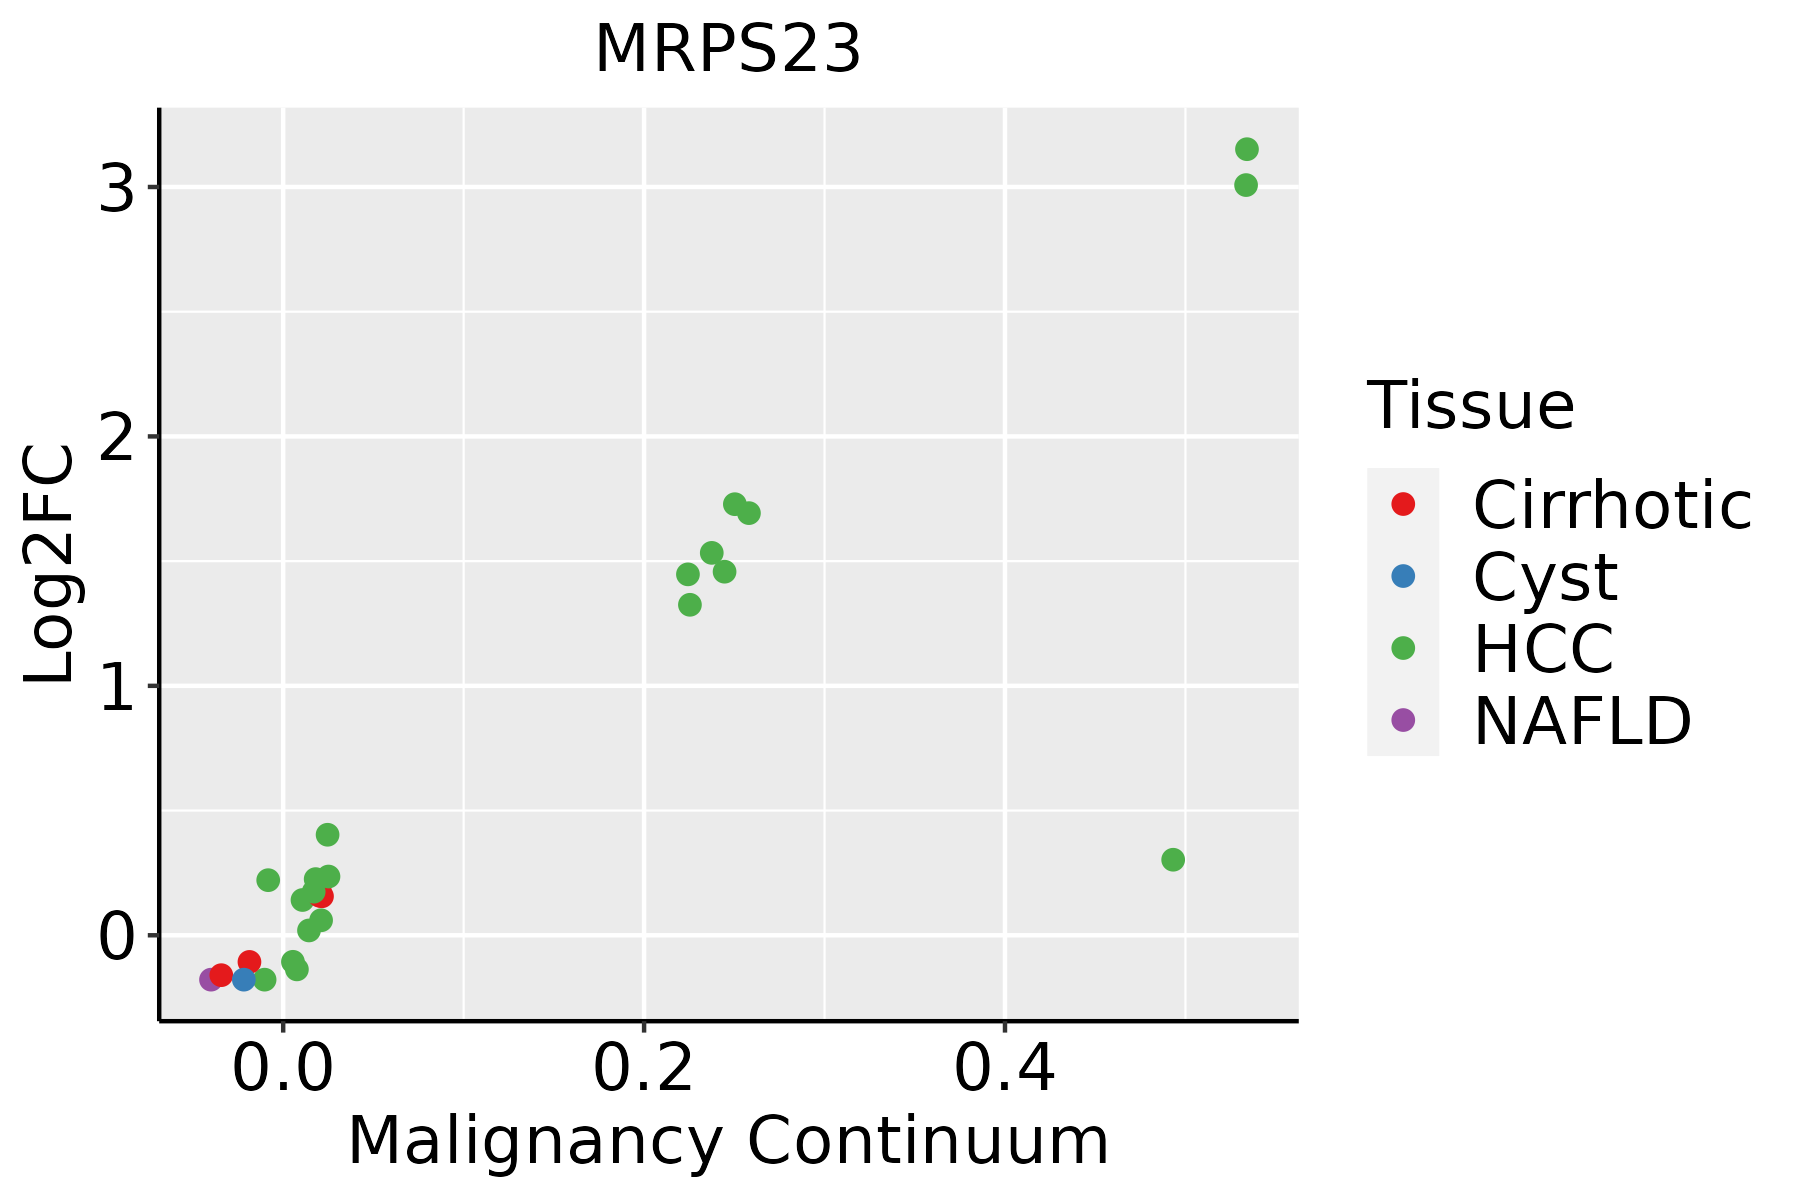 | HCC: Hepatocellular carcinoma |
| NAFLD: Non-alcoholic fatty liver disease | ||
| Oral Cavity | 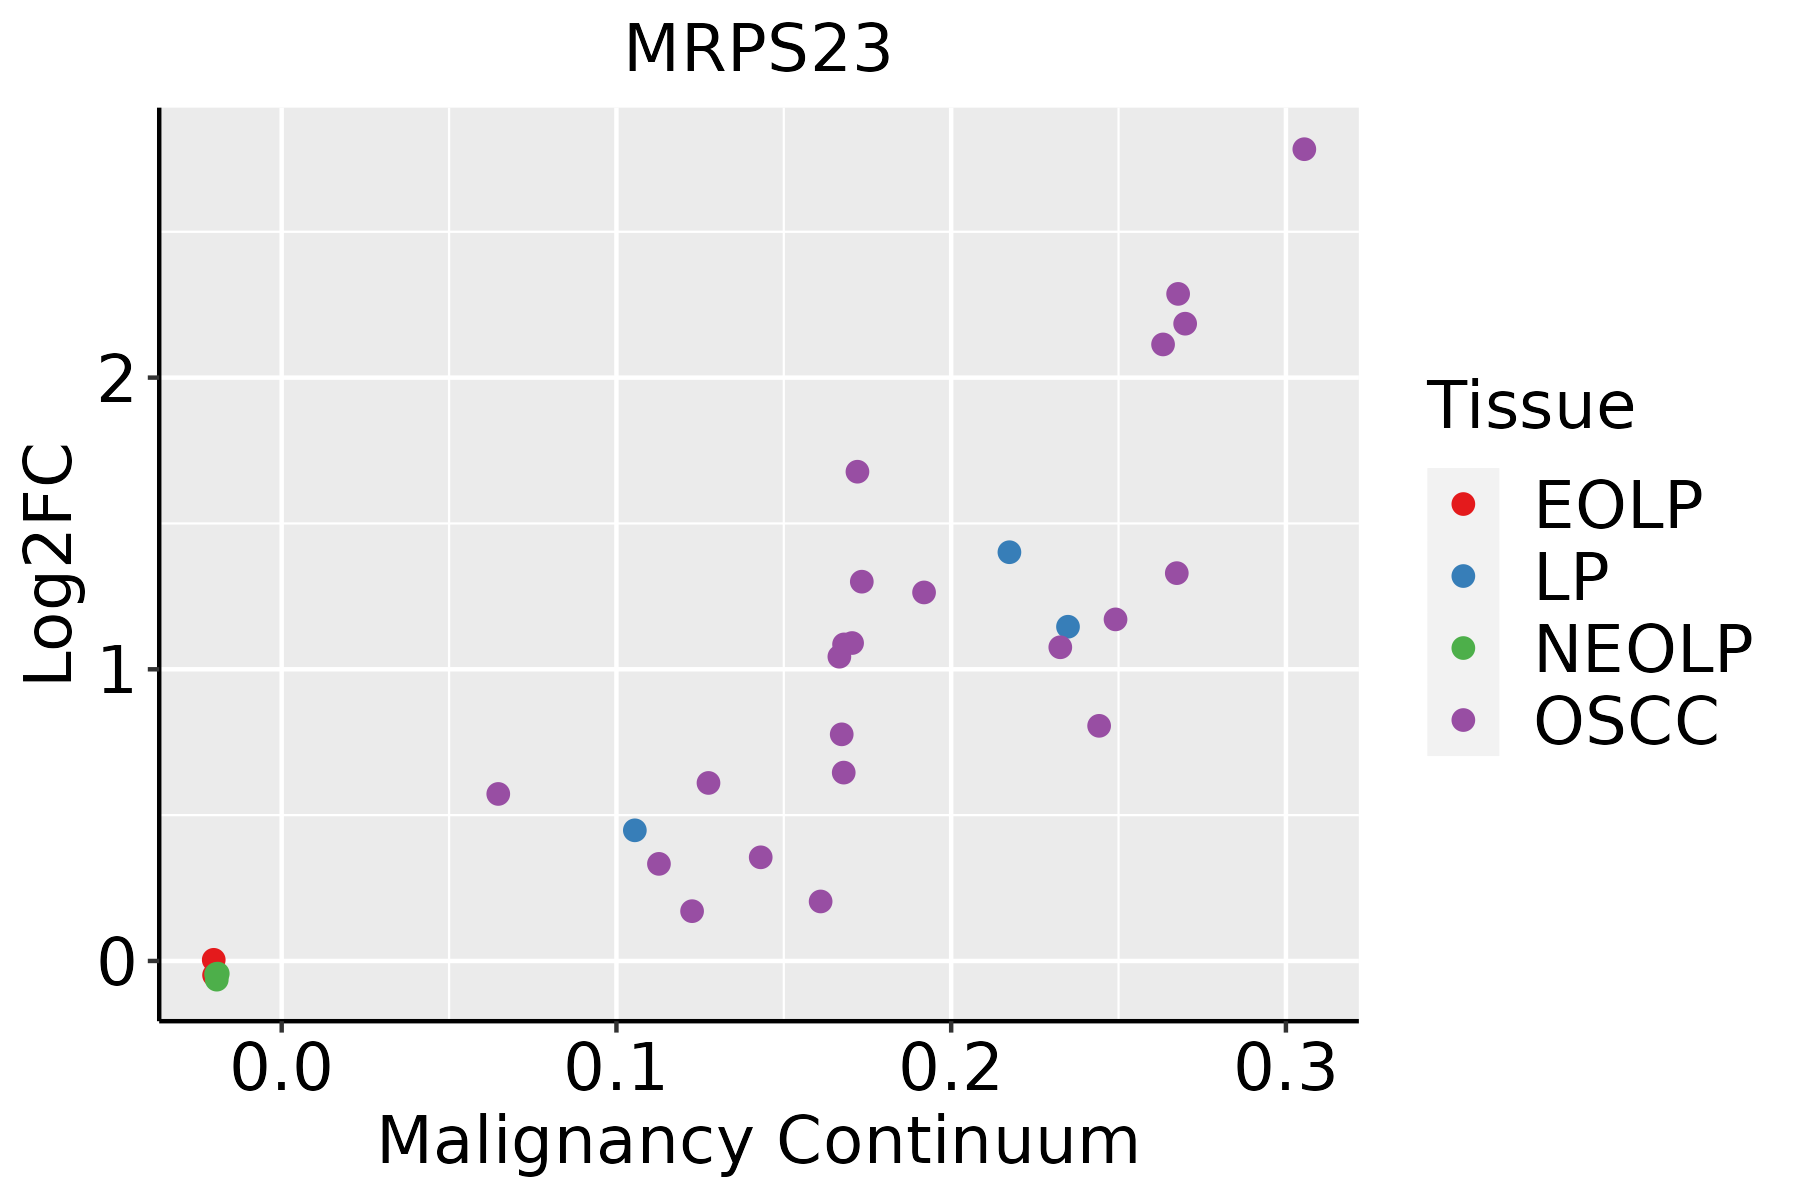 | EOLP: Erosive Oral lichen planus |
| LP: leukoplakia | ||
| NEOLP: Non-erosive oral lichen planus | ||
| OSCC: Oral squamous cell carcinoma | ||
| Skin |  | AK: Actinic keratosis |
| cSCC: Cutaneous squamous cell carcinoma | ||
| SCCIS:squamous cell carcinoma in situ | ||
| Thyroid |  | ATC: Anaplastic thyroid cancer |
| HT: Hashimoto's thyroiditis | ||
| PTC: Papillary thyroid cancer |
| ∗log2FC in expression of this searched gene in stem-like cells from each diseased tissue sample relative to stem-like cells in normal samples in each tissue plotted against the malignancy continuum. Samples are colored based on if they are from different disease stage. |
Top |
Malignant transformation related pathway analysis |
| Find out the enriched GO biological processes and KEGG pathways involved in transition from healthy to precancer to cancer |
| Tissue | Disease Stage | Enriched GO biological Processes |
| Colorectum | AD |  |
| Colorectum | SER |  |
| Colorectum | MSS |  |
| Colorectum | MSI-H |  |
| Colorectum | FAP |  |
| ∗Top 15 enriched GO BP terms are showed in the bar plot of each disease state in each tissue. Each row represents a significant GO biological process which is colored according to the -log10(p.adjust). |
| Page: 1 2 3 4 5 6 7 8 9 |
| GO ID | Tissue | Disease Stage | Description | Gene Ratio | Bg Ratio | pvalue | p.adjust | Count |
| Page: 1 |
| Pathway ID | Tissue | Disease Stage | Description | Gene Ratio | Bg Ratio | pvalue | p.adjust | qvalue | Count |
| Page: 1 |
Top |
Cell-cell communication analysis |
| Identification of potential cell-cell interactions between two cell types and their ligand-receptor pairs for different disease states |
| Ligand | Receptor | LRpair | Pathway | Tissue | Disease Stage |
| Page: 1 |
Top |
Single-cell gene regulatory network inference analysis |
| Find out the significant the regulons (TFs) and the target genes of each regulon across cell types for different disease states |
| TF | Cell Type | Tissue | Disease Stage | Target Gene | RSS | Regulon Activity |
| ∗The dot plots of a searched regulon are shown for all cell subpopulations in each disease state of each tissue based on the regulon specific score inferred using pySCENIC and by calculating the average expression. |
| Page: 1 |
Top |
Somatic mutation of malignant transformation related genes |
| Annotation of somatic variants for genes involved in malignant transformation |
| Hugo Symbol | Variant Class | Variant Classification | dbSNP RS | HGVSc | HGVSp | HGVSp Short | SWISSPROT | BIOTYPE | SIFT | PolyPhen | Tumor Sample Barcode | Tissue | Histology | Sex | Age | Stage | Therapy Types | Drugs | Outcome |
| MRPS23 | SNV | Missense_Mutation | novel | c.462G>C | p.Leu154Phe | p.L154F | Q9Y3D9 | protein_coding | tolerated(0.07) | benign(0.054) | TCGA-C8-A3M7-01 | Breast | breast invasive carcinoma | Female | <65 | III/IV | Unknown | Unknown | PD |
| MRPS23 | SNV | Missense_Mutation | rs145979934 | c.345N>T | p.Glu115Asp | p.E115D | Q9Y3D9 | protein_coding | tolerated(0.21) | benign(0.057) | TCGA-A6-6141-01 | Colorectum | colon adenocarcinoma | Male | <65 | I/II | Chemotherapy | 5-fu | SD |
| MRPS23 | SNV | Missense_Mutation | rs761410726 | c.439G>A | p.Val147Ile | p.V147I | Q9Y3D9 | protein_coding | tolerated(0.36) | benign(0) | TCGA-AA-3494-01 | Colorectum | colon adenocarcinoma | Male | <65 | III/IV | Chemotherapy | folinic | PR |
| MRPS23 | SNV | Missense_Mutation | rs371617294 | c.167N>A | p.Ala56Asp | p.A56D | Q9Y3D9 | protein_coding | tolerated(0.16) | probably_damaging(0.959) | TCGA-AP-A051-01 | Endometrium | uterine corpus endometrioid carcinoma | Female | >=65 | I/II | Unknown | Unknown | SD |
| MRPS23 | SNV | Missense_Mutation | rs760880323 | c.337N>T | p.Asp113Tyr | p.D113Y | Q9Y3D9 | protein_coding | deleterious(0) | probably_damaging(0.986) | TCGA-AP-A056-01 | Endometrium | uterine corpus endometrioid carcinoma | Female | <65 | I/II | Unknown | Unknown | SD |
| MRPS23 | SNV | Missense_Mutation | c.329G>T | p.Gly110Val | p.G110V | Q9Y3D9 | protein_coding | deleterious(0) | probably_damaging(0.997) | TCGA-AP-A0LF-01 | Endometrium | uterine corpus endometrioid carcinoma | Female | >=65 | III/IV | Unknown | Unknown | SD | |
| MRPS23 | SNV | Missense_Mutation | rs145979934 | c.345N>T | p.Glu115Asp | p.E115D | Q9Y3D9 | protein_coding | tolerated(0.21) | benign(0.057) | TCGA-AP-A1E0-01 | Endometrium | uterine corpus endometrioid carcinoma | Female | <65 | III/IV | Chemotherapy | paclitaxel | SD |
| MRPS23 | SNV | Missense_Mutation | novel | c.134T>C | p.Val45Ala | p.V45A | Q9Y3D9 | protein_coding | deleterious(0.01) | possibly_damaging(0.473) | TCGA-AX-A2HC-01 | Endometrium | uterine corpus endometrioid carcinoma | Female | <65 | III/IV | Chemotherapy | paclitaxel | PD |
| MRPS23 | SNV | Missense_Mutation | rs145979934 | c.345G>T | p.Glu115Asp | p.E115D | Q9Y3D9 | protein_coding | tolerated(0.21) | benign(0.057) | TCGA-EO-A3AV-01 | Endometrium | uterine corpus endometrioid carcinoma | Female | <65 | III/IV | Chemotherapy | carboplatin | CR |
| MRPS23 | SNV | Missense_Mutation | novel | c.292N>T | p.Arg98Trp | p.R98W | Q9Y3D9 | protein_coding | deleterious(0) | probably_damaging(0.994) | TCGA-FI-A2D0-01 | Endometrium | uterine corpus endometrioid carcinoma | Female | <65 | I/II | Unknown | Unknown | SD |
| Page: 1 2 |
Top |
Related drugs of malignant transformation related genes |
| Identification of chemicals and drugs interact with genes involved in malignant transfromation |
| (DGIdb 4.0) |
| Entrez ID | Symbol | Category | Interaction Types | Drug Claim Name | Drug Name | PMIDs |
| Page: 1 |

Copyright 2023-Present -The University of Texas Health Science Center at Houston |