
|
|||||
|
 | |
| |
| |
| |
| |
| |
|
Gene: MRPS2 |
Gene summary for MRPS2 |
| Gene information | Species | Human | Gene symbol | MRPS2 | Gene ID | 51116 |
| Gene name | mitochondrial ribosomal protein S2 | |
| Gene Alias | CGI-91 | |
| Cytomap | 9q34.3 | |
| Gene Type | protein-coding | GO ID | GO:0006412 | UniProtAcc | Q9Y399 |
Top |
Malignant transformation analysis |
| Identification of the aberrant gene expression in precancerous and cancerous lesions by comparing the gene expression of stem-like cells in diseased tissues with normal stem cells |
| Entrez ID | Symbol | Replicates | Species | Organ | Tissue | Adj P-value | Log2FC | Malignancy |
| 51116 | MRPS2 | HTA11_3410_2000001011 | Human | Colorectum | AD | 2.24e-02 | 9.32e-02 | 0.0155 |
| 51116 | MRPS2 | HTA11_2487_2000001011 | Human | Colorectum | SER | 4.42e-02 | 2.02e-01 | -0.1808 |
| 51116 | MRPS2 | HTA11_1938_2000001011 | Human | Colorectum | AD | 1.05e-03 | 2.13e-01 | -0.0811 |
| 51116 | MRPS2 | HTA11_347_2000001011 | Human | Colorectum | AD | 1.69e-06 | 1.75e-01 | -0.1954 |
| 51116 | MRPS2 | HTA11_3361_2000001011 | Human | Colorectum | AD | 3.63e-03 | 1.83e-01 | -0.1207 |
| 51116 | MRPS2 | HTA11_696_2000001011 | Human | Colorectum | AD | 1.39e-05 | 1.52e-01 | -0.1464 |
| 51116 | MRPS2 | HTA11_866_2000001011 | Human | Colorectum | AD | 1.87e-03 | 1.34e-01 | -0.1001 |
| 51116 | MRPS2 | HTA11_1391_2000001011 | Human | Colorectum | AD | 4.76e-11 | 4.33e-01 | -0.059 |
| 51116 | MRPS2 | HTA11_866_3004761011 | Human | Colorectum | AD | 3.67e-20 | 4.79e-01 | 0.096 |
| 51116 | MRPS2 | HTA11_4255_2000001011 | Human | Colorectum | SER | 9.56e-04 | 2.78e-01 | 0.0446 |
| 51116 | MRPS2 | HTA11_8622_2000001021 | Human | Colorectum | SER | 1.15e-07 | 3.16e-01 | 0.0528 |
| 51116 | MRPS2 | HTA11_7663_2000001011 | Human | Colorectum | SER | 2.27e-03 | 3.77e-01 | 0.0131 |
| 51116 | MRPS2 | HTA11_10623_2000001011 | Human | Colorectum | AD | 8.27e-03 | 2.70e-01 | -0.0177 |
| 51116 | MRPS2 | HTA11_6801_2000001011 | Human | Colorectum | SER | 4.24e-07 | 5.43e-01 | 0.0171 |
| 51116 | MRPS2 | HTA11_10711_2000001011 | Human | Colorectum | AD | 9.06e-09 | 2.98e-01 | 0.0338 |
| 51116 | MRPS2 | HTA11_7696_3000711011 | Human | Colorectum | AD | 2.62e-21 | 4.82e-01 | 0.0674 |
| 51116 | MRPS2 | HTA11_7469_2000001011 | Human | Colorectum | AD | 3.97e-04 | 4.25e-01 | -0.0124 |
| 51116 | MRPS2 | HTA11_6818_2000001021 | Human | Colorectum | AD | 7.83e-05 | 2.24e-01 | 0.0588 |
| 51116 | MRPS2 | HTA11_99999970781_79442 | Human | Colorectum | MSS | 2.69e-18 | 3.63e-01 | 0.294 |
| 51116 | MRPS2 | HTA11_99999965062_69753 | Human | Colorectum | MSI-H | 1.82e-02 | 6.02e-01 | 0.3487 |
| Page: 1 2 3 4 5 6 7 8 |
| Tissue | Expression Dynamics | Abbreviation |
| Colorectum (GSE201348) | 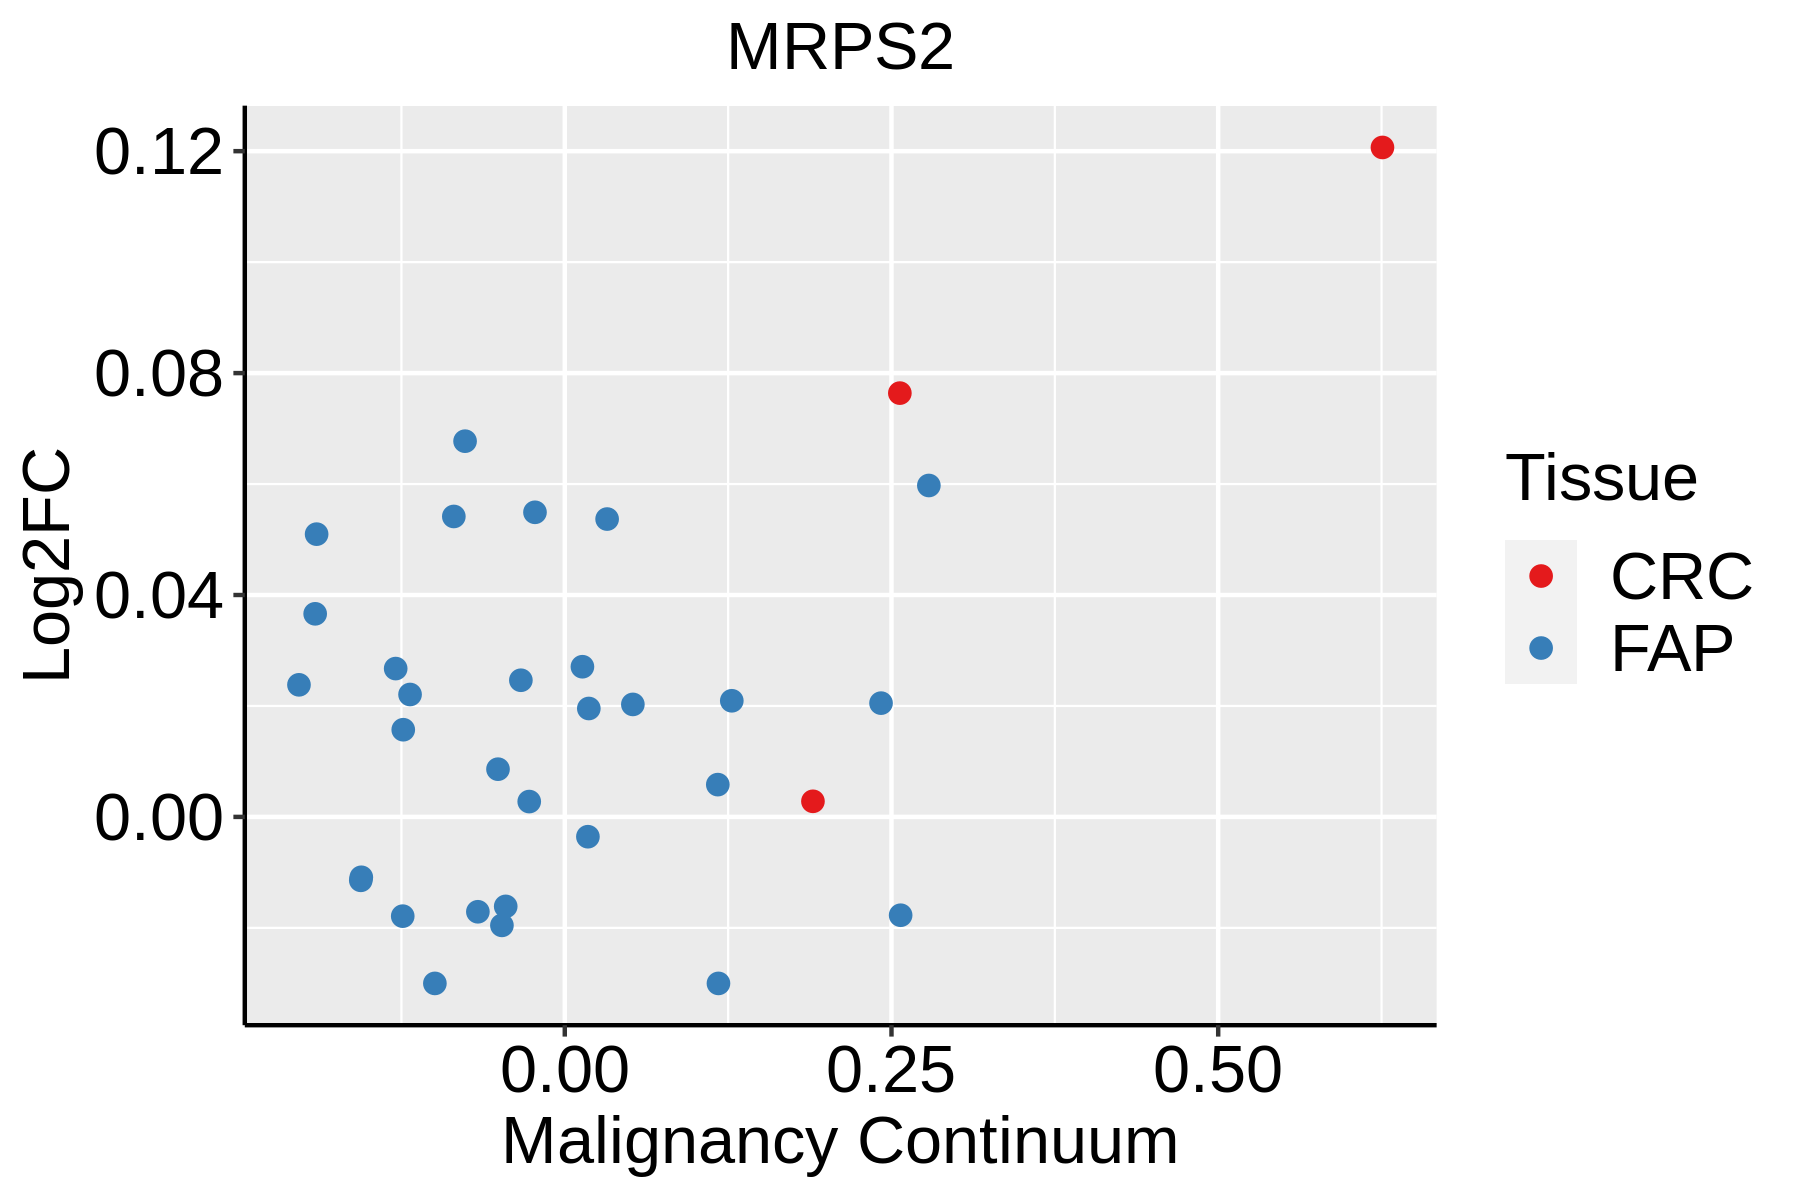 | FAP: Familial adenomatous polyposis |
| CRC: Colorectal cancer | ||
| Colorectum (HTA11) | 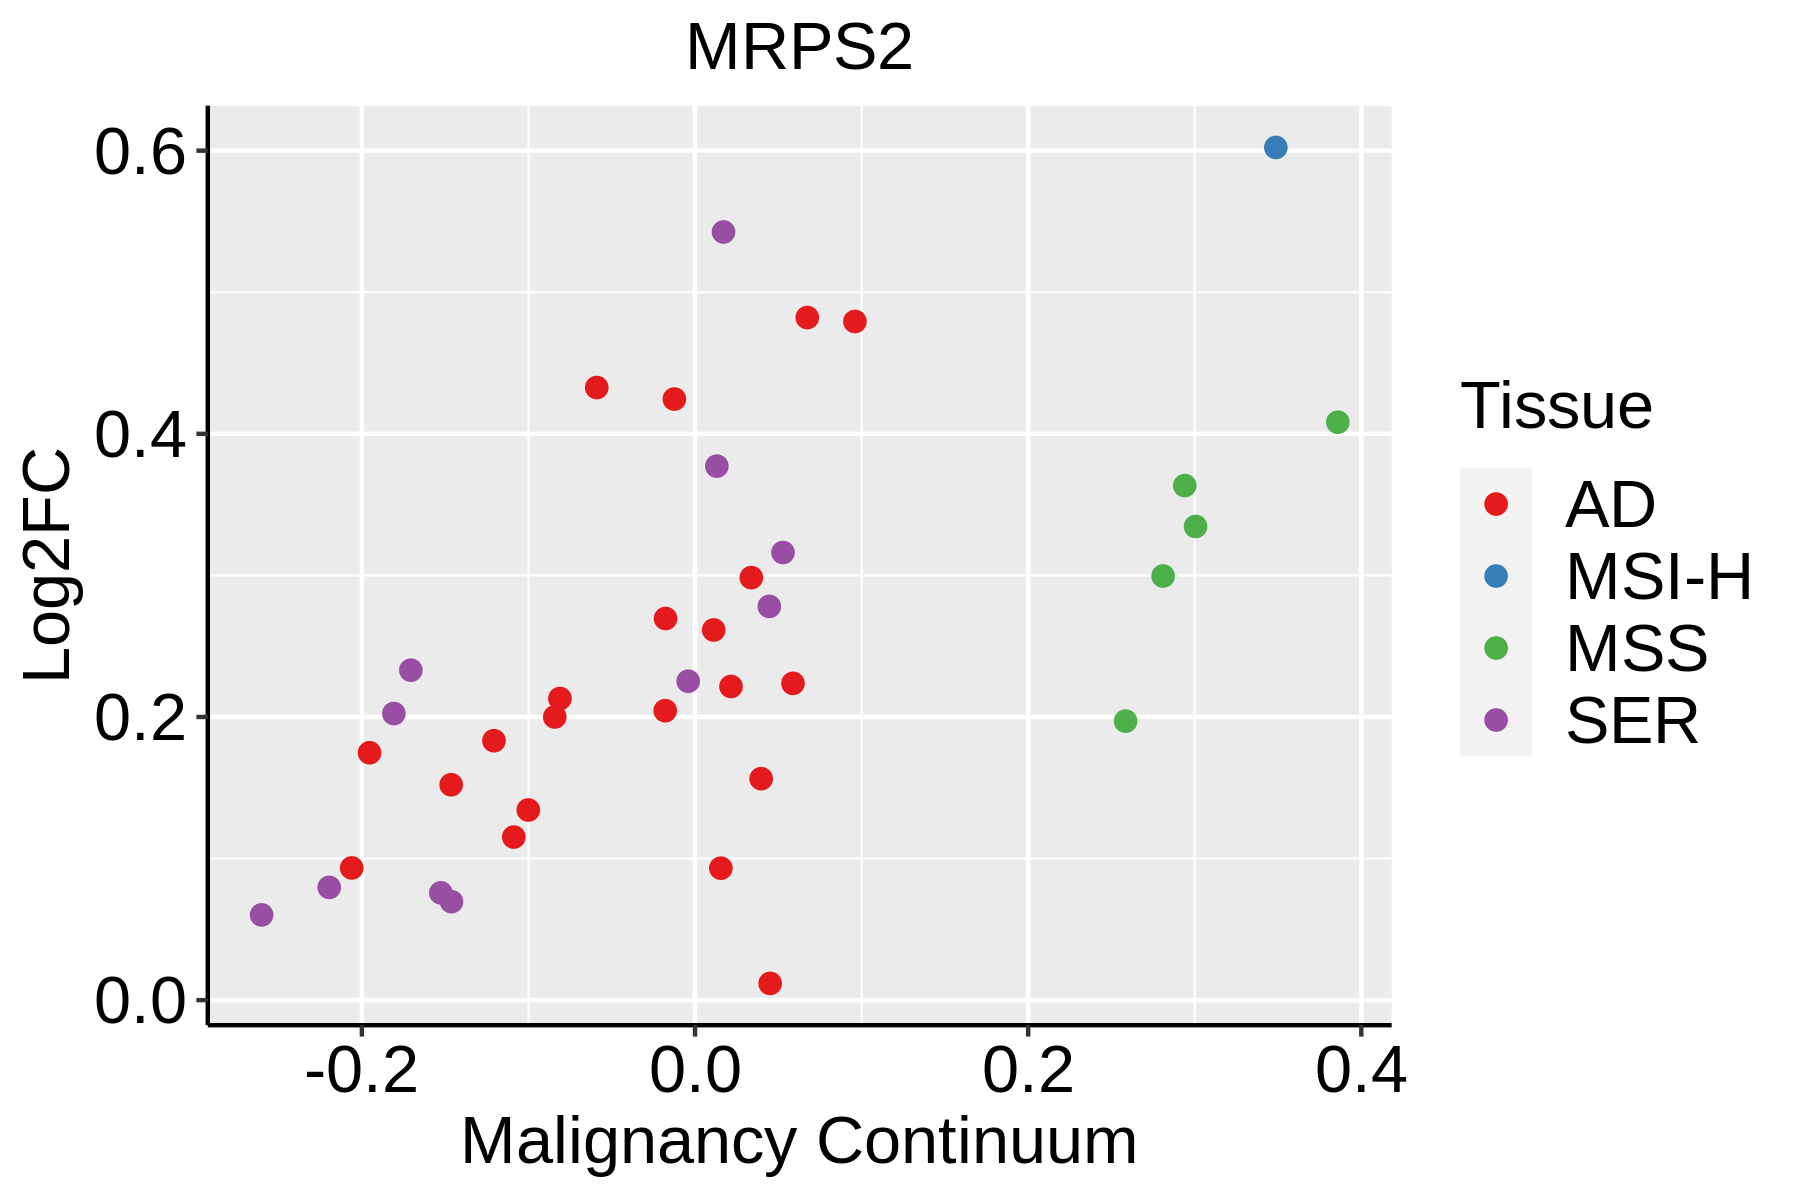 | AD: Adenomas |
| SER: Sessile serrated lesions | ||
| MSI-H: Microsatellite-high colorectal cancer | ||
| MSS: Microsatellite stable colorectal cancer | ||
| Esophagus | 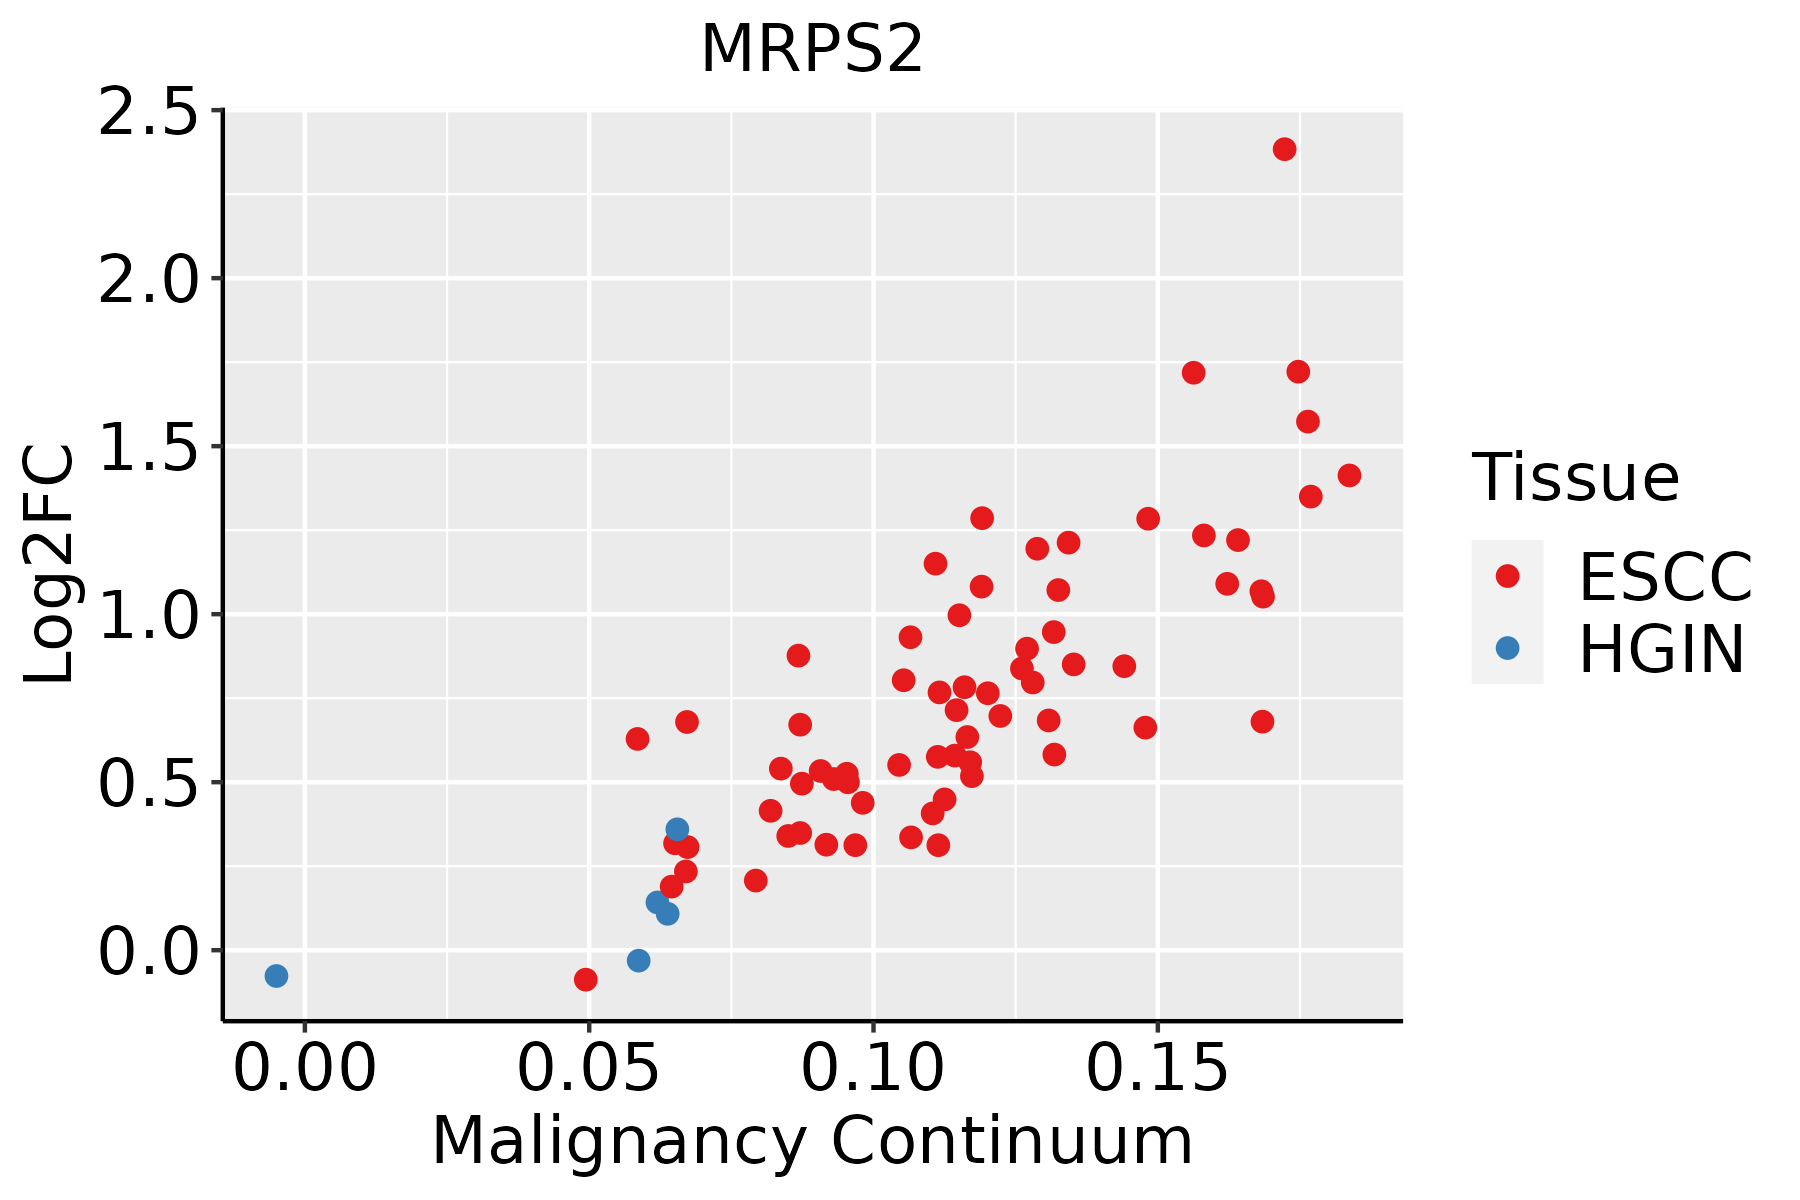 | ESCC: Esophageal squamous cell carcinoma |
| HGIN: High-grade intraepithelial neoplasias | ||
| LGIN: Low-grade intraepithelial neoplasias | ||
| Liver | 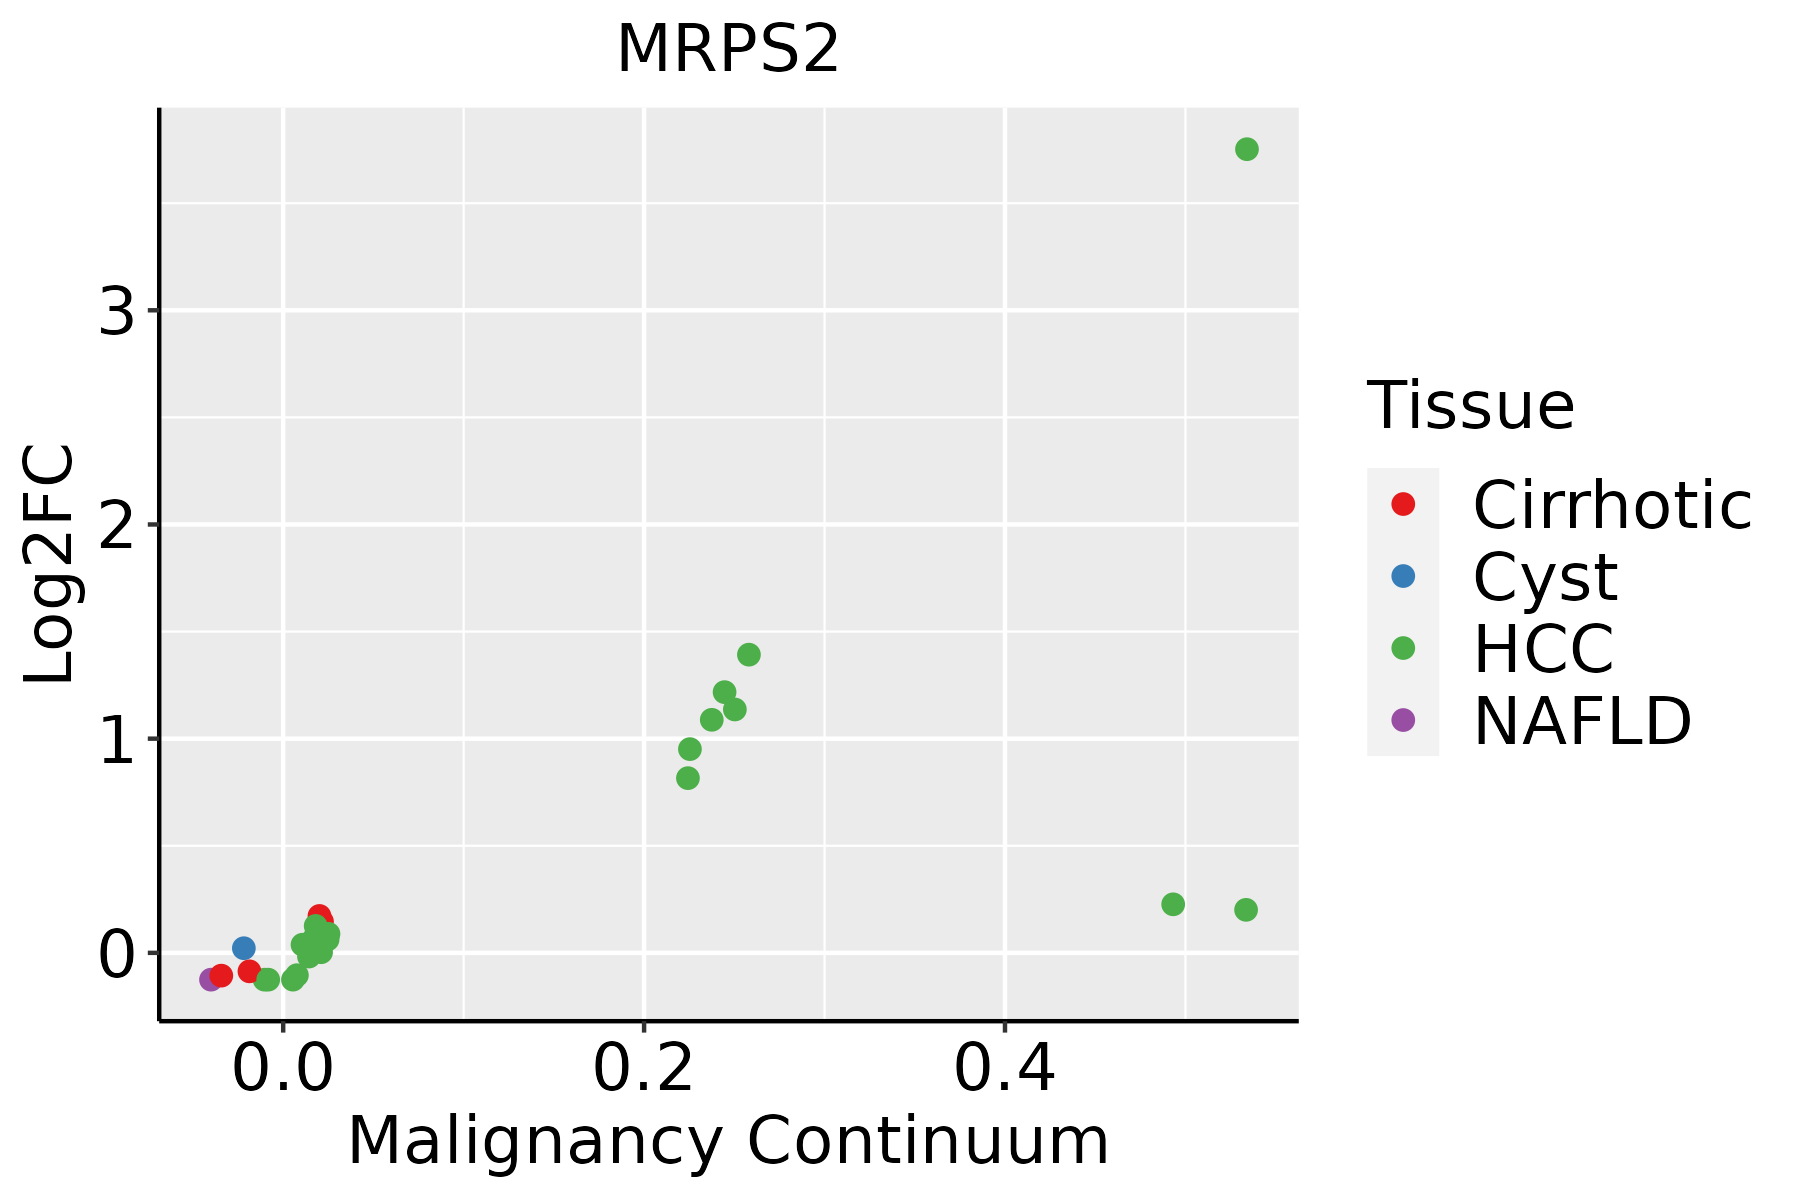 | HCC: Hepatocellular carcinoma |
| NAFLD: Non-alcoholic fatty liver disease | ||
| Oral Cavity |  | EOLP: Erosive Oral lichen planus |
| LP: leukoplakia | ||
| NEOLP: Non-erosive oral lichen planus | ||
| OSCC: Oral squamous cell carcinoma | ||
| Skin |  | AK: Actinic keratosis |
| cSCC: Cutaneous squamous cell carcinoma | ||
| SCCIS:squamous cell carcinoma in situ | ||
| Thyroid |  | ATC: Anaplastic thyroid cancer |
| HT: Hashimoto's thyroiditis | ||
| PTC: Papillary thyroid cancer |
| ∗log2FC in expression of this searched gene in stem-like cells from each diseased tissue sample relative to stem-like cells in normal samples in each tissue plotted against the malignancy continuum. Samples are colored based on if they are from different disease stage. |
Top |
Malignant transformation related pathway analysis |
| Find out the enriched GO biological processes and KEGG pathways involved in transition from healthy to precancer to cancer |
| Tissue | Disease Stage | Enriched GO biological Processes |
| Colorectum | AD |  |
| Colorectum | SER |  |
| Colorectum | MSS |  |
| Colorectum | MSI-H |  |
| Colorectum | FAP |  |
| ∗Top 15 enriched GO BP terms are showed in the bar plot of each disease state in each tissue. Each row represents a significant GO biological process which is colored according to the -log10(p.adjust). |
| Page: 1 2 3 4 5 6 7 8 9 |
| GO ID | Tissue | Disease Stage | Description | Gene Ratio | Bg Ratio | pvalue | p.adjust | Count |
| GO:00325432 | Breast | IDC | mitochondrial translation | 13/1434 | 76/18723 | 4.81e-03 | 3.67e-02 | 13 |
| GO:003254311 | Breast | DCIS | mitochondrial translation | 13/1390 | 76/18723 | 3.70e-03 | 2.99e-02 | 13 |
| GO:0022613 | Colorectum | AD | ribonucleoprotein complex biogenesis | 151/3918 | 463/18723 | 1.96e-09 | 1.39e-07 | 151 |
| GO:0042255 | Colorectum | AD | ribosome assembly | 28/3918 | 61/18723 | 1.08e-05 | 2.47e-04 | 28 |
| GO:0042769 | Colorectum | AD | DNA damage response, detection of DNA damage | 8/3918 | 13/18723 | 1.70e-03 | 1.41e-02 | 8 |
| GO:0042254 | Colorectum | AD | ribosome biogenesis | 84/3918 | 299/18723 | 1.82e-03 | 1.50e-02 | 84 |
| GO:00226131 | Colorectum | SER | ribonucleoprotein complex biogenesis | 112/2897 | 463/18723 | 5.01e-07 | 2.48e-05 | 112 |
| GO:00422551 | Colorectum | SER | ribosome assembly | 25/2897 | 61/18723 | 1.44e-06 | 6.55e-05 | 25 |
| GO:00422541 | Colorectum | SER | ribosome biogenesis | 66/2897 | 299/18723 | 1.48e-03 | 1.60e-02 | 66 |
| GO:00226132 | Colorectum | MSS | ribonucleoprotein complex biogenesis | 144/3467 | 463/18723 | 2.76e-11 | 3.67e-09 | 144 |
| GO:00422552 | Colorectum | MSS | ribosome assembly | 26/3467 | 61/18723 | 1.15e-05 | 2.71e-04 | 26 |
| GO:00422542 | Colorectum | MSS | ribosome biogenesis | 79/3467 | 299/18723 | 4.32e-04 | 5.23e-03 | 79 |
| GO:00427691 | Colorectum | MSS | DNA damage response, detection of DNA damage | 7/3467 | 13/18723 | 4.46e-03 | 3.15e-02 | 7 |
| GO:00226133 | Colorectum | MSI-H | ribonucleoprotein complex biogenesis | 95/1319 | 463/18723 | 1.04e-21 | 8.32e-19 | 95 |
| GO:00422553 | Colorectum | MSI-H | ribosome assembly | 22/1319 | 61/18723 | 5.84e-11 | 1.12e-08 | 22 |
| GO:00422543 | Colorectum | MSI-H | ribosome biogenesis | 54/1319 | 299/18723 | 1.27e-10 | 2.07e-08 | 54 |
| GO:00427692 | Colorectum | MSI-H | DNA damage response, detection of DNA damage | 6/1319 | 13/18723 | 1.35e-04 | 3.98e-03 | 6 |
| GO:00325435 | Esophagus | HGIN | mitochondrial translation | 23/2587 | 76/18723 | 1.61e-04 | 3.16e-03 | 23 |
| GO:01400534 | Esophagus | HGIN | mitochondrial gene expression | 27/2587 | 108/18723 | 1.34e-03 | 1.57e-02 | 27 |
| GO:0022613111 | Esophagus | ESCC | ribonucleoprotein complex biogenesis | 365/8552 | 463/18723 | 1.74e-49 | 1.11e-45 | 365 |
| Page: 1 2 3 4 5 |
| Pathway ID | Tissue | Disease Stage | Description | Gene Ratio | Bg Ratio | pvalue | p.adjust | qvalue | Count |
| hsa03010 | Colorectum | AD | Ribosome | 96/2092 | 167/8465 | 8.28e-20 | 5.54e-18 | 3.54e-18 | 96 |
| hsa030101 | Colorectum | AD | Ribosome | 96/2092 | 167/8465 | 8.28e-20 | 5.54e-18 | 3.54e-18 | 96 |
| hsa030102 | Colorectum | SER | Ribosome | 92/1580 | 167/8465 | 2.21e-26 | 3.66e-24 | 2.66e-24 | 92 |
| hsa030103 | Colorectum | SER | Ribosome | 92/1580 | 167/8465 | 2.21e-26 | 3.66e-24 | 2.66e-24 | 92 |
| hsa030104 | Colorectum | MSS | Ribosome | 96/1875 | 167/8465 | 1.82e-23 | 2.03e-21 | 1.24e-21 | 96 |
| hsa030105 | Colorectum | MSS | Ribosome | 96/1875 | 167/8465 | 1.82e-23 | 2.03e-21 | 1.24e-21 | 96 |
| hsa030106 | Colorectum | MSI-H | Ribosome | 87/797 | 167/8465 | 5.55e-46 | 1.80e-43 | 1.51e-43 | 87 |
| hsa030107 | Colorectum | MSI-H | Ribosome | 87/797 | 167/8465 | 5.55e-46 | 1.80e-43 | 1.51e-43 | 87 |
| hsa03010211 | Esophagus | ESCC | Ribosome | 129/4205 | 167/8465 | 1.43e-13 | 3.43e-12 | 1.75e-12 | 129 |
| hsa03010310 | Esophagus | ESCC | Ribosome | 129/4205 | 167/8465 | 1.43e-13 | 3.43e-12 | 1.75e-12 | 129 |
| hsa0301022 | Liver | Cirrhotic | Ribosome | 127/2530 | 167/8465 | 2.12e-35 | 7.06e-33 | 4.35e-33 | 127 |
| hsa0301032 | Liver | Cirrhotic | Ribosome | 127/2530 | 167/8465 | 2.12e-35 | 7.06e-33 | 4.35e-33 | 127 |
| hsa0301042 | Liver | HCC | Ribosome | 128/4020 | 167/8465 | 7.32e-15 | 2.23e-13 | 1.24e-13 | 128 |
| hsa0301052 | Liver | HCC | Ribosome | 128/4020 | 167/8465 | 7.32e-15 | 2.23e-13 | 1.24e-13 | 128 |
| hsa0301030 | Oral cavity | OSCC | Ribosome | 128/3704 | 167/8465 | 2.42e-18 | 1.62e-16 | 8.25e-17 | 128 |
| hsa03010114 | Oral cavity | OSCC | Ribosome | 128/3704 | 167/8465 | 2.42e-18 | 1.62e-16 | 8.25e-17 | 128 |
| Page: 1 |
Top |
Cell-cell communication analysis |
| Identification of potential cell-cell interactions between two cell types and their ligand-receptor pairs for different disease states |
| Ligand | Receptor | LRpair | Pathway | Tissue | Disease Stage |
| Page: 1 |
Top |
Single-cell gene regulatory network inference analysis |
| Find out the significant the regulons (TFs) and the target genes of each regulon across cell types for different disease states |
| TF | Cell Type | Tissue | Disease Stage | Target Gene | RSS | Regulon Activity |
| ∗The dot plots of a searched regulon are shown for all cell subpopulations in each disease state of each tissue based on the regulon specific score inferred using pySCENIC and by calculating the average expression. |
| Page: 1 |
Top |
Somatic mutation of malignant transformation related genes |
| Annotation of somatic variants for genes involved in malignant transformation |
| Hugo Symbol | Variant Class | Variant Classification | dbSNP RS | HGVSc | HGVSp | HGVSp Short | SWISSPROT | BIOTYPE | SIFT | PolyPhen | Tumor Sample Barcode | Tissue | Histology | Sex | Age | Stage | Therapy Types | Drugs | Outcome |
| MRPS2 | SNV | Missense_Mutation | rs760405762 | c.535G>A | p.Ala179Thr | p.A179T | Q9Y399 | protein_coding | tolerated(0.1) | possibly_damaging(0.84) | TCGA-A7-A4SD-01 | Breast | breast invasive carcinoma | Female | <65 | I/II | Chemotherapy | taxotere | CR |
| MRPS2 | SNV | Missense_Mutation | rs767971399 | c.329N>A | p.Arg110His | p.R110H | Q9Y399 | protein_coding | deleterious(0) | probably_damaging(1) | TCGA-BH-A18G-01 | Breast | breast invasive carcinoma | Female | >=65 | I/II | Unknown | Unknown | SD |
| MRPS2 | SNV | Missense_Mutation | novel | c.554N>T | p.Pro185Leu | p.P185L | Q9Y399 | protein_coding | deleterious(0.03) | possibly_damaging(0.515) | TCGA-2W-A8YY-01 | Cervix | cervical & endocervical cancer | Female | <65 | I/II | Chemotherapy | cisplatin | CR |
| MRPS2 | SNV | Missense_Mutation | rs201117985 | c.838N>A | p.Gly280Arg | p.G280R | Q9Y399 | protein_coding | tolerated(0.41) | benign(0.001) | TCGA-2W-A8YY-01 | Cervix | cervical & endocervical cancer | Female | <65 | I/II | Chemotherapy | cisplatin | CR |
| MRPS2 | SNV | Missense_Mutation | rs753018156 | c.412N>T | p.Arg138Cys | p.R138C | Q9Y399 | protein_coding | deleterious(0) | probably_damaging(1) | TCGA-5M-AAT6-01 | Colorectum | colon adenocarcinoma | Female | <65 | III/IV | Unknown | Unknown | PD |
| MRPS2 | SNV | Missense_Mutation | rs753767783 | c.539N>A | p.Arg180His | p.R180H | Q9Y399 | protein_coding | tolerated(0.37) | benign(0) | TCGA-A6-4105-01 | Colorectum | colon adenocarcinoma | Male | >=65 | I/II | Unknown | Unknown | PD |
| MRPS2 | SNV | Missense_Mutation | rs760188552 | c.506N>A | p.Arg169His | p.R169H | Q9Y399 | protein_coding | deleterious(0) | probably_damaging(1) | TCGA-AA-3715-01 | Colorectum | colon adenocarcinoma | Male | >=65 | I/II | Unknown | Unknown | PD |
| MRPS2 | SNV | Missense_Mutation | rs746234639 | c.293N>A | p.Arg98Gln | p.R98Q | Q9Y399 | protein_coding | deleterious(0.03) | probably_damaging(0.971) | TCGA-AZ-4615-01 | Colorectum | colon adenocarcinoma | Male | >=65 | III/IV | Chemotherapy | xeloda | PD |
| MRPS2 | SNV | Missense_Mutation | c.529A>T | p.Thr177Ser | p.T177S | Q9Y399 | protein_coding | deleterious(0.04) | probably_damaging(0.999) | TCGA-AZ-6598-01 | Colorectum | colon adenocarcinoma | Female | >=65 | I/II | Unknown | Unknown | SD | |
| MRPS2 | SNV | Missense_Mutation | rs762097553 | c.712N>A | p.Gly238Ser | p.G238S | Q9Y399 | protein_coding | deleterious(0.03) | probably_damaging(1) | TCGA-CK-5916-01 | Colorectum | colon adenocarcinoma | Female | >=65 | I/II | Unknown | Unknown | PD |
| Page: 1 2 3 4 |
Top |
Related drugs of malignant transformation related genes |
| Identification of chemicals and drugs interact with genes involved in malignant transfromation |
| (DGIdb 4.0) |
| Entrez ID | Symbol | Category | Interaction Types | Drug Claim Name | Drug Name | PMIDs |
| Page: 1 |

Copyright 2023-Present -The University of Texas Health Science Center at Houston |