
|
|||||
|
 | |
| |
| |
| |
| |
| |
|
Gene: MRPS18C |
Gene summary for MRPS18C |
| Gene information | Species | Human | Gene symbol | MRPS18C | Gene ID | 51023 |
| Gene name | mitochondrial ribosomal protein S18C | |
| Gene Alias | CGI-134 | |
| Cytomap | 4q21.23 | |
| Gene Type | protein-coding | GO ID | GO:0006412 | UniProtAcc | D6RCM2 |
Top |
Malignant transformation analysis |
| Identification of the aberrant gene expression in precancerous and cancerous lesions by comparing the gene expression of stem-like cells in diseased tissues with normal stem cells |
| Entrez ID | Symbol | Replicates | Species | Organ | Tissue | Adj P-value | Log2FC | Malignancy |
| 51023 | MRPS18C | LZE2T | Human | Esophagus | ESCC | 2.72e-02 | 3.05e-01 | 0.082 |
| 51023 | MRPS18C | LZE4T | Human | Esophagus | ESCC | 1.76e-16 | 3.76e-01 | 0.0811 |
| 51023 | MRPS18C | LZE5T | Human | Esophagus | ESCC | 1.40e-07 | 4.21e-01 | 0.0514 |
| 51023 | MRPS18C | LZE7T | Human | Esophagus | ESCC | 4.46e-10 | 8.62e-01 | 0.0667 |
| 51023 | MRPS18C | LZE8T | Human | Esophagus | ESCC | 3.52e-05 | 2.71e-01 | 0.067 |
| 51023 | MRPS18C | LZE20T | Human | Esophagus | ESCC | 1.21e-06 | 1.23e-01 | 0.0662 |
| 51023 | MRPS18C | LZE22D1 | Human | Esophagus | HGIN | 4.61e-07 | 1.34e-01 | 0.0595 |
| 51023 | MRPS18C | LZE22T | Human | Esophagus | ESCC | 1.16e-04 | 4.86e-01 | 0.068 |
| 51023 | MRPS18C | LZE24T | Human | Esophagus | ESCC | 1.16e-23 | 7.39e-01 | 0.0596 |
| 51023 | MRPS18C | LZE22D3 | Human | Esophagus | HGIN | 1.46e-02 | 2.31e-01 | 0.0653 |
| 51023 | MRPS18C | LZE21T | Human | Esophagus | ESCC | 2.10e-04 | 5.66e-01 | 0.0655 |
| 51023 | MRPS18C | LZE6T | Human | Esophagus | ESCC | 5.40e-04 | 5.42e-01 | 0.0845 |
| 51023 | MRPS18C | P1T-E | Human | Esophagus | ESCC | 2.38e-10 | 5.92e-01 | 0.0875 |
| 51023 | MRPS18C | P2T-E | Human | Esophagus | ESCC | 8.86e-41 | 7.11e-01 | 0.1177 |
| 51023 | MRPS18C | P4T-E | Human | Esophagus | ESCC | 5.00e-47 | 1.20e+00 | 0.1323 |
| 51023 | MRPS18C | P5T-E | Human | Esophagus | ESCC | 2.66e-27 | 5.50e-01 | 0.1327 |
| 51023 | MRPS18C | P8T-E | Human | Esophagus | ESCC | 3.36e-30 | 5.36e-01 | 0.0889 |
| 51023 | MRPS18C | P9T-E | Human | Esophagus | ESCC | 2.59e-28 | 7.38e-01 | 0.1131 |
| 51023 | MRPS18C | P10T-E | Human | Esophagus | ESCC | 4.13e-41 | 6.77e-01 | 0.116 |
| 51023 | MRPS18C | P11T-E | Human | Esophagus | ESCC | 1.65e-21 | 9.61e-01 | 0.1426 |
| Page: 1 2 3 4 5 6 7 8 |
| Tissue | Expression Dynamics | Abbreviation |
| Esophagus | 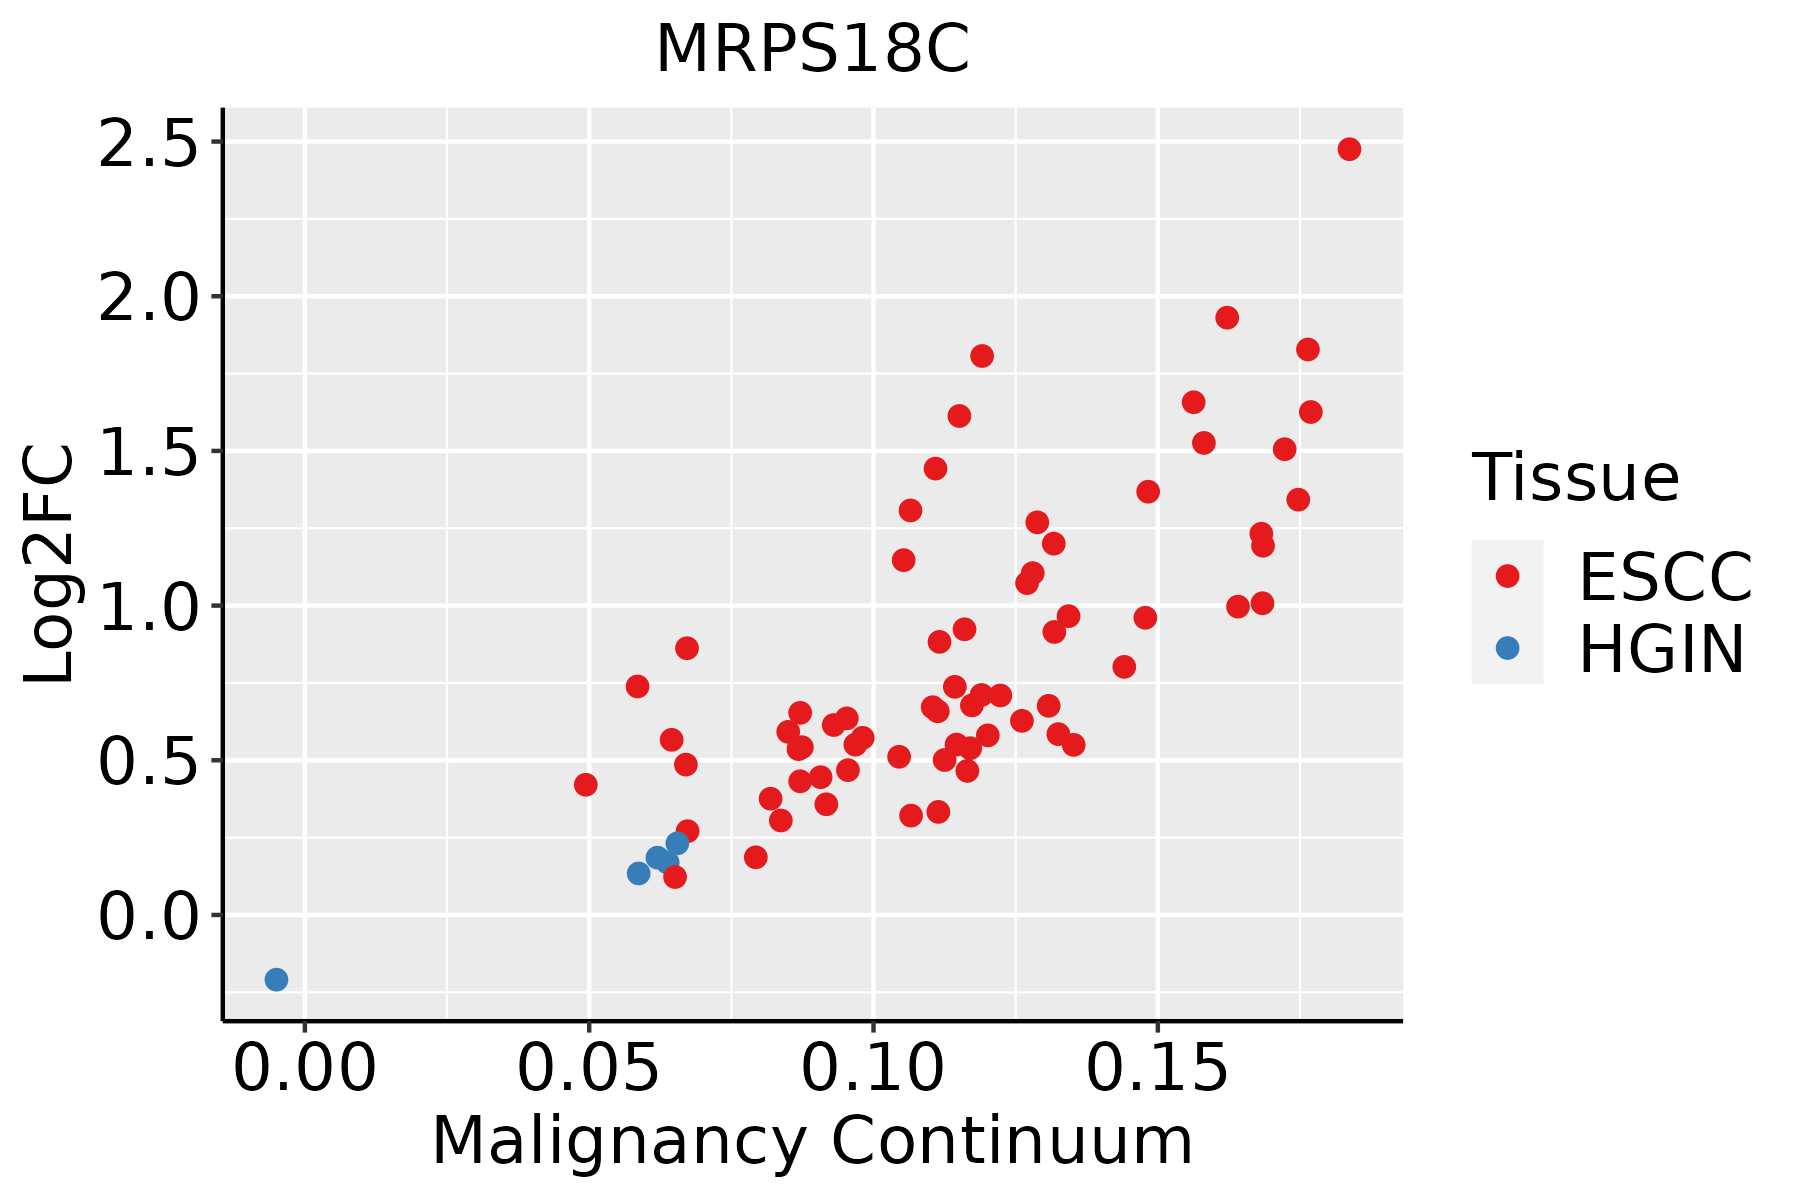 | ESCC: Esophageal squamous cell carcinoma |
| HGIN: High-grade intraepithelial neoplasias | ||
| LGIN: Low-grade intraepithelial neoplasias | ||
| Liver | 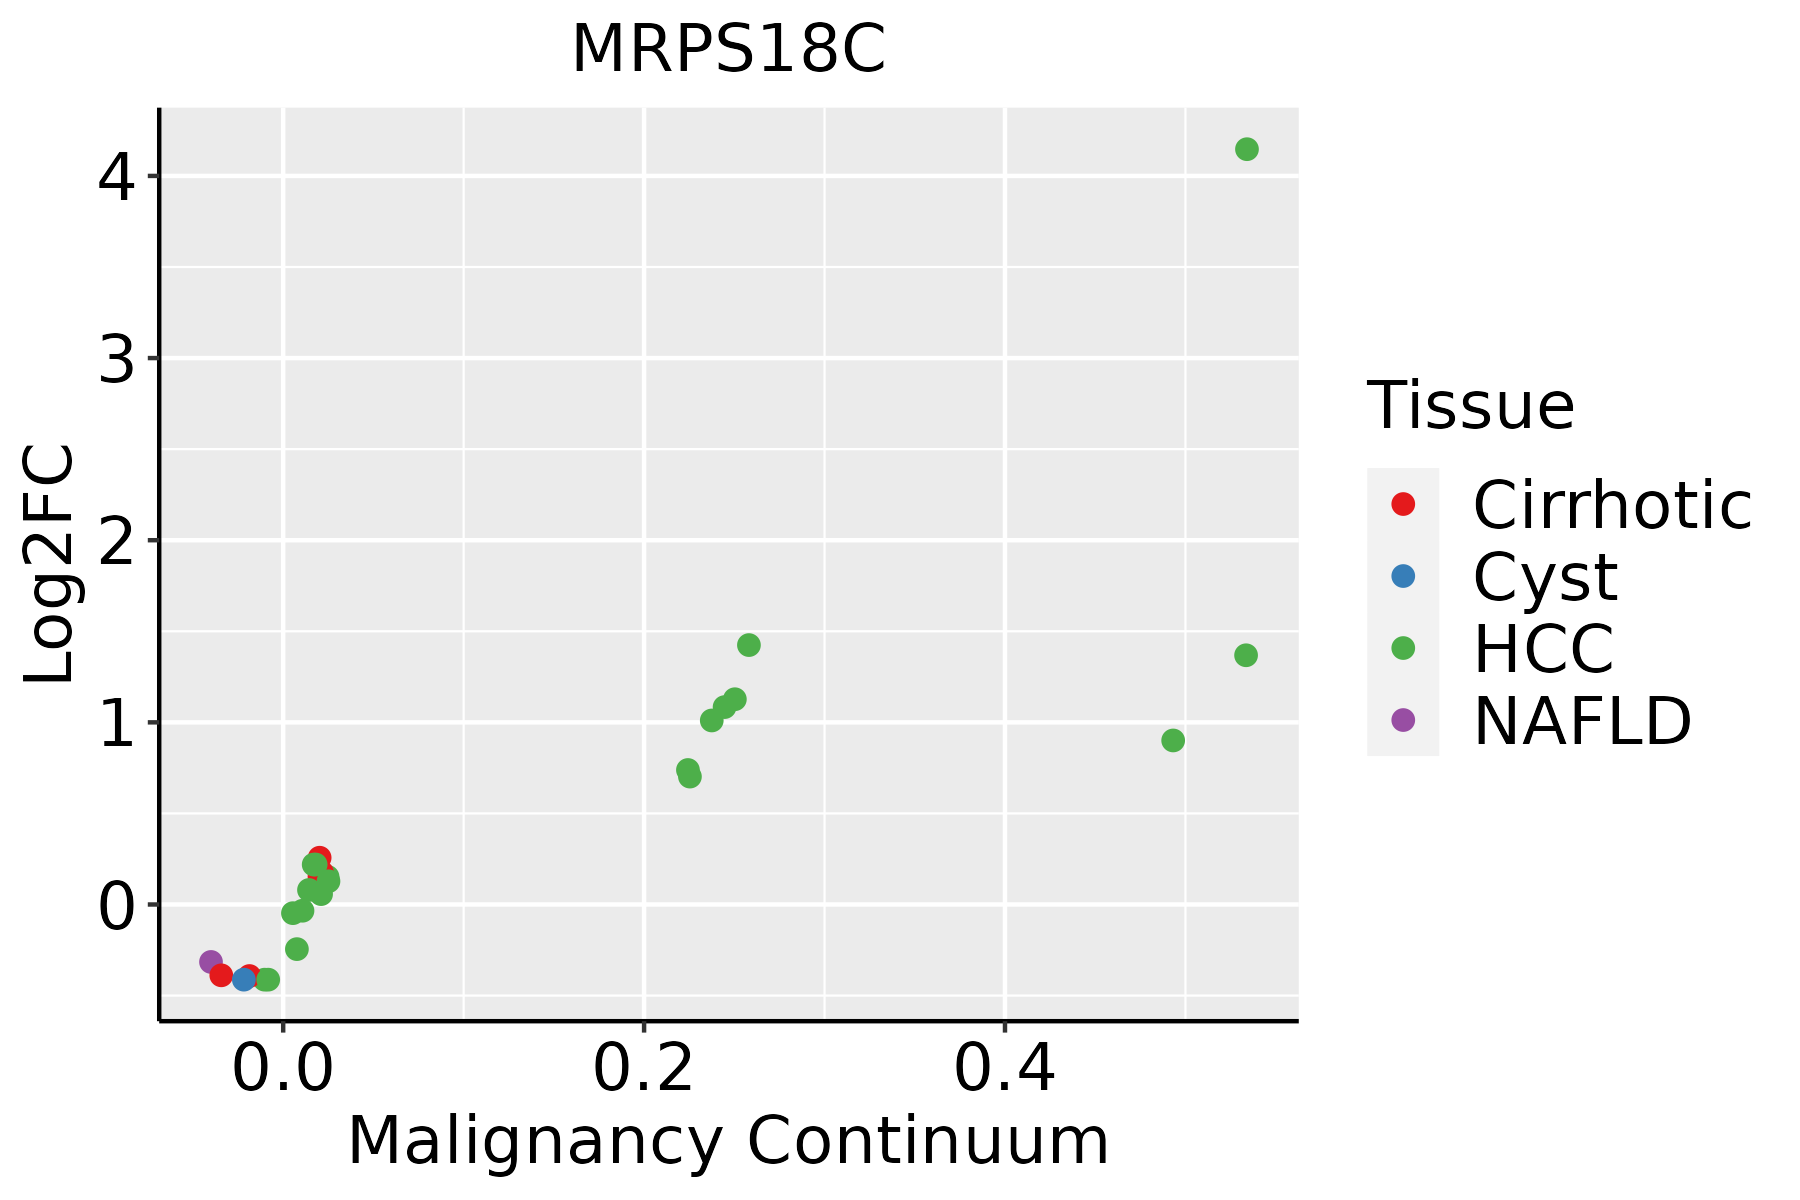 | HCC: Hepatocellular carcinoma |
| NAFLD: Non-alcoholic fatty liver disease | ||
| Oral Cavity |  | EOLP: Erosive Oral lichen planus |
| LP: leukoplakia | ||
| NEOLP: Non-erosive oral lichen planus | ||
| OSCC: Oral squamous cell carcinoma | ||
| Skin |  | AK: Actinic keratosis |
| cSCC: Cutaneous squamous cell carcinoma | ||
| SCCIS:squamous cell carcinoma in situ | ||
| Thyroid | 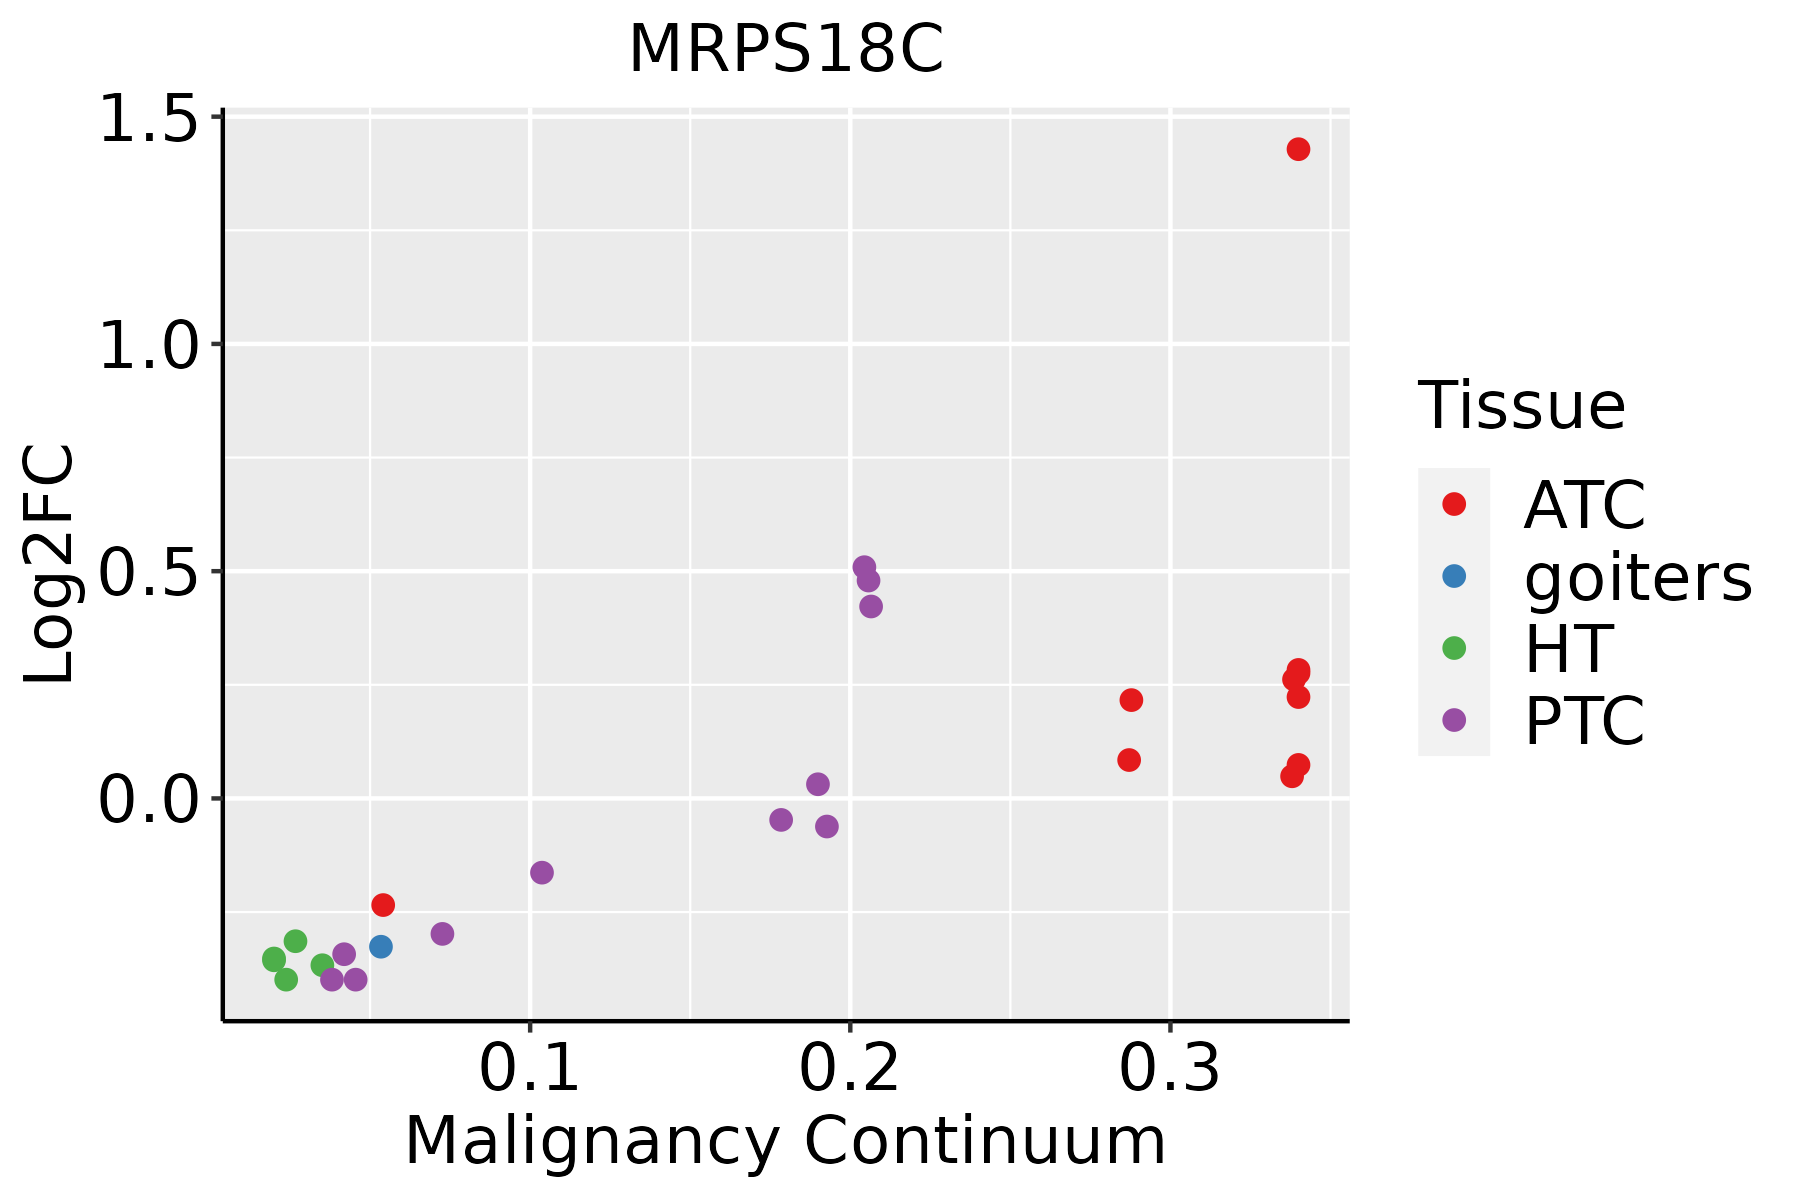 | ATC: Anaplastic thyroid cancer |
| HT: Hashimoto's thyroiditis | ||
| PTC: Papillary thyroid cancer |
| ∗log2FC in expression of this searched gene in stem-like cells from each diseased tissue sample relative to stem-like cells in normal samples in each tissue plotted against the malignancy continuum. Samples are colored based on if they are from different disease stage. |
Top |
Malignant transformation related pathway analysis |
| Find out the enriched GO biological processes and KEGG pathways involved in transition from healthy to precancer to cancer |
| Tissue | Disease Stage | Enriched GO biological Processes |
| Colorectum | AD |  |
| Colorectum | SER |  |
| Colorectum | MSS |  |
| Colorectum | MSI-H |  |
| Colorectum | FAP |  |
| ∗Top 15 enriched GO BP terms are showed in the bar plot of each disease state in each tissue. Each row represents a significant GO biological process which is colored according to the -log10(p.adjust). |
| Page: 1 2 3 4 5 6 7 8 9 |
| GO ID | Tissue | Disease Stage | Description | Gene Ratio | Bg Ratio | pvalue | p.adjust | Count |
| Page: 1 |
| Pathway ID | Tissue | Disease Stage | Description | Gene Ratio | Bg Ratio | pvalue | p.adjust | qvalue | Count |
| hsa0301039 | Esophagus | HGIN | Ribosome | 108/1383 | 167/8465 | 1.44e-45 | 4.71e-43 | 3.74e-43 | 108 |
| hsa03010115 | Esophagus | HGIN | Ribosome | 108/1383 | 167/8465 | 1.44e-45 | 4.71e-43 | 3.74e-43 | 108 |
| hsa03010211 | Esophagus | ESCC | Ribosome | 129/4205 | 167/8465 | 1.43e-13 | 3.43e-12 | 1.75e-12 | 129 |
| hsa03010310 | Esophagus | ESCC | Ribosome | 129/4205 | 167/8465 | 1.43e-13 | 3.43e-12 | 1.75e-12 | 129 |
| hsa0301022 | Liver | Cirrhotic | Ribosome | 127/2530 | 167/8465 | 2.12e-35 | 7.06e-33 | 4.35e-33 | 127 |
| hsa0301032 | Liver | Cirrhotic | Ribosome | 127/2530 | 167/8465 | 2.12e-35 | 7.06e-33 | 4.35e-33 | 127 |
| hsa0301042 | Liver | HCC | Ribosome | 128/4020 | 167/8465 | 7.32e-15 | 2.23e-13 | 1.24e-13 | 128 |
| hsa0301052 | Liver | HCC | Ribosome | 128/4020 | 167/8465 | 7.32e-15 | 2.23e-13 | 1.24e-13 | 128 |
| hsa0301030 | Oral cavity | OSCC | Ribosome | 128/3704 | 167/8465 | 2.42e-18 | 1.62e-16 | 8.25e-17 | 128 |
| hsa03010114 | Oral cavity | OSCC | Ribosome | 128/3704 | 167/8465 | 2.42e-18 | 1.62e-16 | 8.25e-17 | 128 |
| hsa03010210 | Oral cavity | LP | Ribosome | 127/2418 | 167/8465 | 1.22e-37 | 4.05e-35 | 2.61e-35 | 127 |
| hsa0301038 | Oral cavity | LP | Ribosome | 127/2418 | 167/8465 | 1.22e-37 | 4.05e-35 | 2.61e-35 | 127 |
| Page: 1 |
Top |
Cell-cell communication analysis |
| Identification of potential cell-cell interactions between two cell types and their ligand-receptor pairs for different disease states |
| Ligand | Receptor | LRpair | Pathway | Tissue | Disease Stage |
| Page: 1 |
Top |
Single-cell gene regulatory network inference analysis |
| Find out the significant the regulons (TFs) and the target genes of each regulon across cell types for different disease states |
| TF | Cell Type | Tissue | Disease Stage | Target Gene | RSS | Regulon Activity |
| ∗The dot plots of a searched regulon are shown for all cell subpopulations in each disease state of each tissue based on the regulon specific score inferred using pySCENIC and by calculating the average expression. |
| Page: 1 |
Top |
Somatic mutation of malignant transformation related genes |
| Annotation of somatic variants for genes involved in malignant transformation |
| Hugo Symbol | Variant Class | Variant Classification | dbSNP RS | HGVSc | HGVSp | HGVSp Short | SWISSPROT | BIOTYPE | SIFT | PolyPhen | Tumor Sample Barcode | Tissue | Histology | Sex | Age | Stage | Therapy Types | Drugs | Outcome |
| MRPS18C | SNV | Missense_Mutation | c.340G>A | p.Ala114Thr | p.A114T | Q9Y3D5 | protein_coding | deleterious(0.01) | benign(0.248) | TCGA-A8-A09Z-01 | Breast | breast invasive carcinoma | Female | >=65 | I/II | Unknown | Unknown | SD | |
| MRPS18C | SNV | Missense_Mutation | c.254N>G | p.Ser85Cys | p.S85C | Q9Y3D5 | protein_coding | deleterious(0.01) | probably_damaging(0.983) | TCGA-EK-A3GK-01 | Cervix | cervical & endocervical cancer | Female | <65 | I/II | Unknown | Unknown | SD | |
| MRPS18C | SNV | Missense_Mutation | c.355N>G | p.Phe119Val | p.F119V | Q9Y3D5 | protein_coding | deleterious(0) | possibly_damaging(0.57) | TCGA-AA-3715-01 | Colorectum | colon adenocarcinoma | Male | >=65 | I/II | Unknown | Unknown | PD | |
| MRPS18C | SNV | Missense_Mutation | novel | c.182N>A | p.Pro61His | p.P61H | Q9Y3D5 | protein_coding | deleterious(0) | possibly_damaging(0.498) | TCGA-A5-A1OF-01 | Endometrium | uterine corpus endometrioid carcinoma | Female | <65 | I/II | Unknown | Unknown | SD |
| MRPS18C | SNV | Missense_Mutation | novel | c.318N>C | p.Glu106Asp | p.E106D | Q9Y3D5 | protein_coding | tolerated(0.08) | probably_damaging(0.953) | TCGA-AJ-A3EL-01 | Endometrium | uterine corpus endometrioid carcinoma | Female | <65 | I/II | Unknown | Unknown | SD |
| MRPS18C | SNV | Missense_Mutation | rs375755956 | c.422N>A | p.Arg141Gln | p.R141Q | Q9Y3D5 | protein_coding | tolerated_low_confidence(0.32) | benign(0) | TCGA-D1-A17B-01 | Endometrium | uterine corpus endometrioid carcinoma | Female | >=65 | I/II | Unknown | Unknown | SD |
| MRPS18C | SNV | Missense_Mutation | rs753785951 | c.400A>G | p.Lys134Glu | p.K134E | Q9Y3D5 | protein_coding | deleterious(0) | benign(0.197) | TCGA-DD-AAD8-01 | Liver | liver hepatocellular carcinoma | Female | >=65 | I/II | Unknown | Unknown | SD |
| MRPS18C | SNV | Missense_Mutation | novel | c.64N>A | p.Ala22Thr | p.A22T | Q9Y3D5 | protein_coding | tolerated(0.15) | benign(0.142) | TCGA-55-7815-01 | Lung | lung adenocarcinoma | Male | >=65 | I/II | Chemotherapy | chemo | PD |
| MRPS18C | insertion | Nonsense_Mutation | novel | c.94_95insTCGCTTTATAGGGGAGAGAGCAAAAGGGAG | p.His32delinsLeuAlaLeuTerGlyArgGluGlnLysGlyAsp | p.H32delinsLAL*GREQKGD | Q9Y3D5 | protein_coding | TCGA-CN-4723-01 | Oral cavity | head & neck squamous cell carcinoma | Male | >=65 | I/II | Unknown | Unknown | SD | ||
| MRPS18C | SNV | Missense_Mutation | rs773020951 | c.193T>C | p.Cys65Arg | p.C65R | Q9Y3D5 | protein_coding | deleterious(0) | possibly_damaging(0.83) | TCGA-BR-6452-01 | Stomach | stomach adenocarcinoma | Female | >=65 | I/II | Unknown | Unknown | SD |
| Page: 1 |
Top |
Related drugs of malignant transformation related genes |
| Identification of chemicals and drugs interact with genes involved in malignant transfromation |
| (DGIdb 4.0) |
| Entrez ID | Symbol | Category | Interaction Types | Drug Claim Name | Drug Name | PMIDs |
| Page: 1 |

Copyright 2023-Present -The University of Texas Health Science Center at Houston |