
|
|||||
|
 | |
| |
| |
| |
| |
| |
|
Gene: MRPS18A |
Gene summary for MRPS18A |
| Gene information | Species | Human | Gene symbol | MRPS18A | Gene ID | 55168 |
| Gene name | mitochondrial ribosomal protein S18A | |
| Gene Alias | HumanS18b | |
| Cytomap | 6p21.1 | |
| Gene Type | protein-coding | GO ID | GO:0006412 | UniProtAcc | Q9NVS2 |
Top |
Malignant transformation analysis |
| Identification of the aberrant gene expression in precancerous and cancerous lesions by comparing the gene expression of stem-like cells in diseased tissues with normal stem cells |
| Entrez ID | Symbol | Replicates | Species | Organ | Tissue | Adj P-value | Log2FC | Malignancy |
| 55168 | MRPS18A | LZE2T | Human | Esophagus | ESCC | 1.84e-09 | 1.76e+00 | 0.082 |
| 55168 | MRPS18A | LZE4T | Human | Esophagus | ESCC | 8.87e-10 | 4.75e-01 | 0.0811 |
| 55168 | MRPS18A | LZE5T | Human | Esophagus | ESCC | 3.34e-05 | 3.71e-01 | 0.0514 |
| 55168 | MRPS18A | LZE7T | Human | Esophagus | ESCC | 5.07e-10 | 5.25e-01 | 0.0667 |
| 55168 | MRPS18A | LZE8T | Human | Esophagus | ESCC | 9.29e-12 | 4.65e-01 | 0.067 |
| 55168 | MRPS18A | LZE20T | Human | Esophagus | ESCC | 1.68e-11 | 4.23e-01 | 0.0662 |
| 55168 | MRPS18A | LZE22D1 | Human | Esophagus | HGIN | 1.02e-02 | 2.49e-01 | 0.0595 |
| 55168 | MRPS18A | LZE22T | Human | Esophagus | ESCC | 1.06e-03 | 6.01e-01 | 0.068 |
| 55168 | MRPS18A | LZE24T | Human | Esophagus | ESCC | 1.81e-21 | 8.94e-01 | 0.0596 |
| 55168 | MRPS18A | LZE21T | Human | Esophagus | ESCC | 1.78e-03 | 6.48e-01 | 0.0655 |
| 55168 | MRPS18A | LZE6T | Human | Esophagus | ESCC | 2.07e-09 | 6.02e-01 | 0.0845 |
| 55168 | MRPS18A | P1T-E | Human | Esophagus | ESCC | 1.29e-08 | 8.61e-01 | 0.0875 |
| 55168 | MRPS18A | P2T-E | Human | Esophagus | ESCC | 2.85e-31 | 6.53e-01 | 0.1177 |
| 55168 | MRPS18A | P4T-E | Human | Esophagus | ESCC | 6.48e-39 | 1.06e+00 | 0.1323 |
| 55168 | MRPS18A | P5T-E | Human | Esophagus | ESCC | 1.08e-33 | 6.86e-01 | 0.1327 |
| 55168 | MRPS18A | P8T-E | Human | Esophagus | ESCC | 3.10e-27 | 5.84e-01 | 0.0889 |
| 55168 | MRPS18A | P9T-E | Human | Esophagus | ESCC | 1.22e-22 | 6.53e-01 | 0.1131 |
| 55168 | MRPS18A | P10T-E | Human | Esophagus | ESCC | 4.59e-25 | 4.57e-01 | 0.116 |
| 55168 | MRPS18A | P11T-E | Human | Esophagus | ESCC | 1.97e-18 | 8.44e-01 | 0.1426 |
| 55168 | MRPS18A | P12T-E | Human | Esophagus | ESCC | 9.60e-41 | 7.01e-01 | 0.1122 |
| Page: 1 2 3 4 5 6 7 |
| Tissue | Expression Dynamics | Abbreviation |
| Esophagus |  | ESCC: Esophageal squamous cell carcinoma |
| HGIN: High-grade intraepithelial neoplasias | ||
| LGIN: Low-grade intraepithelial neoplasias | ||
| Liver | 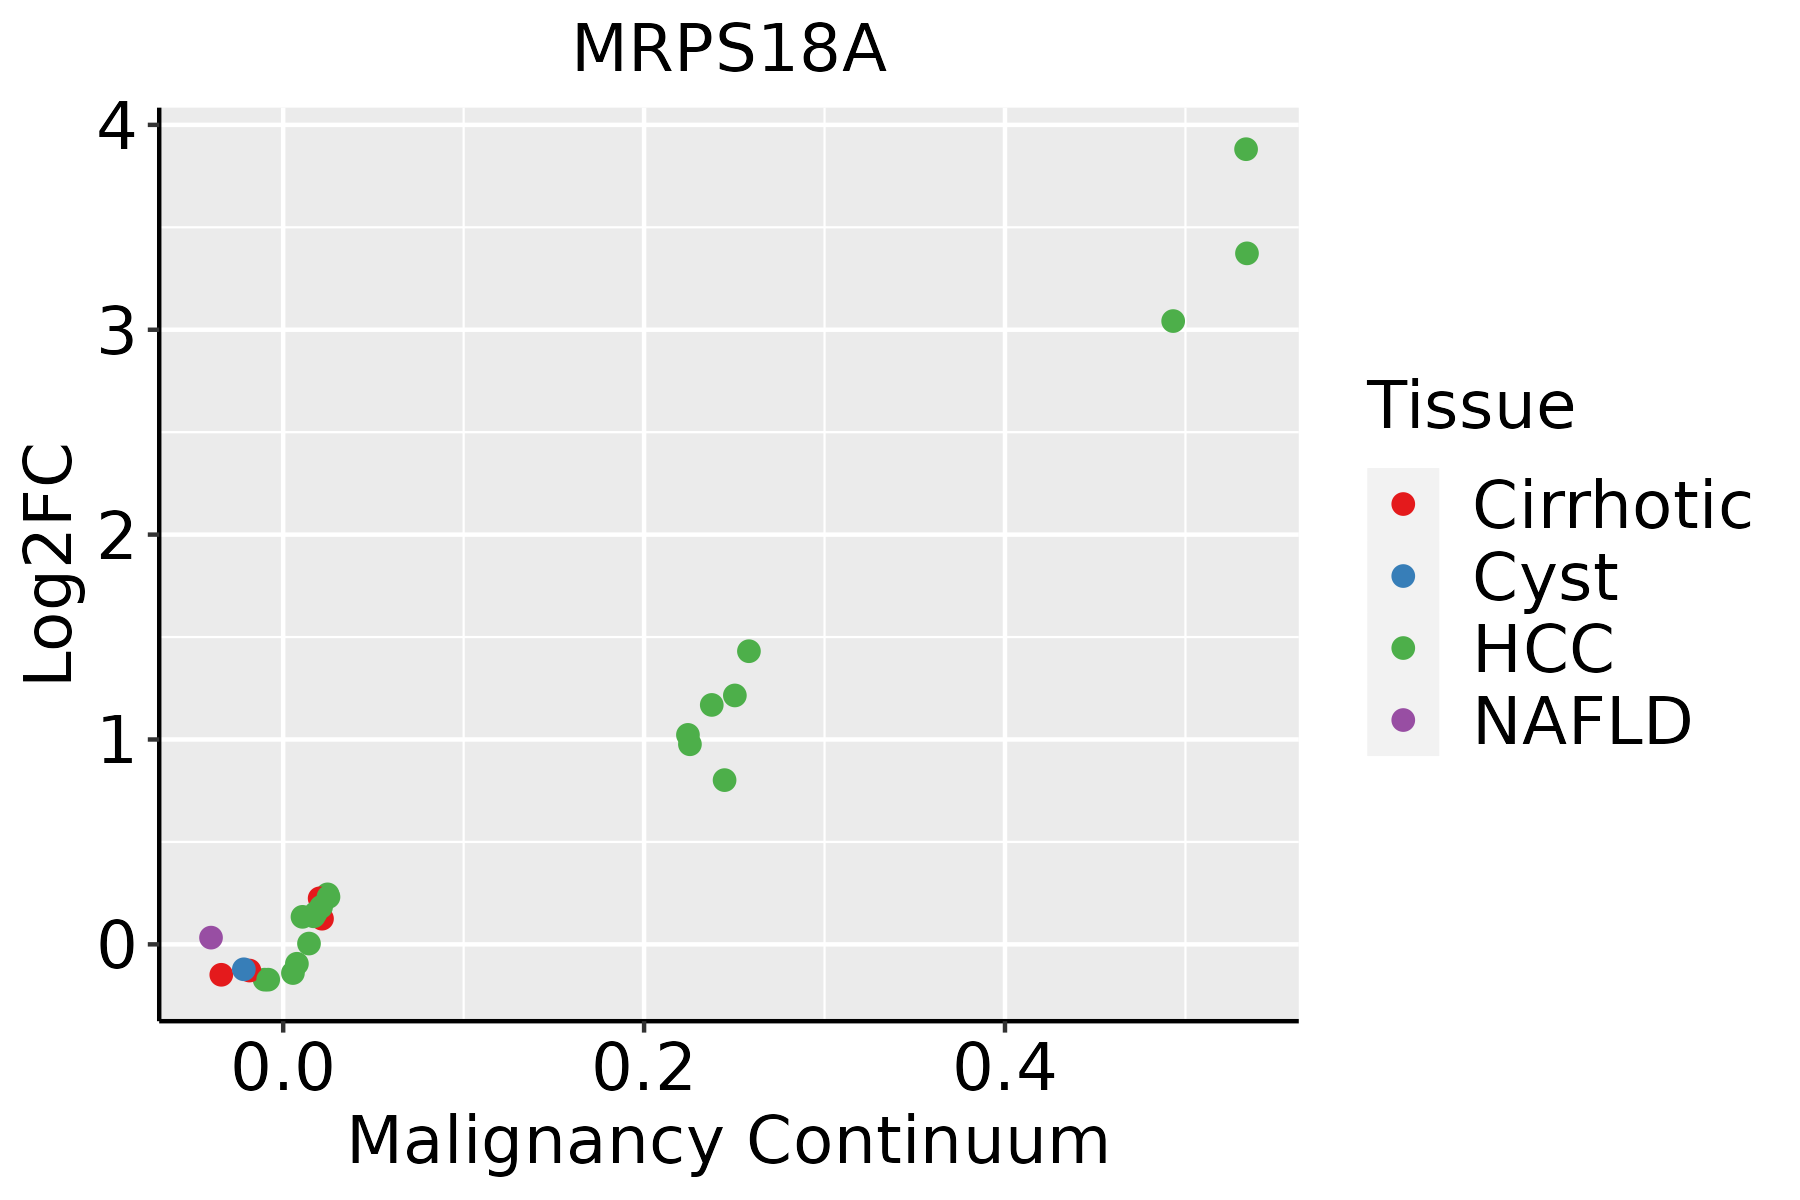 | HCC: Hepatocellular carcinoma |
| NAFLD: Non-alcoholic fatty liver disease | ||
| Oral Cavity | 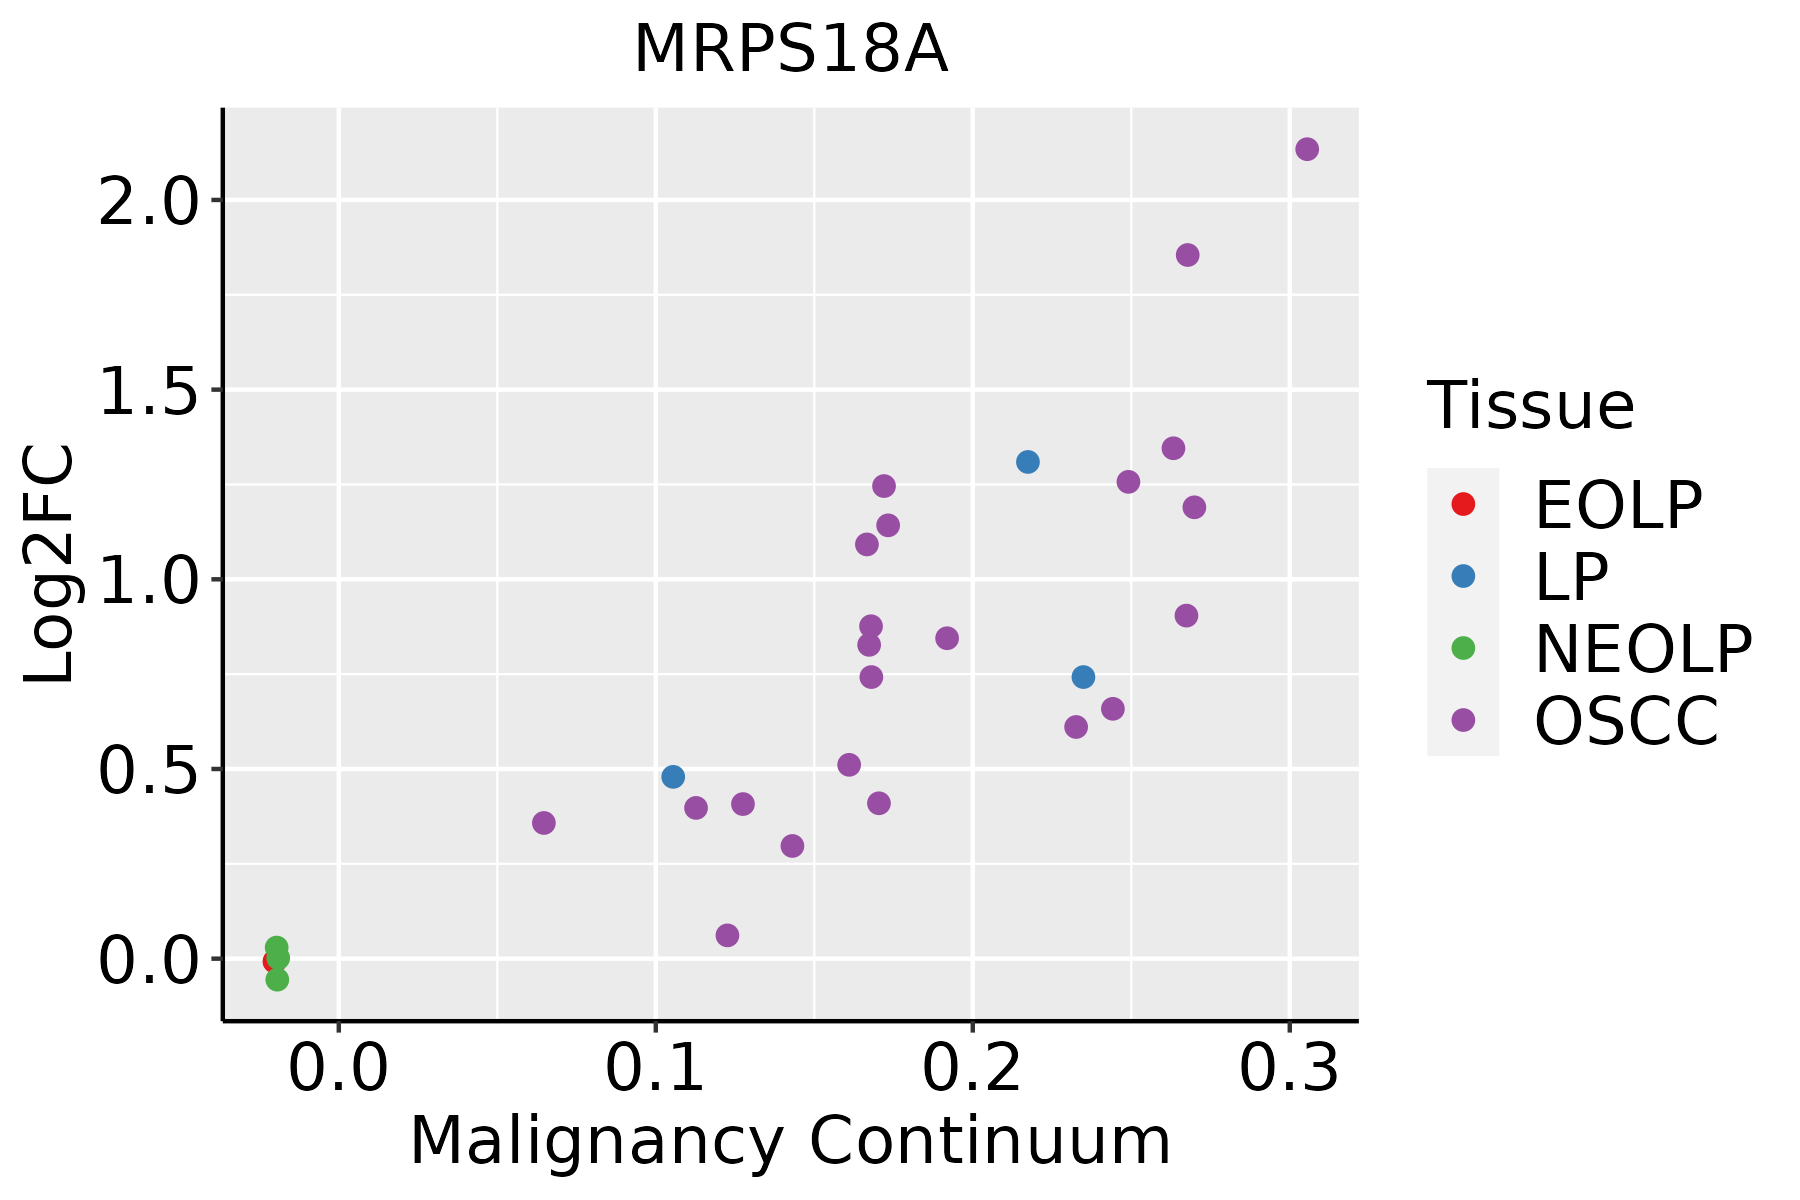 | EOLP: Erosive Oral lichen planus |
| LP: leukoplakia | ||
| NEOLP: Non-erosive oral lichen planus | ||
| OSCC: Oral squamous cell carcinoma | ||
| Skin | 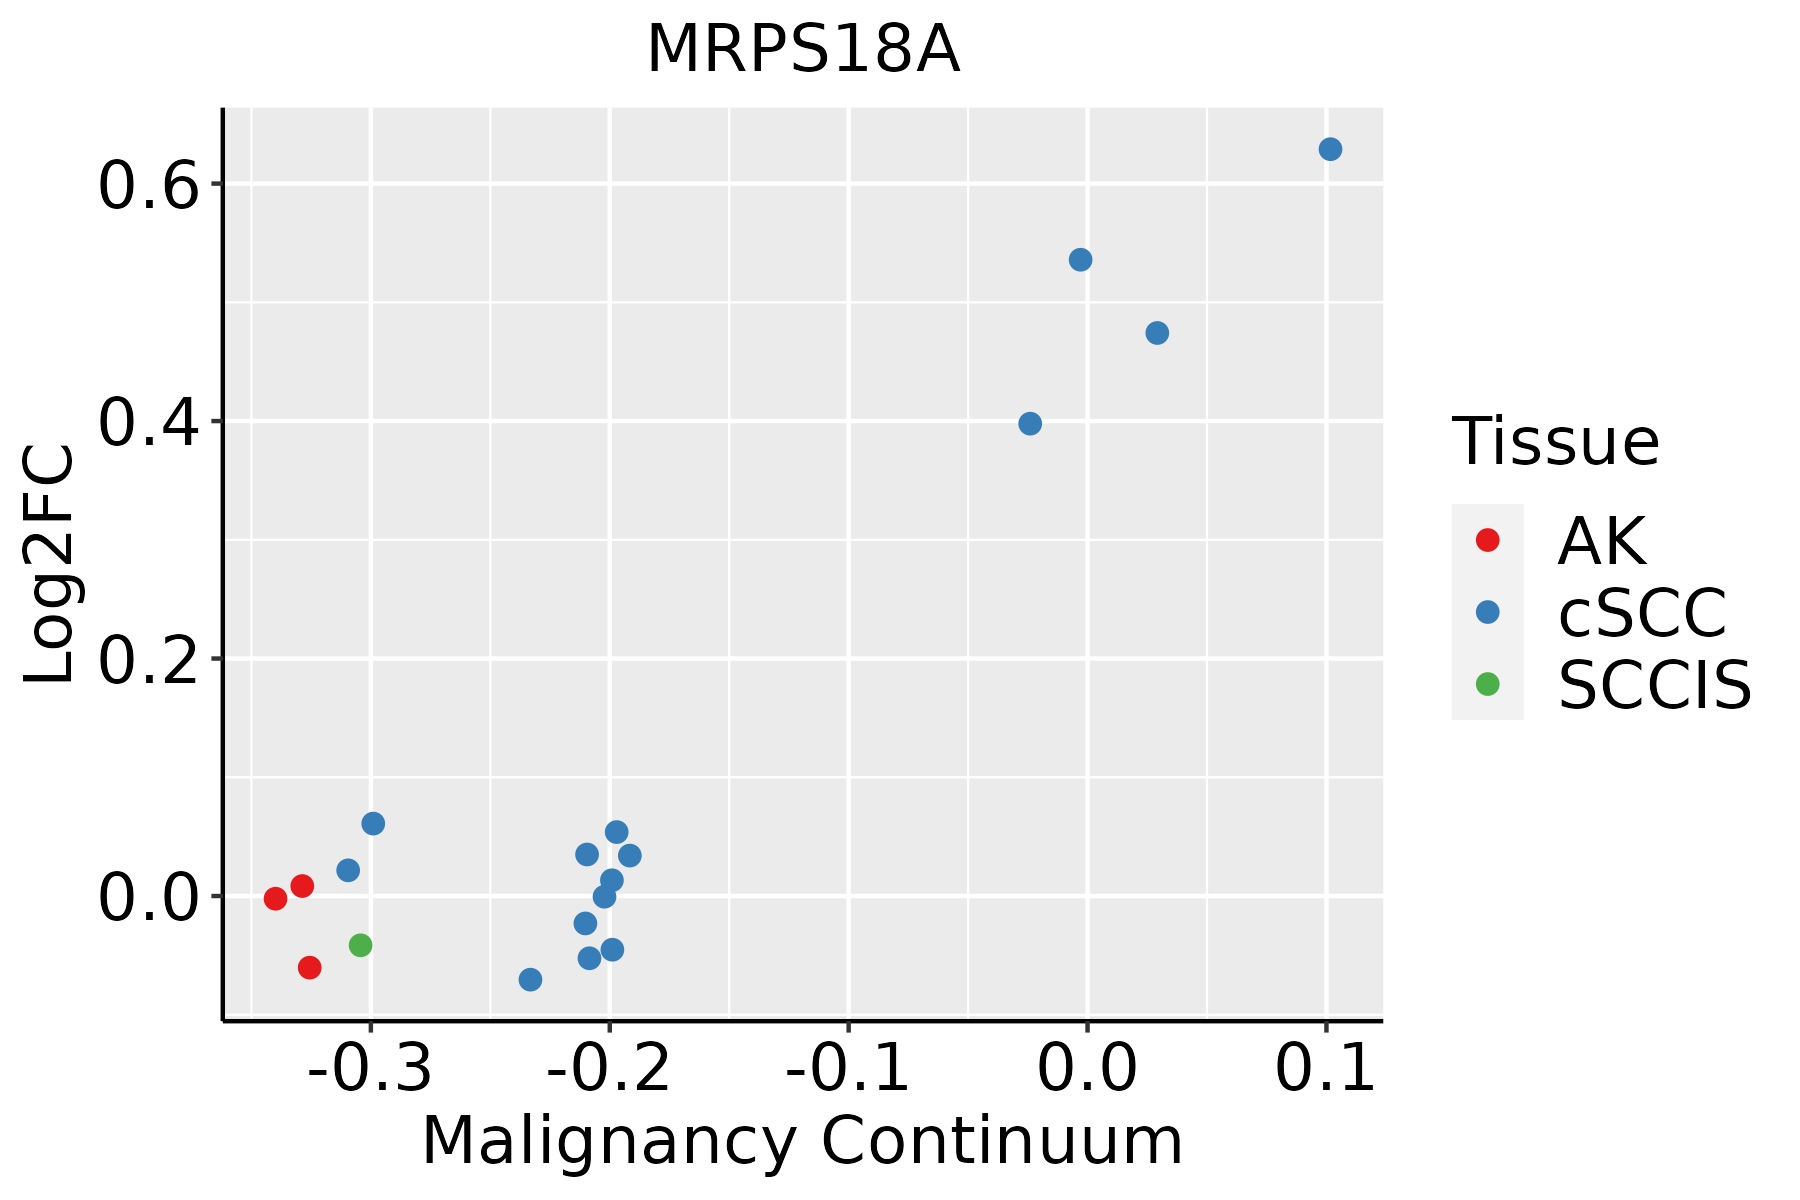 | AK: Actinic keratosis |
| cSCC: Cutaneous squamous cell carcinoma | ||
| SCCIS:squamous cell carcinoma in situ | ||
| Thyroid | 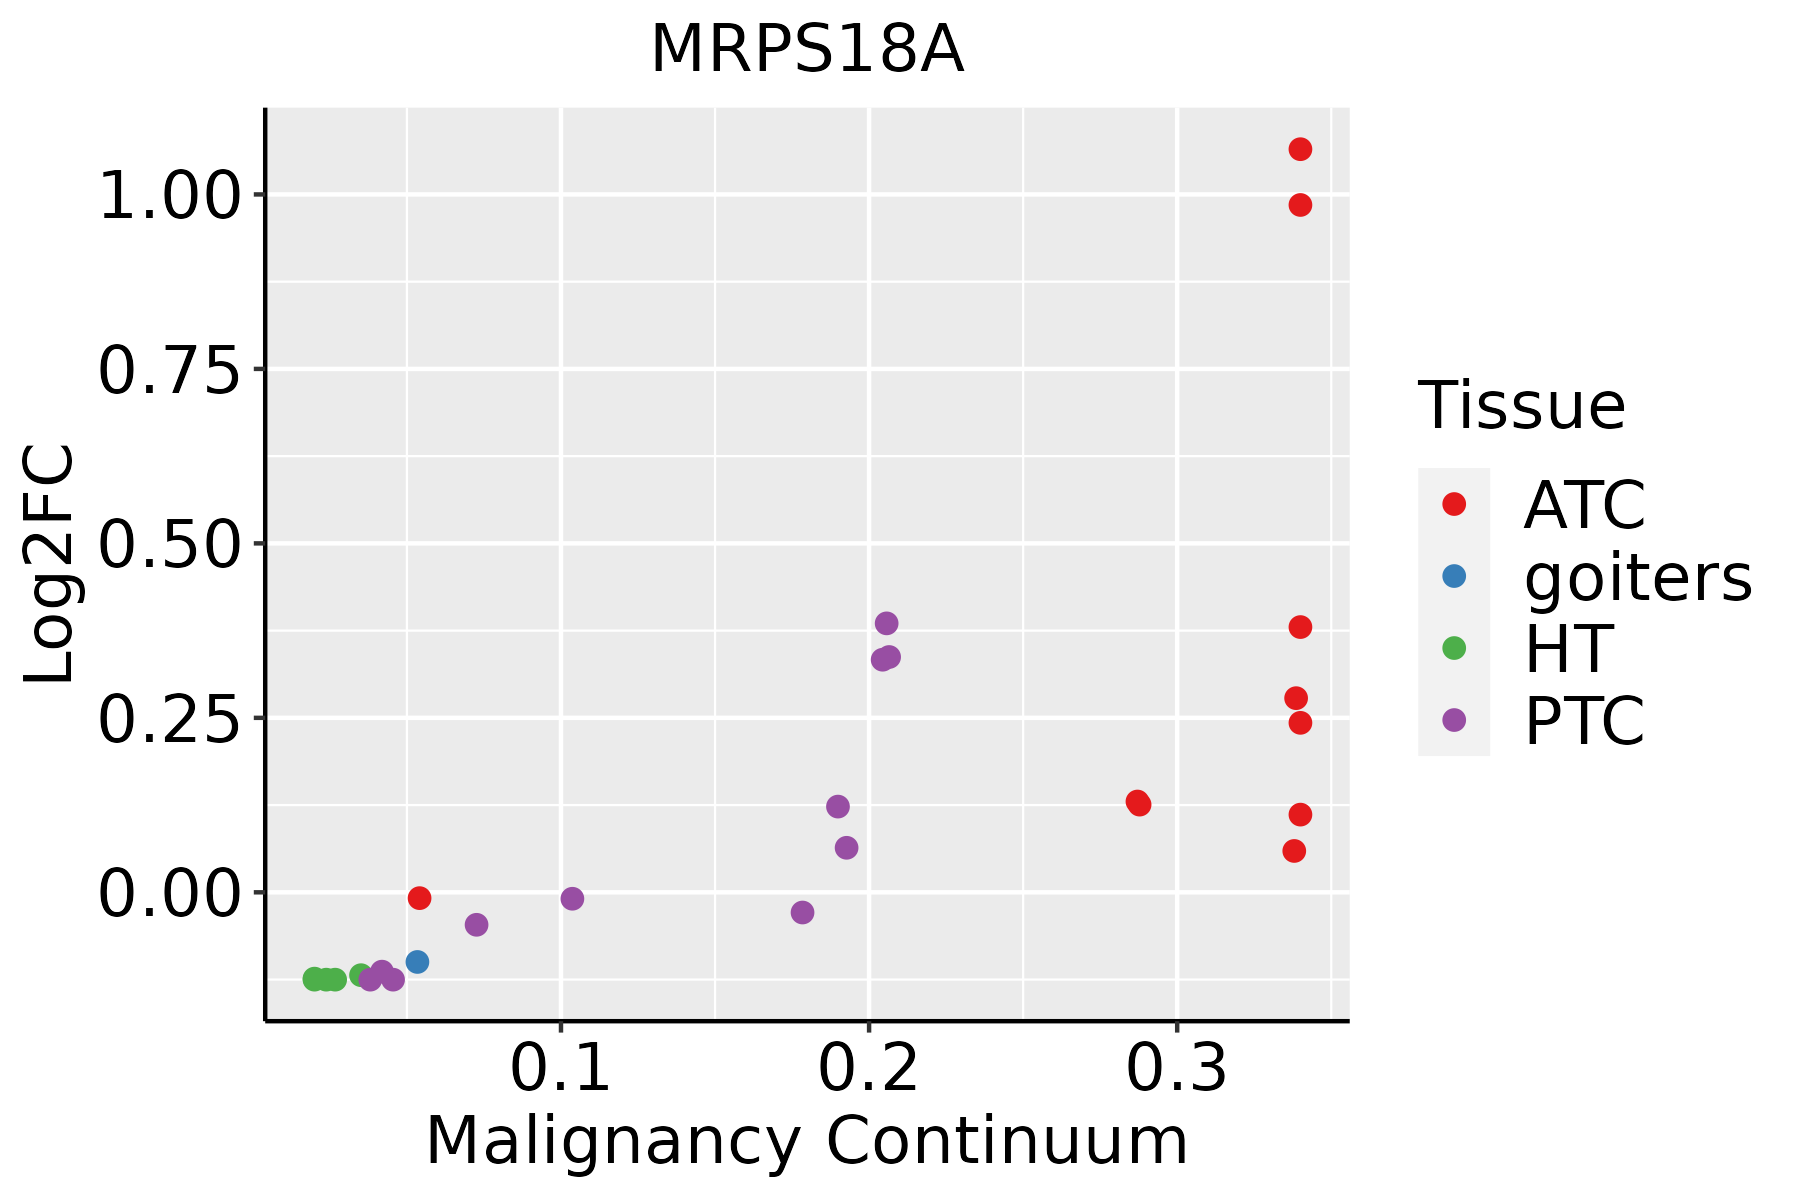 | ATC: Anaplastic thyroid cancer |
| HT: Hashimoto's thyroiditis | ||
| PTC: Papillary thyroid cancer |
| ∗log2FC in expression of this searched gene in stem-like cells from each diseased tissue sample relative to stem-like cells in normal samples in each tissue plotted against the malignancy continuum. Samples are colored based on if they are from different disease stage. |
Top |
Malignant transformation related pathway analysis |
| Find out the enriched GO biological processes and KEGG pathways involved in transition from healthy to precancer to cancer |
| Tissue | Disease Stage | Enriched GO biological Processes |
| Colorectum | AD |  |
| Colorectum | SER |  |
| Colorectum | MSS |  |
| Colorectum | MSI-H |  |
| Colorectum | FAP |  |
| ∗Top 15 enriched GO BP terms are showed in the bar plot of each disease state in each tissue. Each row represents a significant GO biological process which is colored according to the -log10(p.adjust). |
| Page: 1 2 3 4 5 6 7 8 9 |
| GO ID | Tissue | Disease Stage | Description | Gene Ratio | Bg Ratio | pvalue | p.adjust | Count |
| GO:00325435 | Esophagus | HGIN | mitochondrial translation | 23/2587 | 76/18723 | 1.61e-04 | 3.16e-03 | 23 |
| GO:01400534 | Esophagus | HGIN | mitochondrial gene expression | 27/2587 | 108/18723 | 1.34e-03 | 1.57e-02 | 27 |
| GO:014005313 | Esophagus | ESCC | mitochondrial gene expression | 93/8552 | 108/18723 | 1.96e-18 | 2.03e-16 | 93 |
| GO:003254314 | Esophagus | ESCC | mitochondrial translation | 68/8552 | 76/18723 | 1.02e-15 | 6.86e-14 | 68 |
| GO:0032543 | Liver | Cirrhotic | mitochondrial translation | 40/4634 | 76/18723 | 1.61e-07 | 4.29e-06 | 40 |
| GO:0140053 | Liver | Cirrhotic | mitochondrial gene expression | 49/4634 | 108/18723 | 2.35e-06 | 4.31e-05 | 49 |
| GO:01400531 | Liver | HCC | mitochondrial gene expression | 82/7958 | 108/18723 | 1.49e-12 | 7.20e-11 | 82 |
| GO:00325431 | Liver | HCC | mitochondrial translation | 62/7958 | 76/18723 | 2.95e-12 | 1.34e-10 | 62 |
| GO:01400533 | Oral cavity | OSCC | mitochondrial gene expression | 78/7305 | 108/18723 | 2.37e-12 | 9.86e-11 | 78 |
| GO:00325434 | Oral cavity | OSCC | mitochondrial translation | 59/7305 | 76/18723 | 7.21e-12 | 2.70e-10 | 59 |
| GO:003254313 | Oral cavity | LP | mitochondrial translation | 43/4623 | 76/18723 | 2.85e-09 | 1.26e-07 | 43 |
| GO:014005312 | Oral cavity | LP | mitochondrial gene expression | 53/4623 | 108/18723 | 3.54e-08 | 1.27e-06 | 53 |
| GO:00325436 | Skin | cSCC | mitochondrial translation | 47/4864 | 76/18723 | 4.70e-11 | 2.22e-09 | 47 |
| GO:01400535 | Skin | cSCC | mitochondrial gene expression | 56/4864 | 108/18723 | 8.06e-09 | 2.56e-07 | 56 |
| GO:01400536 | Thyroid | PTC | mitochondrial gene expression | 51/5968 | 108/18723 | 6.04e-04 | 3.83e-03 | 51 |
| GO:00325437 | Thyroid | PTC | mitochondrial translation | 38/5968 | 76/18723 | 7.52e-04 | 4.67e-03 | 38 |
| GO:014005314 | Thyroid | ATC | mitochondrial gene expression | 51/6293 | 108/18723 | 2.26e-03 | 1.06e-02 | 51 |
| GO:003254315 | Thyroid | ATC | mitochondrial translation | 38/6293 | 76/18723 | 2.26e-03 | 1.06e-02 | 38 |
| Page: 1 |
| Pathway ID | Tissue | Disease Stage | Description | Gene Ratio | Bg Ratio | pvalue | p.adjust | qvalue | Count |
| hsa0301039 | Esophagus | HGIN | Ribosome | 108/1383 | 167/8465 | 1.44e-45 | 4.71e-43 | 3.74e-43 | 108 |
| hsa03010115 | Esophagus | HGIN | Ribosome | 108/1383 | 167/8465 | 1.44e-45 | 4.71e-43 | 3.74e-43 | 108 |
| hsa03010211 | Esophagus | ESCC | Ribosome | 129/4205 | 167/8465 | 1.43e-13 | 3.43e-12 | 1.75e-12 | 129 |
| hsa03010310 | Esophagus | ESCC | Ribosome | 129/4205 | 167/8465 | 1.43e-13 | 3.43e-12 | 1.75e-12 | 129 |
| hsa0301022 | Liver | Cirrhotic | Ribosome | 127/2530 | 167/8465 | 2.12e-35 | 7.06e-33 | 4.35e-33 | 127 |
| hsa0301032 | Liver | Cirrhotic | Ribosome | 127/2530 | 167/8465 | 2.12e-35 | 7.06e-33 | 4.35e-33 | 127 |
| hsa0301042 | Liver | HCC | Ribosome | 128/4020 | 167/8465 | 7.32e-15 | 2.23e-13 | 1.24e-13 | 128 |
| hsa0301052 | Liver | HCC | Ribosome | 128/4020 | 167/8465 | 7.32e-15 | 2.23e-13 | 1.24e-13 | 128 |
| hsa0301030 | Oral cavity | OSCC | Ribosome | 128/3704 | 167/8465 | 2.42e-18 | 1.62e-16 | 8.25e-17 | 128 |
| hsa03010114 | Oral cavity | OSCC | Ribosome | 128/3704 | 167/8465 | 2.42e-18 | 1.62e-16 | 8.25e-17 | 128 |
| hsa03010210 | Oral cavity | LP | Ribosome | 127/2418 | 167/8465 | 1.22e-37 | 4.05e-35 | 2.61e-35 | 127 |
| hsa0301038 | Oral cavity | LP | Ribosome | 127/2418 | 167/8465 | 1.22e-37 | 4.05e-35 | 2.61e-35 | 127 |
| Page: 1 |
Top |
Cell-cell communication analysis |
| Identification of potential cell-cell interactions between two cell types and their ligand-receptor pairs for different disease states |
| Ligand | Receptor | LRpair | Pathway | Tissue | Disease Stage |
| Page: 1 |
Top |
Single-cell gene regulatory network inference analysis |
| Find out the significant the regulons (TFs) and the target genes of each regulon across cell types for different disease states |
| TF | Cell Type | Tissue | Disease Stage | Target Gene | RSS | Regulon Activity |
| ∗The dot plots of a searched regulon are shown for all cell subpopulations in each disease state of each tissue based on the regulon specific score inferred using pySCENIC and by calculating the average expression. |
| Page: 1 |
Top |
Somatic mutation of malignant transformation related genes |
| Annotation of somatic variants for genes involved in malignant transformation |
| Hugo Symbol | Variant Class | Variant Classification | dbSNP RS | HGVSc | HGVSp | HGVSp Short | SWISSPROT | BIOTYPE | SIFT | PolyPhen | Tumor Sample Barcode | Tissue | Histology | Sex | Age | Stage | Therapy Types | Drugs | Outcome |
| MRPS18A | insertion | Nonsense_Mutation | novel | c.186_187insGTTCTTCAGAGCTCTCACAGGTGACATGAAA | p.Pro63ValfsTer8 | p.P63Vfs*8 | Q9NVS2 | protein_coding | TCGA-BH-A0DS-01 | Breast | breast invasive carcinoma | Female | >=65 | III/IV | Chemotherapy | cyclophosphamide | SD | ||
| MRPS18A | SNV | Missense_Mutation | novel | c.176N>C | p.Glu59Ala | p.E59A | Q9NVS2 | protein_coding | tolerated(0.39) | benign(0) | TCGA-A6-3808-01 | Colorectum | colon adenocarcinoma | Male | >=65 | I/II | Unknown | Unknown | SD |
| MRPS18A | SNV | Missense_Mutation | novel | c.175N>C | p.Glu59Gln | p.E59Q | Q9NVS2 | protein_coding | tolerated(0.24) | benign(0.248) | TCGA-A6-3808-01 | Colorectum | colon adenocarcinoma | Male | >=65 | I/II | Unknown | Unknown | SD |
| MRPS18A | SNV | Missense_Mutation | rs377393438 | c.221G>A | p.Arg74His | p.R74H | Q9NVS2 | protein_coding | deleterious(0) | probably_damaging(0.987) | TCGA-A6-5665-01 | Colorectum | colon adenocarcinoma | Female | >=65 | I/II | Unknown | Unknown | PD |
| MRPS18A | SNV | Missense_Mutation | rs377393438 | c.221N>A | p.Arg74His | p.R74H | Q9NVS2 | protein_coding | deleterious(0) | probably_damaging(0.987) | TCGA-AA-3845-01 | Colorectum | colon adenocarcinoma | Female | >=65 | I/II | Unknown | Unknown | PD |
| MRPS18A | SNV | Missense_Mutation | c.517N>T | p.Arg173Cys | p.R173C | Q9NVS2 | protein_coding | deleterious(0.02) | benign(0.007) | TCGA-CK-4951-01 | Colorectum | colon adenocarcinoma | Female | >=65 | I/II | Unknown | Unknown | PD | |
| MRPS18A | SNV | Missense_Mutation | novel | c.235C>T | p.His79Tyr | p.H79Y | Q9NVS2 | protein_coding | tolerated(0.34) | benign(0.026) | TCGA-AJ-A3EK-01 | Endometrium | uterine corpus endometrioid carcinoma | Female | <65 | I/II | Chemotherapy | carboplatin | CR |
| MRPS18A | SNV | Missense_Mutation | novel | c.425A>G | p.Lys142Arg | p.K142R | Q9NVS2 | protein_coding | tolerated(0.09) | benign(0.039) | TCGA-B5-A1MX-01 | Endometrium | uterine corpus endometrioid carcinoma | Female | <65 | I/II | Hormone Therapy | megace | SD |
| MRPS18A | SNV | Missense_Mutation | rs773115392 | c.337N>T | p.Arg113Cys | p.R113C | Q9NVS2 | protein_coding | deleterious(0) | probably_damaging(0.94) | TCGA-D1-A103-01 | Endometrium | uterine corpus endometrioid carcinoma | Female | >=65 | I/II | Unknown | Unknown | SD |
| MRPS18A | SNV | Missense_Mutation | novel | c.379N>A | p.Leu127Ile | p.L127I | Q9NVS2 | protein_coding | deleterious(0) | probably_damaging(0.999) | TCGA-EO-A3B0-01 | Endometrium | uterine corpus endometrioid carcinoma | Female | <65 | III/IV | Unknown | Unknown | SD |
| Page: 1 2 |
Top |
Related drugs of malignant transformation related genes |
| Identification of chemicals and drugs interact with genes involved in malignant transfromation |
| (DGIdb 4.0) |
| Entrez ID | Symbol | Category | Interaction Types | Drug Claim Name | Drug Name | PMIDs |
| Page: 1 |

Copyright 2023-Present -The University of Texas Health Science Center at Houston |