
|
|||||
|
 | |
| |
| |
| |
| |
| |
|
Gene: MRPS15 |
Gene summary for MRPS15 |
| Gene information | Species | Human | Gene symbol | MRPS15 | Gene ID | 64960 |
| Gene name | mitochondrial ribosomal protein S15 | |
| Gene Alias | DC37 | |
| Cytomap | 1p34.3 | |
| Gene Type | protein-coding | GO ID | GO:0006412 | UniProtAcc | P82914 |
Top |
Malignant transformation analysis |
| Identification of the aberrant gene expression in precancerous and cancerous lesions by comparing the gene expression of stem-like cells in diseased tissues with normal stem cells |
| Entrez ID | Symbol | Replicates | Species | Organ | Tissue | Adj P-value | Log2FC | Malignancy |
| 64960 | MRPS15 | GSM4909285 | Human | Breast | IDC | 1.10e-18 | 5.31e-01 | 0.21 |
| 64960 | MRPS15 | GSM4909288 | Human | Breast | IDC | 3.23e-02 | -1.08e-01 | 0.0988 |
| 64960 | MRPS15 | GSM4909296 | Human | Breast | IDC | 1.37e-11 | 4.77e-02 | 0.1524 |
| 64960 | MRPS15 | GSM4909297 | Human | Breast | IDC | 6.64e-11 | -7.96e-02 | 0.1517 |
| 64960 | MRPS15 | GSM4909311 | Human | Breast | IDC | 9.65e-27 | -2.45e-01 | 0.1534 |
| 64960 | MRPS15 | GSM4909312 | Human | Breast | IDC | 1.26e-18 | 9.01e-02 | 0.1552 |
| 64960 | MRPS15 | GSM4909316 | Human | Breast | IDC | 1.59e-02 | 1.19e-01 | 0.21 |
| 64960 | MRPS15 | GSM4909319 | Human | Breast | IDC | 5.17e-37 | -1.81e-01 | 0.1563 |
| 64960 | MRPS15 | GSM4909320 | Human | Breast | IDC | 4.60e-04 | -1.94e-01 | 0.1575 |
| 64960 | MRPS15 | GSM4909321 | Human | Breast | IDC | 6.53e-16 | 6.12e-03 | 0.1559 |
| 64960 | MRPS15 | brca1 | Human | Breast | Precancer | 2.30e-11 | 4.04e-01 | -0.0338 |
| 64960 | MRPS15 | brca2 | Human | Breast | Precancer | 9.88e-03 | 2.06e-01 | -0.024 |
| 64960 | MRPS15 | M2 | Human | Breast | IDC | 2.54e-03 | 1.15e-01 | 0.21 |
| 64960 | MRPS15 | NCCBC14 | Human | Breast | DCIS | 4.56e-08 | 5.13e-02 | 0.2021 |
| 64960 | MRPS15 | NCCBC2 | Human | Breast | DCIS | 1.82e-04 | -1.90e-01 | 0.1554 |
| 64960 | MRPS15 | NCCBC3 | Human | Breast | DCIS | 1.86e-05 | -1.39e-02 | 0.1198 |
| 64960 | MRPS15 | NCCBC5 | Human | Breast | DCIS | 1.10e-17 | 2.49e-01 | 0.2046 |
| 64960 | MRPS15 | P1 | Human | Breast | IDC | 1.00e-10 | -3.13e-01 | 0.1527 |
| 64960 | MRPS15 | P2 | Human | Breast | IDC | 3.00e-05 | 1.66e-01 | 0.21 |
| 64960 | MRPS15 | DCIS2 | Human | Breast | DCIS | 1.06e-52 | 3.13e-02 | 0.0085 |
| Page: 1 2 3 4 5 6 7 8 |
| Tissue | Expression Dynamics | Abbreviation |
| Breast |  | IDC: Invasive ductal carcinoma |
| DCIS: Ductal carcinoma in situ | ||
| Precancer(BRCA1-mut): Precancerous lesion from BRCA1 mutation carriers | ||
| Esophagus | 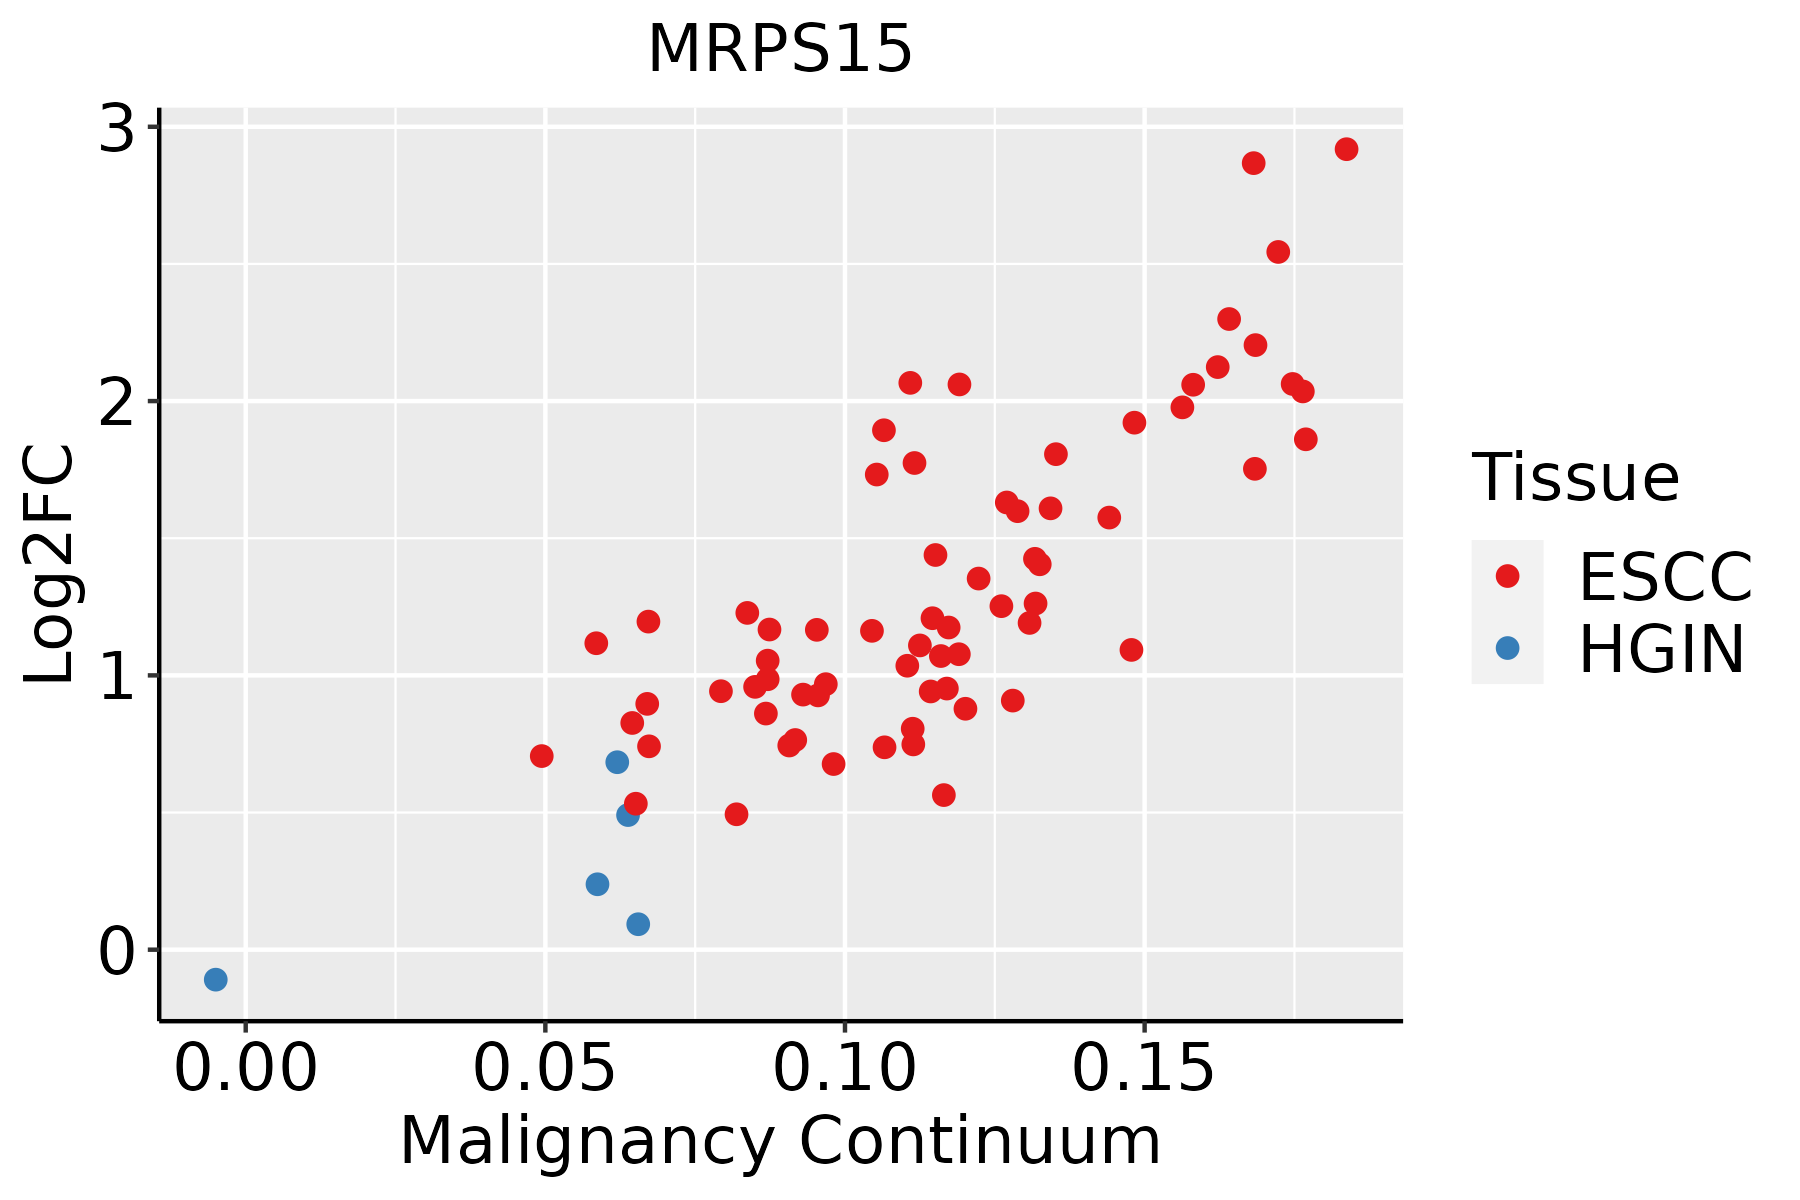 | ESCC: Esophageal squamous cell carcinoma |
| HGIN: High-grade intraepithelial neoplasias | ||
| LGIN: Low-grade intraepithelial neoplasias | ||
| Liver | 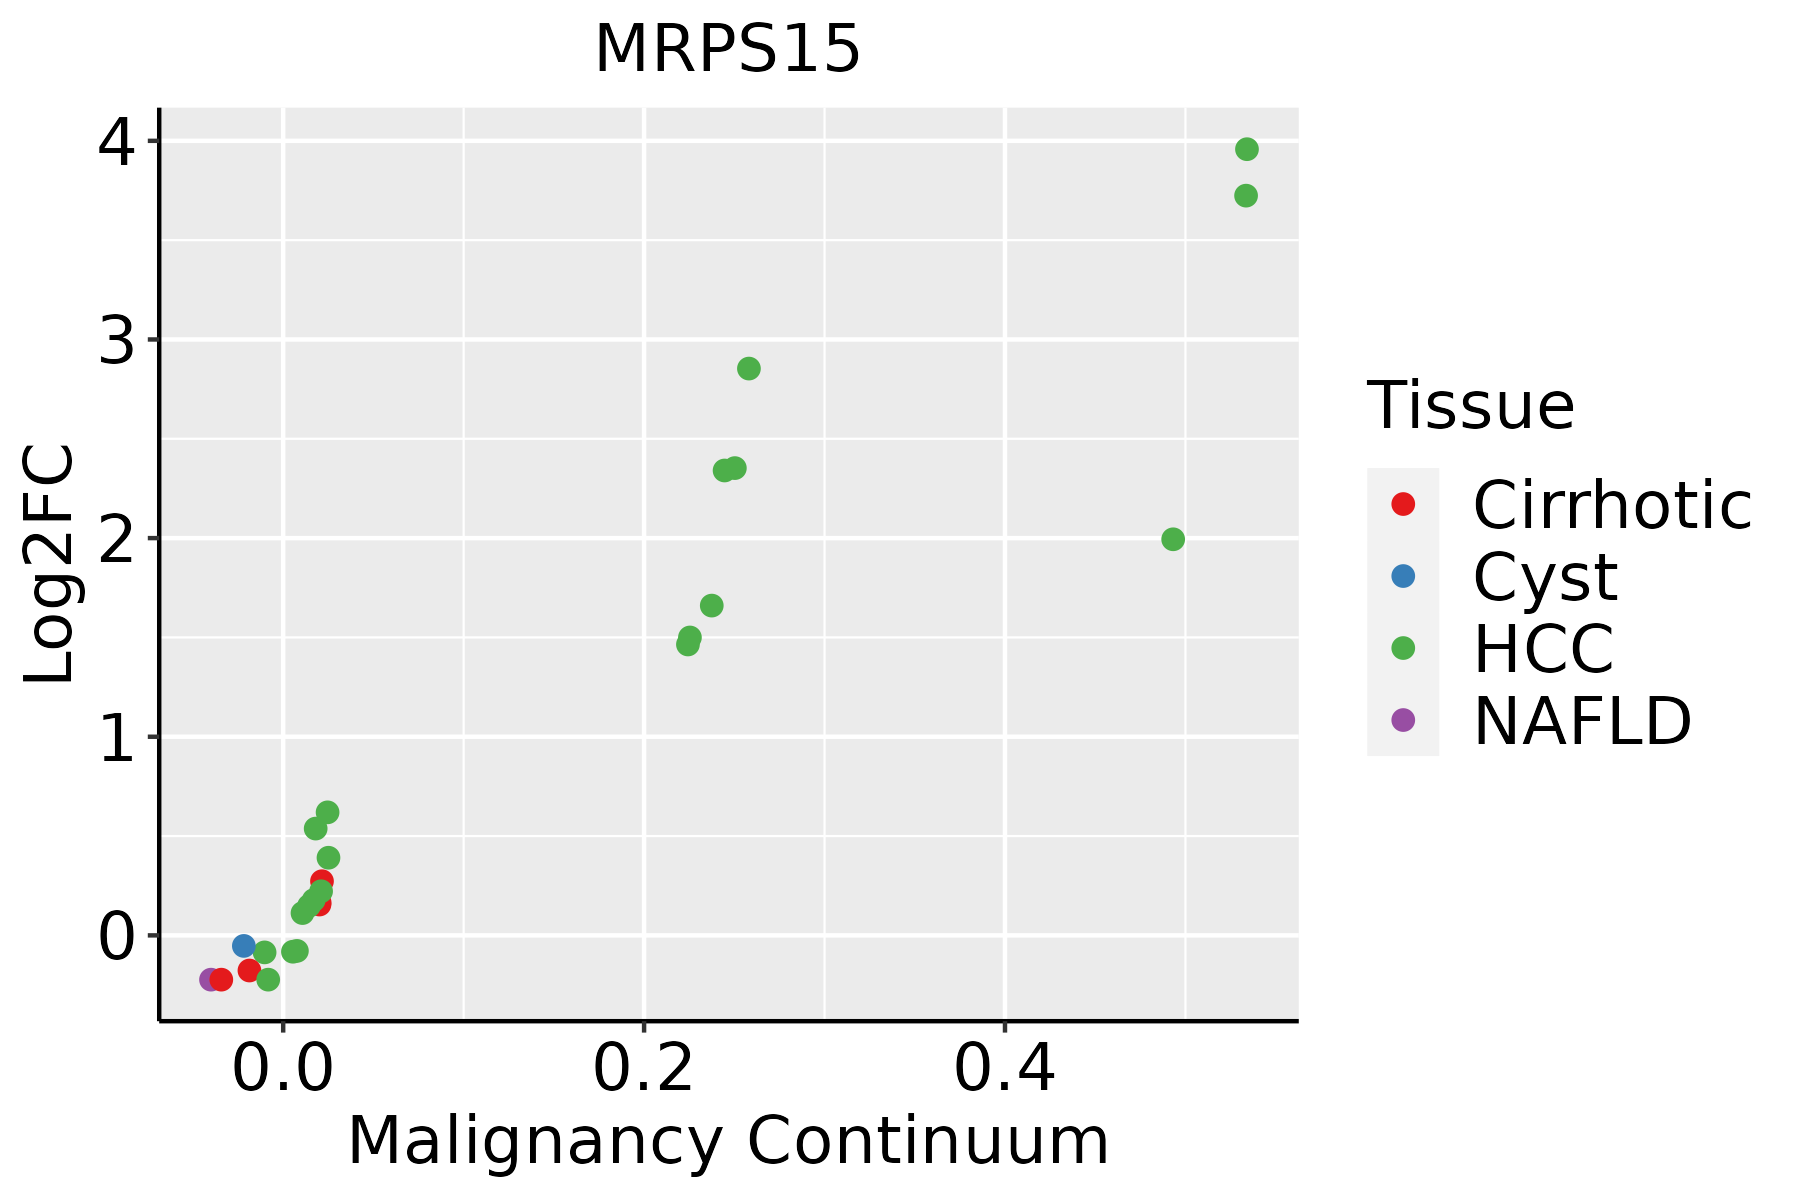 | HCC: Hepatocellular carcinoma |
| NAFLD: Non-alcoholic fatty liver disease | ||
| Oral Cavity |  | EOLP: Erosive Oral lichen planus |
| LP: leukoplakia | ||
| NEOLP: Non-erosive oral lichen planus | ||
| OSCC: Oral squamous cell carcinoma | ||
| Prostate | 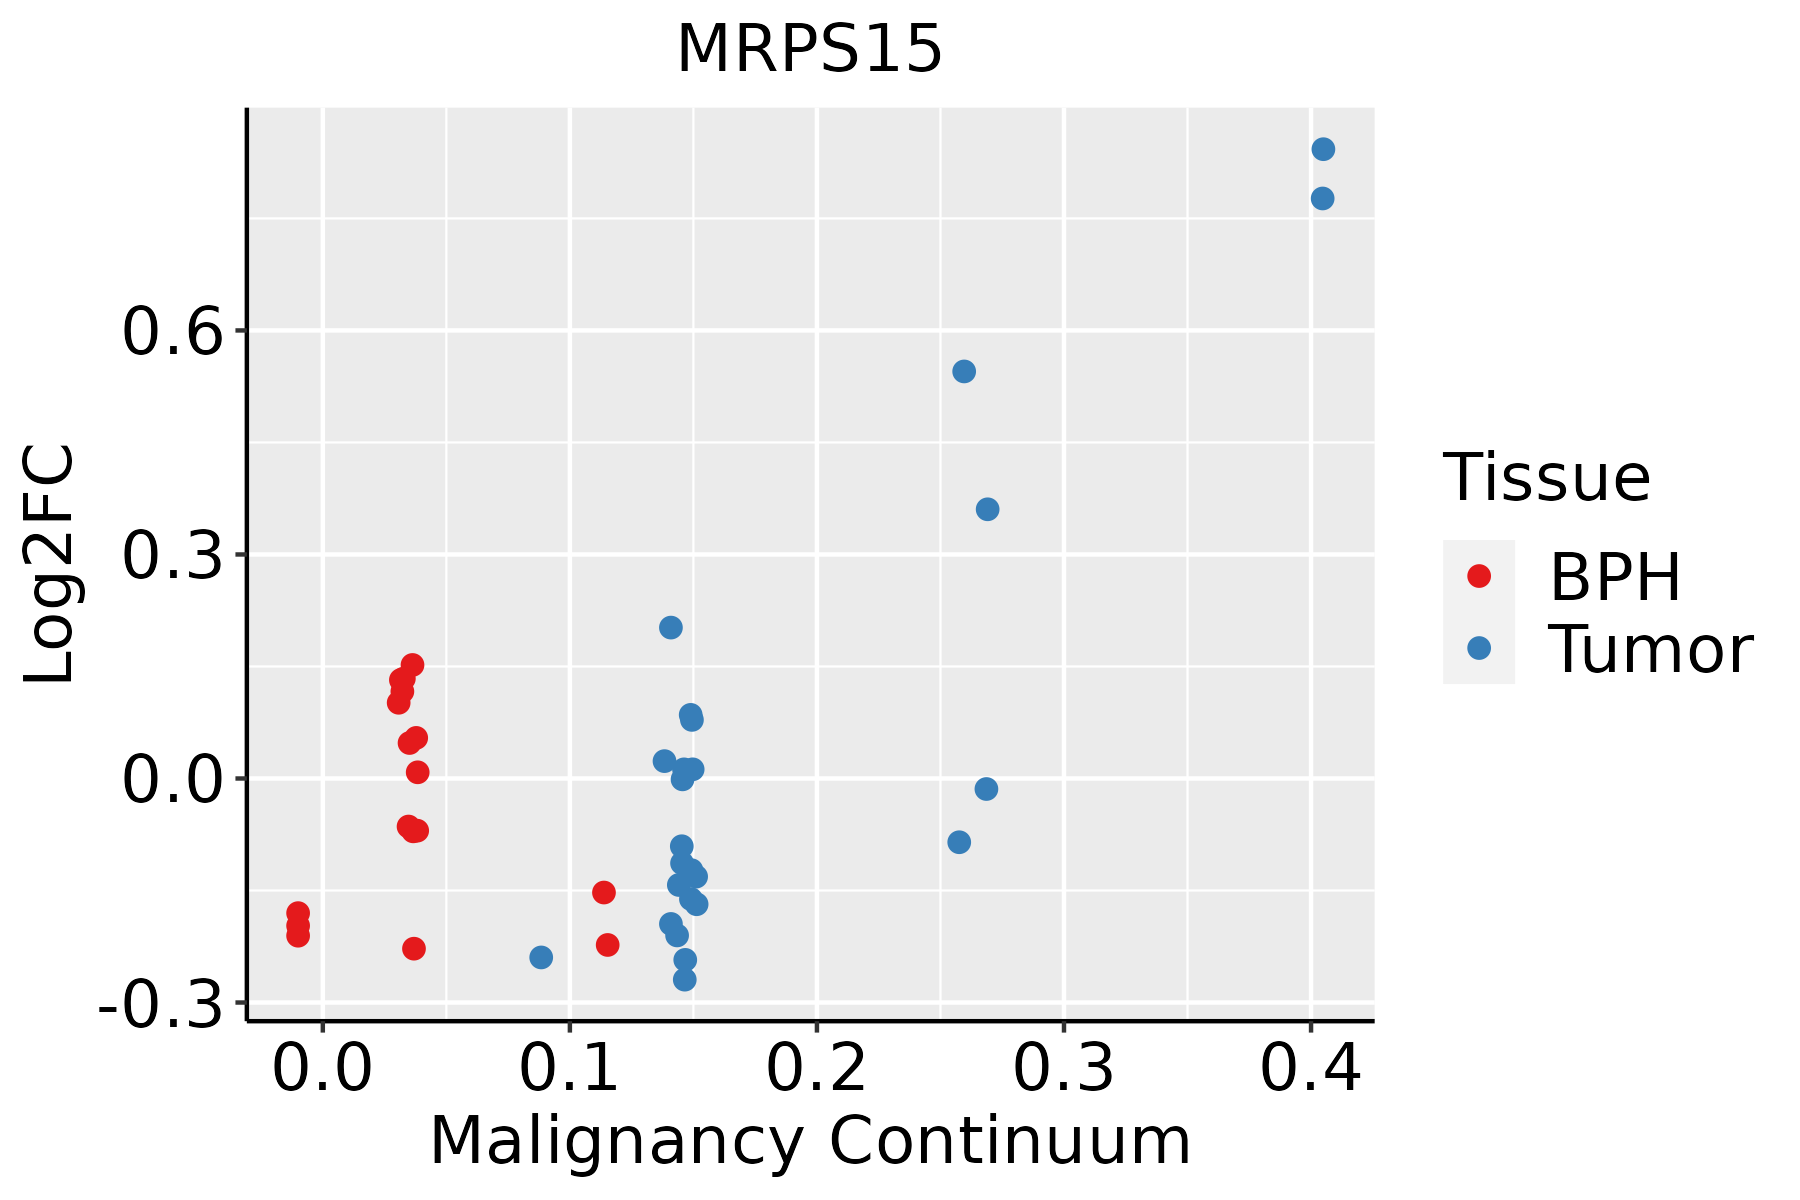 | BPH: Benign Prostatic Hyperplasia |
| Skin | 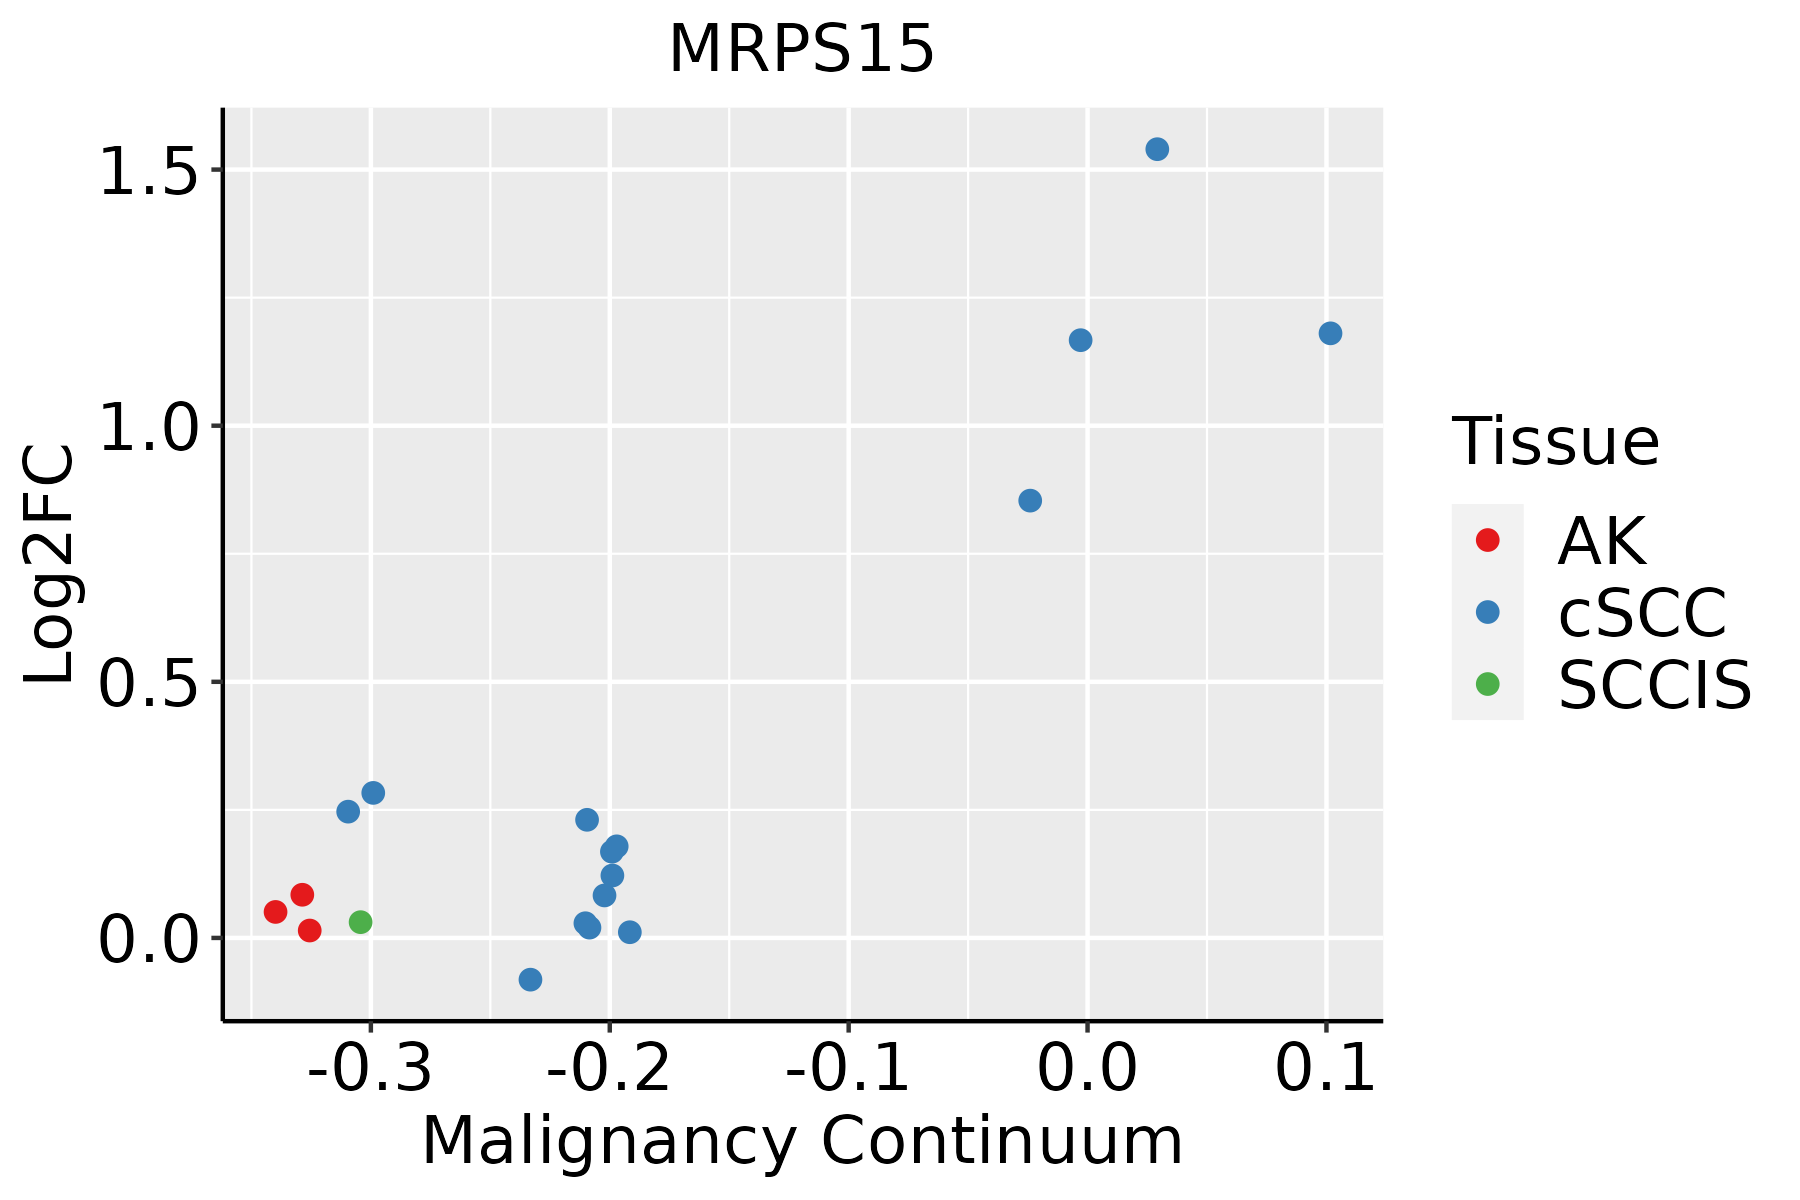 | AK: Actinic keratosis |
| cSCC: Cutaneous squamous cell carcinoma | ||
| SCCIS:squamous cell carcinoma in situ | ||
| Thyroid |  | ATC: Anaplastic thyroid cancer |
| HT: Hashimoto's thyroiditis | ||
| PTC: Papillary thyroid cancer |
| ∗log2FC in expression of this searched gene in stem-like cells from each diseased tissue sample relative to stem-like cells in normal samples in each tissue plotted against the malignancy continuum. Samples are colored based on if they are from different disease stage. |
Top |
Malignant transformation related pathway analysis |
| Find out the enriched GO biological processes and KEGG pathways involved in transition from healthy to precancer to cancer |
| Tissue | Disease Stage | Enriched GO biological Processes |
| Colorectum | AD |  |
| Colorectum | SER |  |
| Colorectum | MSS |  |
| Colorectum | MSI-H |  |
| Colorectum | FAP |  |
| ∗Top 15 enriched GO BP terms are showed in the bar plot of each disease state in each tissue. Each row represents a significant GO biological process which is colored according to the -log10(p.adjust). |
| Page: 1 2 3 4 5 6 7 8 9 |
| GO ID | Tissue | Disease Stage | Description | Gene Ratio | Bg Ratio | pvalue | p.adjust | Count |
| GO:00325432 | Breast | IDC | mitochondrial translation | 13/1434 | 76/18723 | 4.81e-03 | 3.67e-02 | 13 |
| GO:003254311 | Breast | DCIS | mitochondrial translation | 13/1390 | 76/18723 | 3.70e-03 | 2.99e-02 | 13 |
| GO:00325435 | Esophagus | HGIN | mitochondrial translation | 23/2587 | 76/18723 | 1.61e-04 | 3.16e-03 | 23 |
| GO:01400534 | Esophagus | HGIN | mitochondrial gene expression | 27/2587 | 108/18723 | 1.34e-03 | 1.57e-02 | 27 |
| GO:014005313 | Esophagus | ESCC | mitochondrial gene expression | 93/8552 | 108/18723 | 1.96e-18 | 2.03e-16 | 93 |
| GO:003254314 | Esophagus | ESCC | mitochondrial translation | 68/8552 | 76/18723 | 1.02e-15 | 6.86e-14 | 68 |
| GO:0032543 | Liver | Cirrhotic | mitochondrial translation | 40/4634 | 76/18723 | 1.61e-07 | 4.29e-06 | 40 |
| GO:0140053 | Liver | Cirrhotic | mitochondrial gene expression | 49/4634 | 108/18723 | 2.35e-06 | 4.31e-05 | 49 |
| GO:01400531 | Liver | HCC | mitochondrial gene expression | 82/7958 | 108/18723 | 1.49e-12 | 7.20e-11 | 82 |
| GO:00325431 | Liver | HCC | mitochondrial translation | 62/7958 | 76/18723 | 2.95e-12 | 1.34e-10 | 62 |
| GO:01400533 | Oral cavity | OSCC | mitochondrial gene expression | 78/7305 | 108/18723 | 2.37e-12 | 9.86e-11 | 78 |
| GO:00325434 | Oral cavity | OSCC | mitochondrial translation | 59/7305 | 76/18723 | 7.21e-12 | 2.70e-10 | 59 |
| GO:003254313 | Oral cavity | LP | mitochondrial translation | 43/4623 | 76/18723 | 2.85e-09 | 1.26e-07 | 43 |
| GO:014005312 | Oral cavity | LP | mitochondrial gene expression | 53/4623 | 108/18723 | 3.54e-08 | 1.27e-06 | 53 |
| GO:00325433 | Prostate | BPH | mitochondrial translation | 23/3107 | 76/18723 | 2.21e-03 | 1.22e-02 | 23 |
| GO:01400532 | Prostate | BPH | mitochondrial gene expression | 29/3107 | 108/18723 | 4.68e-03 | 2.25e-02 | 29 |
| GO:003254312 | Prostate | Tumor | mitochondrial translation | 24/3246 | 76/18723 | 1.73e-03 | 1.03e-02 | 24 |
| GO:014005311 | Prostate | Tumor | mitochondrial gene expression | 31/3246 | 108/18723 | 2.31e-03 | 1.30e-02 | 31 |
| GO:00325436 | Skin | cSCC | mitochondrial translation | 47/4864 | 76/18723 | 4.70e-11 | 2.22e-09 | 47 |
| GO:01400535 | Skin | cSCC | mitochondrial gene expression | 56/4864 | 108/18723 | 8.06e-09 | 2.56e-07 | 56 |
| Page: 1 2 |
| Pathway ID | Tissue | Disease Stage | Description | Gene Ratio | Bg Ratio | pvalue | p.adjust | qvalue | Count |
| hsa0301018 | Breast | Precancer | Ribosome | 80/684 | 167/8465 | 7.33e-44 | 2.32e-41 | 1.77e-41 | 80 |
| hsa0301019 | Breast | Precancer | Ribosome | 80/684 | 167/8465 | 7.33e-44 | 2.32e-41 | 1.77e-41 | 80 |
| hsa0301024 | Breast | IDC | Ribosome | 83/867 | 167/8465 | 6.07e-39 | 9.87e-37 | 7.38e-37 | 83 |
| hsa0301034 | Breast | IDC | Ribosome | 83/867 | 167/8465 | 6.07e-39 | 9.87e-37 | 7.38e-37 | 83 |
| hsa0301044 | Breast | DCIS | Ribosome | 82/846 | 167/8465 | 8.69e-39 | 1.40e-36 | 1.03e-36 | 82 |
| hsa0301054 | Breast | DCIS | Ribosome | 82/846 | 167/8465 | 8.69e-39 | 1.40e-36 | 1.03e-36 | 82 |
| hsa0301039 | Esophagus | HGIN | Ribosome | 108/1383 | 167/8465 | 1.44e-45 | 4.71e-43 | 3.74e-43 | 108 |
| hsa03010115 | Esophagus | HGIN | Ribosome | 108/1383 | 167/8465 | 1.44e-45 | 4.71e-43 | 3.74e-43 | 108 |
| hsa03010211 | Esophagus | ESCC | Ribosome | 129/4205 | 167/8465 | 1.43e-13 | 3.43e-12 | 1.75e-12 | 129 |
| hsa03010310 | Esophagus | ESCC | Ribosome | 129/4205 | 167/8465 | 1.43e-13 | 3.43e-12 | 1.75e-12 | 129 |
| hsa0301022 | Liver | Cirrhotic | Ribosome | 127/2530 | 167/8465 | 2.12e-35 | 7.06e-33 | 4.35e-33 | 127 |
| hsa0301032 | Liver | Cirrhotic | Ribosome | 127/2530 | 167/8465 | 2.12e-35 | 7.06e-33 | 4.35e-33 | 127 |
| hsa0301042 | Liver | HCC | Ribosome | 128/4020 | 167/8465 | 7.32e-15 | 2.23e-13 | 1.24e-13 | 128 |
| hsa0301052 | Liver | HCC | Ribosome | 128/4020 | 167/8465 | 7.32e-15 | 2.23e-13 | 1.24e-13 | 128 |
| hsa0301030 | Oral cavity | OSCC | Ribosome | 128/3704 | 167/8465 | 2.42e-18 | 1.62e-16 | 8.25e-17 | 128 |
| hsa03010114 | Oral cavity | OSCC | Ribosome | 128/3704 | 167/8465 | 2.42e-18 | 1.62e-16 | 8.25e-17 | 128 |
| hsa03010210 | Oral cavity | LP | Ribosome | 127/2418 | 167/8465 | 1.22e-37 | 4.05e-35 | 2.61e-35 | 127 |
| hsa0301038 | Oral cavity | LP | Ribosome | 127/2418 | 167/8465 | 1.22e-37 | 4.05e-35 | 2.61e-35 | 127 |
| hsa0301028 | Prostate | BPH | Ribosome | 104/1718 | 167/8465 | 8.04e-33 | 1.33e-30 | 8.21e-31 | 104 |
| hsa03010113 | Prostate | BPH | Ribosome | 104/1718 | 167/8465 | 8.04e-33 | 1.33e-30 | 8.21e-31 | 104 |
| Page: 1 2 |
Top |
Cell-cell communication analysis |
| Identification of potential cell-cell interactions between two cell types and their ligand-receptor pairs for different disease states |
| Ligand | Receptor | LRpair | Pathway | Tissue | Disease Stage |
| Page: 1 |
Top |
Single-cell gene regulatory network inference analysis |
| Find out the significant the regulons (TFs) and the target genes of each regulon across cell types for different disease states |
| TF | Cell Type | Tissue | Disease Stage | Target Gene | RSS | Regulon Activity |
| ∗The dot plots of a searched regulon are shown for all cell subpopulations in each disease state of each tissue based on the regulon specific score inferred using pySCENIC and by calculating the average expression. |
| Page: 1 |
Top |
Somatic mutation of malignant transformation related genes |
| Annotation of somatic variants for genes involved in malignant transformation |
| Hugo Symbol | Variant Class | Variant Classification | dbSNP RS | HGVSc | HGVSp | HGVSp Short | SWISSPROT | BIOTYPE | SIFT | PolyPhen | Tumor Sample Barcode | Tissue | Histology | Sex | Age | Stage | Therapy Types | Drugs | Outcome |
| MRPS15 | SNV | Missense_Mutation | rs370868915 | c.511N>T | p.Arg171Cys | p.R171C | P82914 | protein_coding | deleterious(0.03) | possibly_damaging(0.628) | TCGA-B6-A0RV-01 | Breast | breast invasive carcinoma | Female | <65 | III/IV | Unknown | Unknown | SD |
| MRPS15 | insertion | Frame_Shift_Ins | novel | c.685_686insAAGAA | p.Ala229GlufsTer44 | p.A229Efs*44 | P82914 | protein_coding | TCGA-AN-A0AS-01 | Breast | breast invasive carcinoma | Female | >=65 | III/IV | Unknown | Unknown | SD | ||
| MRPS15 | deletion | Frame_Shift_Del | novel | c.580delC | p.Leu194CysfsTer11 | p.L194Cfs*11 | P82914 | protein_coding | TCGA-EW-A2FV-01 | Breast | breast invasive carcinoma | Female | <65 | III/IV | Chemotherapy | docetaxel | SD | ||
| MRPS15 | SNV | Missense_Mutation | novel | c.452N>T | p.Ala151Val | p.A151V | P82914 | protein_coding | tolerated(0.13) | benign(0.062) | TCGA-AA-3956-01 | Colorectum | colon adenocarcinoma | Male | >=65 | I/II | Unknown | Unknown | SD |
| MRPS15 | SNV | Missense_Mutation | c.188T>C | p.Leu63Pro | p.L63P | P82914 | protein_coding | tolerated(0.11) | benign(0) | TCGA-AA-3977-01 | Colorectum | colon adenocarcinoma | Male | >=65 | I/II | Unknown | Unknown | SD | |
| MRPS15 | SNV | Missense_Mutation | c.613N>G | p.Thr205Ala | p.T205A | P82914 | protein_coding | tolerated(1) | benign(0.001) | TCGA-AD-A5EJ-01 | Colorectum | colon adenocarcinoma | Female | >=65 | I/II | Unknown | Unknown | SD | |
| MRPS15 | SNV | Missense_Mutation | novel | c.163G>C | p.Val55Leu | p.V55L | P82914 | protein_coding | tolerated(0.4) | benign(0) | TCGA-AX-A1CF-01 | Endometrium | uterine corpus endometrioid carcinoma | Female | >=65 | III/IV | Hormone Therapy | tamoxifen | PD |
| MRPS15 | SNV | Missense_Mutation | c.249G>T | p.Glu83Asp | p.E83D | P82914 | protein_coding | tolerated(0.45) | benign(0.001) | TCGA-B5-A0JY-01 | Endometrium | uterine corpus endometrioid carcinoma | Female | <65 | III/IV | Chemotherapy | doxorubicin | SD | |
| MRPS15 | SNV | Missense_Mutation | novel | c.753N>T | p.Lys251Asn | p.K251N | P82914 | protein_coding | deleterious(0) | benign(0) | TCGA-BK-A6W3-01 | Endometrium | uterine corpus endometrioid carcinoma | Female | <65 | I/II | Unknown | Unknown | SD |
| MRPS15 | SNV | Missense_Mutation | rs376585999 | c.398N>G | p.Ser133Cys | p.S133C | P82914 | protein_coding | deleterious(0) | possibly_damaging(0.69) | TCGA-FV-A3I1-01 | Liver | liver hepatocellular carcinoma | Female | >=65 | I/II | Unknown | Unknown | SD |
| Page: 1 2 3 |
Top |
Related drugs of malignant transformation related genes |
| Identification of chemicals and drugs interact with genes involved in malignant transfromation |
| (DGIdb 4.0) |
| Entrez ID | Symbol | Category | Interaction Types | Drug Claim Name | Drug Name | PMIDs |
| Page: 1 |

Copyright 2023-Present -The University of Texas Health Science Center at Houston |