
|
|||||
|
 | |
| |
| |
| |
| |
| |
|
Gene: MRPS14 |
Gene summary for MRPS14 |
| Gene information | Species | Human | Gene symbol | MRPS14 | Gene ID | 63931 |
| Gene name | mitochondrial ribosomal protein S14 | |
| Gene Alias | COXPD38 | |
| Cytomap | 1q25.1 | |
| Gene Type | protein-coding | GO ID | GO:0006412 | UniProtAcc | O60783 |
Top |
Malignant transformation analysis |
| Identification of the aberrant gene expression in precancerous and cancerous lesions by comparing the gene expression of stem-like cells in diseased tissues with normal stem cells |
| Entrez ID | Symbol | Replicates | Species | Organ | Tissue | Adj P-value | Log2FC | Malignancy |
| 63931 | MRPS14 | LZE2T | Human | Esophagus | ESCC | 7.53e-09 | 1.05e+00 | 0.082 |
| 63931 | MRPS14 | LZE4T | Human | Esophagus | ESCC | 1.71e-19 | 3.77e-01 | 0.0811 |
| 63931 | MRPS14 | LZE5T | Human | Esophagus | ESCC | 6.72e-03 | 2.75e-01 | 0.0514 |
| 63931 | MRPS14 | LZE7T | Human | Esophagus | ESCC | 2.01e-07 | 4.22e-01 | 0.0667 |
| 63931 | MRPS14 | LZE8T | Human | Esophagus | ESCC | 1.58e-09 | 4.02e-01 | 0.067 |
| 63931 | MRPS14 | LZE20T | Human | Esophagus | ESCC | 1.29e-12 | 2.86e-01 | 0.0662 |
| 63931 | MRPS14 | LZE22T | Human | Esophagus | ESCC | 2.35e-02 | 4.71e-01 | 0.068 |
| 63931 | MRPS14 | LZE24T | Human | Esophagus | ESCC | 2.91e-24 | 6.56e-01 | 0.0596 |
| 63931 | MRPS14 | LZE6T | Human | Esophagus | ESCC | 2.71e-04 | 2.41e-01 | 0.0845 |
| 63931 | MRPS14 | P1T-E | Human | Esophagus | ESCC | 9.02e-10 | 6.23e-01 | 0.0875 |
| 63931 | MRPS14 | P2T-E | Human | Esophagus | ESCC | 3.94e-39 | 6.64e-01 | 0.1177 |
| 63931 | MRPS14 | P4T-E | Human | Esophagus | ESCC | 1.33e-47 | 1.21e+00 | 0.1323 |
| 63931 | MRPS14 | P5T-E | Human | Esophagus | ESCC | 1.49e-33 | 7.98e-01 | 0.1327 |
| 63931 | MRPS14 | P8T-E | Human | Esophagus | ESCC | 4.21e-19 | 4.47e-01 | 0.0889 |
| 63931 | MRPS14 | P9T-E | Human | Esophagus | ESCC | 4.98e-32 | 8.56e-01 | 0.1131 |
| 63931 | MRPS14 | P10T-E | Human | Esophagus | ESCC | 1.17e-30 | 5.32e-01 | 0.116 |
| 63931 | MRPS14 | P11T-E | Human | Esophagus | ESCC | 2.77e-12 | 6.02e-01 | 0.1426 |
| 63931 | MRPS14 | P12T-E | Human | Esophagus | ESCC | 1.52e-28 | 5.58e-01 | 0.1122 |
| 63931 | MRPS14 | P15T-E | Human | Esophagus | ESCC | 1.53e-45 | 9.97e-01 | 0.1149 |
| 63931 | MRPS14 | P16T-E | Human | Esophagus | ESCC | 1.78e-49 | 8.28e-01 | 0.1153 |
| Page: 1 2 3 4 5 6 |
| Tissue | Expression Dynamics | Abbreviation |
| Esophagus | 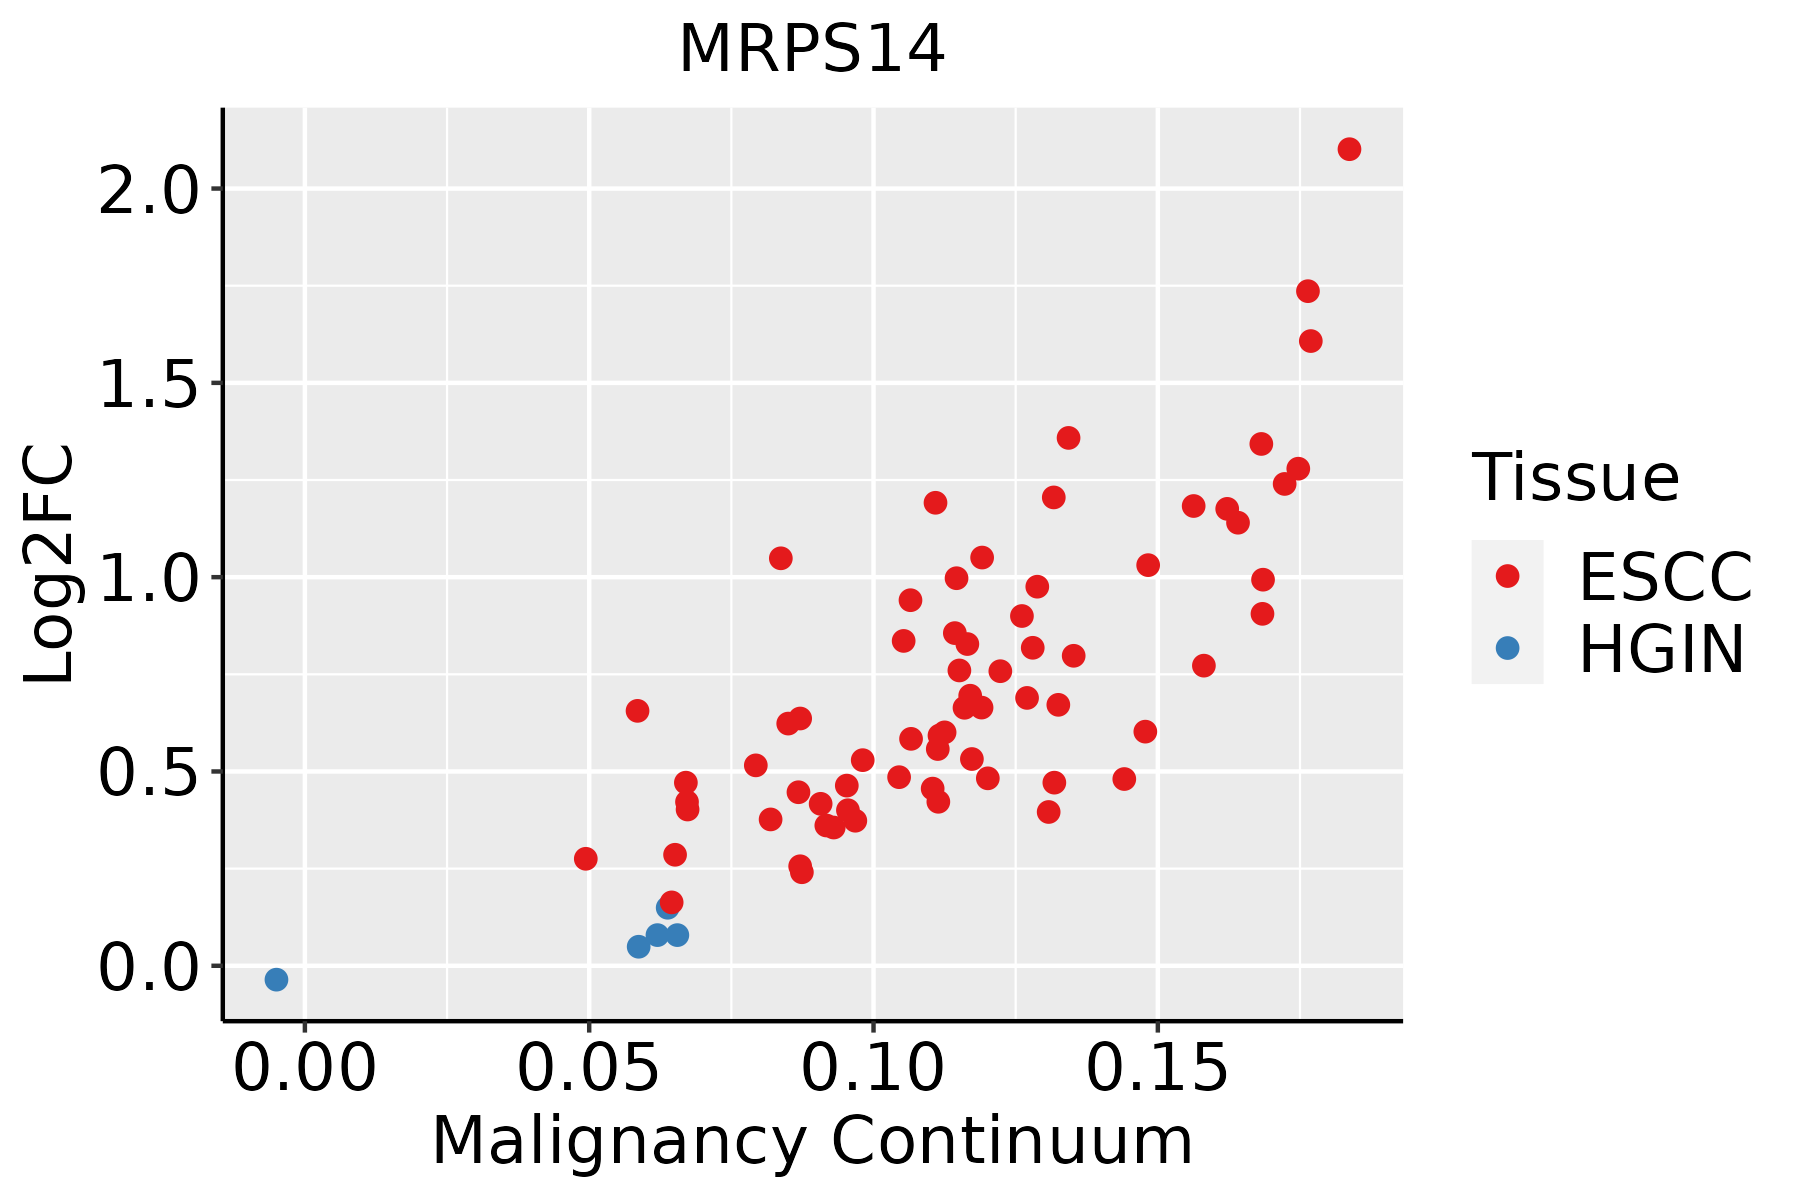 | ESCC: Esophageal squamous cell carcinoma |
| HGIN: High-grade intraepithelial neoplasias | ||
| LGIN: Low-grade intraepithelial neoplasias | ||
| Liver | 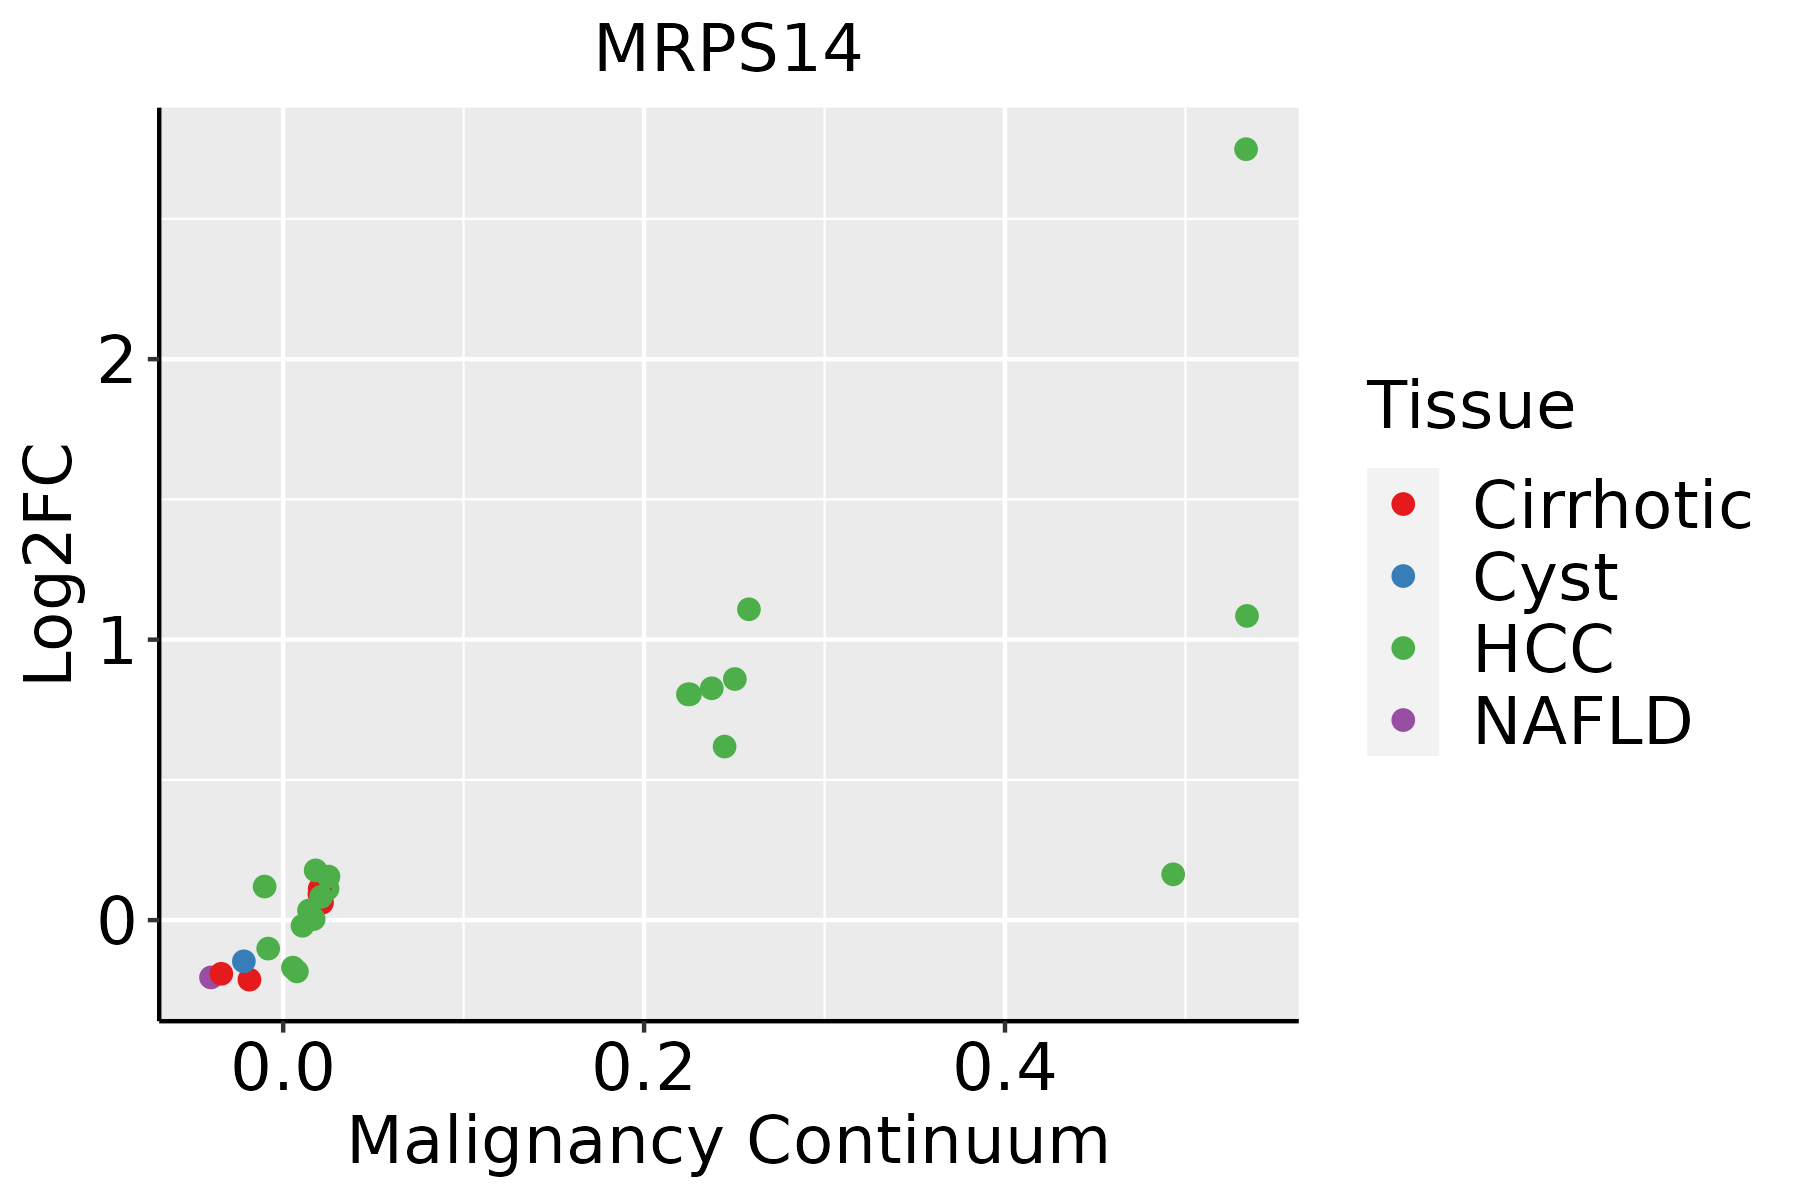 | HCC: Hepatocellular carcinoma |
| NAFLD: Non-alcoholic fatty liver disease | ||
| Oral Cavity |  | EOLP: Erosive Oral lichen planus |
| LP: leukoplakia | ||
| NEOLP: Non-erosive oral lichen planus | ||
| OSCC: Oral squamous cell carcinoma | ||
| Prostate | 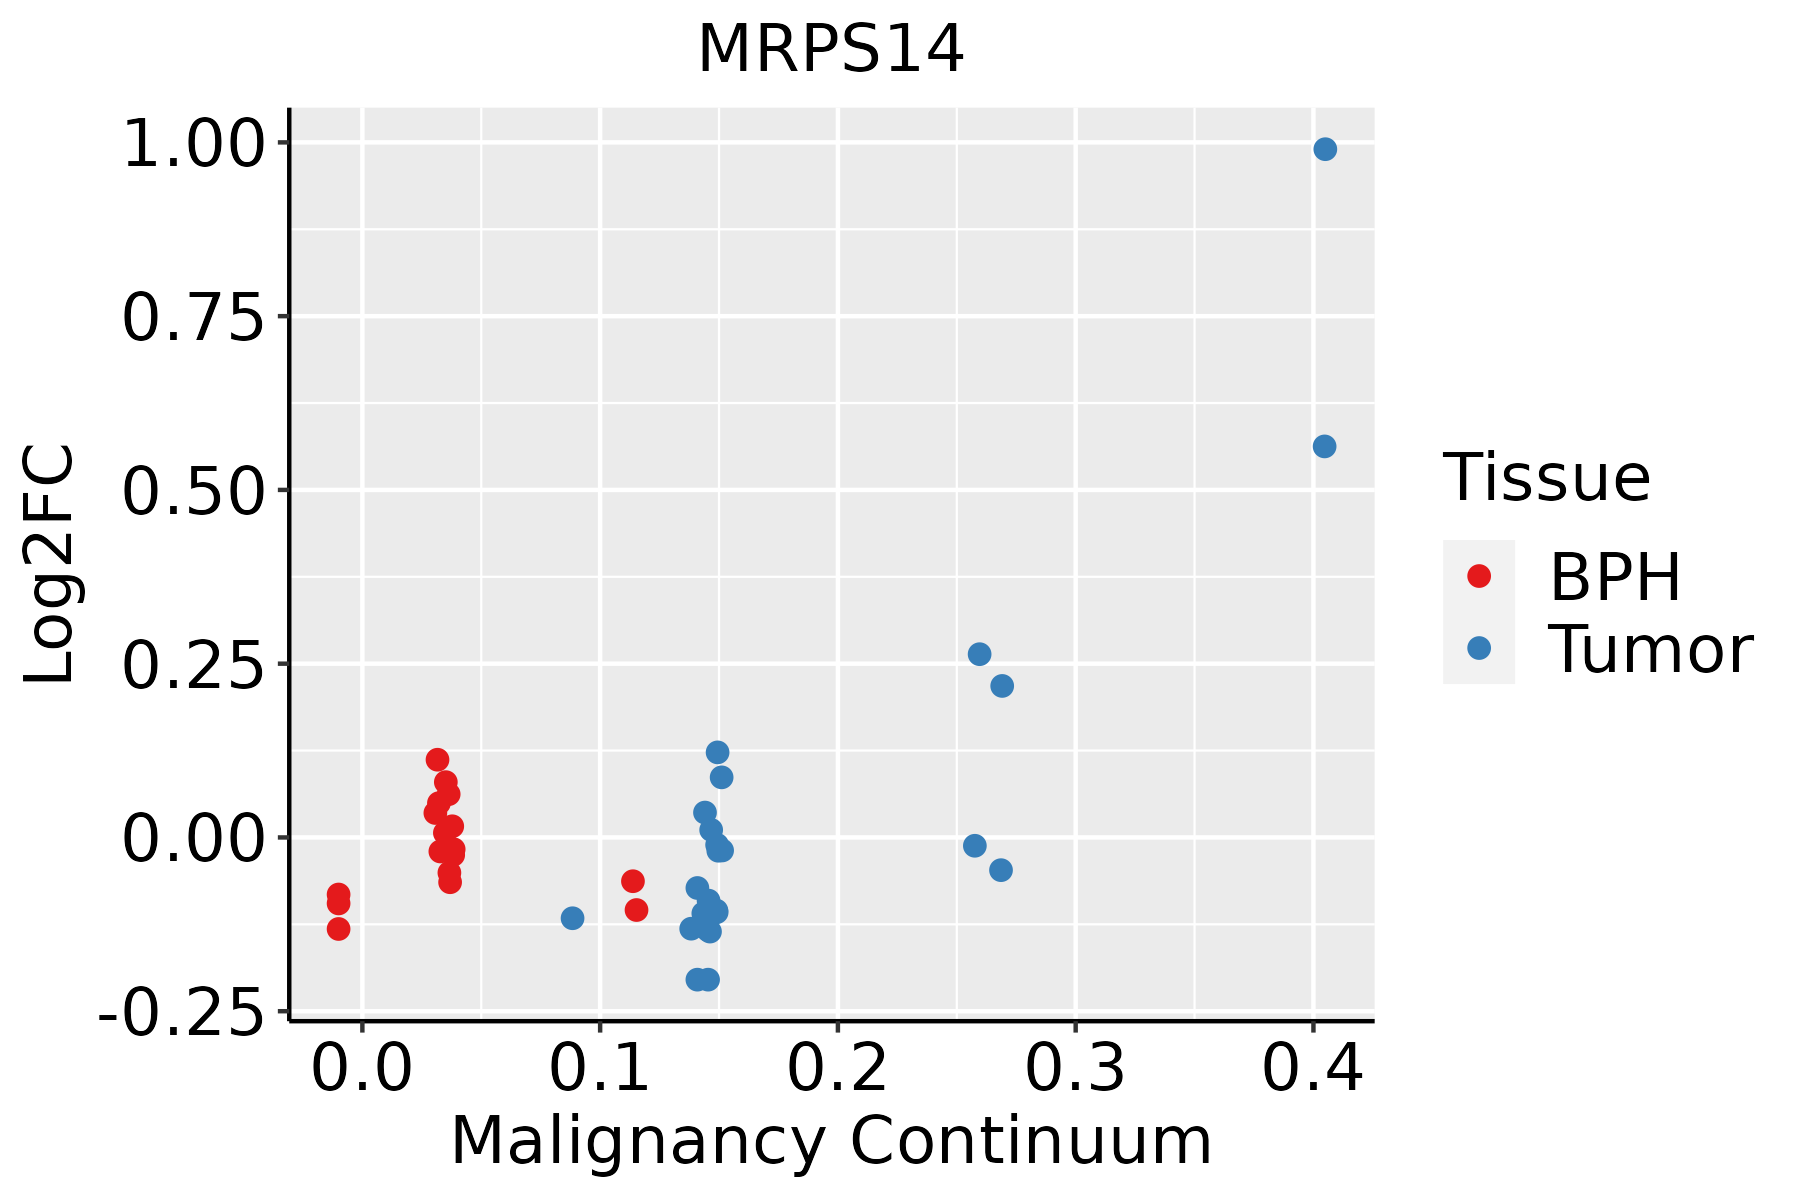 | BPH: Benign Prostatic Hyperplasia |
| Skin |  | AK: Actinic keratosis |
| cSCC: Cutaneous squamous cell carcinoma | ||
| SCCIS:squamous cell carcinoma in situ |
| ∗log2FC in expression of this searched gene in stem-like cells from each diseased tissue sample relative to stem-like cells in normal samples in each tissue plotted against the malignancy continuum. Samples are colored based on if they are from different disease stage. |
Top |
Malignant transformation related pathway analysis |
| Find out the enriched GO biological processes and KEGG pathways involved in transition from healthy to precancer to cancer |
| Tissue | Disease Stage | Enriched GO biological Processes |
| Colorectum | AD |  |
| Colorectum | SER |  |
| Colorectum | MSS |  |
| Colorectum | MSI-H |  |
| Colorectum | FAP |  |
| ∗Top 15 enriched GO BP terms are showed in the bar plot of each disease state in each tissue. Each row represents a significant GO biological process which is colored according to the -log10(p.adjust). |
| Page: 1 2 3 4 5 6 7 8 9 |
| GO ID | Tissue | Disease Stage | Description | Gene Ratio | Bg Ratio | pvalue | p.adjust | Count |
| GO:014005313 | Esophagus | ESCC | mitochondrial gene expression | 93/8552 | 108/18723 | 1.96e-18 | 2.03e-16 | 93 |
| GO:003254314 | Esophagus | ESCC | mitochondrial translation | 68/8552 | 76/18723 | 1.02e-15 | 6.86e-14 | 68 |
| GO:0032543 | Liver | Cirrhotic | mitochondrial translation | 40/4634 | 76/18723 | 1.61e-07 | 4.29e-06 | 40 |
| GO:0140053 | Liver | Cirrhotic | mitochondrial gene expression | 49/4634 | 108/18723 | 2.35e-06 | 4.31e-05 | 49 |
| GO:01400531 | Liver | HCC | mitochondrial gene expression | 82/7958 | 108/18723 | 1.49e-12 | 7.20e-11 | 82 |
| GO:00325431 | Liver | HCC | mitochondrial translation | 62/7958 | 76/18723 | 2.95e-12 | 1.34e-10 | 62 |
| GO:01400533 | Oral cavity | OSCC | mitochondrial gene expression | 78/7305 | 108/18723 | 2.37e-12 | 9.86e-11 | 78 |
| GO:00325434 | Oral cavity | OSCC | mitochondrial translation | 59/7305 | 76/18723 | 7.21e-12 | 2.70e-10 | 59 |
| GO:003254313 | Oral cavity | LP | mitochondrial translation | 43/4623 | 76/18723 | 2.85e-09 | 1.26e-07 | 43 |
| GO:014005312 | Oral cavity | LP | mitochondrial gene expression | 53/4623 | 108/18723 | 3.54e-08 | 1.27e-06 | 53 |
| GO:00325433 | Prostate | BPH | mitochondrial translation | 23/3107 | 76/18723 | 2.21e-03 | 1.22e-02 | 23 |
| GO:01400532 | Prostate | BPH | mitochondrial gene expression | 29/3107 | 108/18723 | 4.68e-03 | 2.25e-02 | 29 |
| GO:003254312 | Prostate | Tumor | mitochondrial translation | 24/3246 | 76/18723 | 1.73e-03 | 1.03e-02 | 24 |
| GO:014005311 | Prostate | Tumor | mitochondrial gene expression | 31/3246 | 108/18723 | 2.31e-03 | 1.30e-02 | 31 |
| GO:00325436 | Skin | cSCC | mitochondrial translation | 47/4864 | 76/18723 | 4.70e-11 | 2.22e-09 | 47 |
| GO:01400535 | Skin | cSCC | mitochondrial gene expression | 56/4864 | 108/18723 | 8.06e-09 | 2.56e-07 | 56 |
| Page: 1 |
| Pathway ID | Tissue | Disease Stage | Description | Gene Ratio | Bg Ratio | pvalue | p.adjust | qvalue | Count |
| hsa03010211 | Esophagus | ESCC | Ribosome | 129/4205 | 167/8465 | 1.43e-13 | 3.43e-12 | 1.75e-12 | 129 |
| hsa03010310 | Esophagus | ESCC | Ribosome | 129/4205 | 167/8465 | 1.43e-13 | 3.43e-12 | 1.75e-12 | 129 |
| hsa0301022 | Liver | Cirrhotic | Ribosome | 127/2530 | 167/8465 | 2.12e-35 | 7.06e-33 | 4.35e-33 | 127 |
| hsa0301032 | Liver | Cirrhotic | Ribosome | 127/2530 | 167/8465 | 2.12e-35 | 7.06e-33 | 4.35e-33 | 127 |
| hsa0301042 | Liver | HCC | Ribosome | 128/4020 | 167/8465 | 7.32e-15 | 2.23e-13 | 1.24e-13 | 128 |
| hsa0301052 | Liver | HCC | Ribosome | 128/4020 | 167/8465 | 7.32e-15 | 2.23e-13 | 1.24e-13 | 128 |
| hsa0301030 | Oral cavity | OSCC | Ribosome | 128/3704 | 167/8465 | 2.42e-18 | 1.62e-16 | 8.25e-17 | 128 |
| hsa03010114 | Oral cavity | OSCC | Ribosome | 128/3704 | 167/8465 | 2.42e-18 | 1.62e-16 | 8.25e-17 | 128 |
| hsa03010210 | Oral cavity | LP | Ribosome | 127/2418 | 167/8465 | 1.22e-37 | 4.05e-35 | 2.61e-35 | 127 |
| hsa0301038 | Oral cavity | LP | Ribosome | 127/2418 | 167/8465 | 1.22e-37 | 4.05e-35 | 2.61e-35 | 127 |
| hsa0301028 | Prostate | BPH | Ribosome | 104/1718 | 167/8465 | 8.04e-33 | 1.33e-30 | 8.21e-31 | 104 |
| hsa03010113 | Prostate | BPH | Ribosome | 104/1718 | 167/8465 | 8.04e-33 | 1.33e-30 | 8.21e-31 | 104 |
| hsa0301029 | Prostate | Tumor | Ribosome | 104/1791 | 167/8465 | 3.53e-31 | 5.84e-29 | 3.62e-29 | 104 |
| hsa0301037 | Prostate | Tumor | Ribosome | 104/1791 | 167/8465 | 3.53e-31 | 5.84e-29 | 3.62e-29 | 104 |
| Page: 1 |
Top |
Cell-cell communication analysis |
| Identification of potential cell-cell interactions between two cell types and their ligand-receptor pairs for different disease states |
| Ligand | Receptor | LRpair | Pathway | Tissue | Disease Stage |
| Page: 1 |
Top |
Single-cell gene regulatory network inference analysis |
| Find out the significant the regulons (TFs) and the target genes of each regulon across cell types for different disease states |
| TF | Cell Type | Tissue | Disease Stage | Target Gene | RSS | Regulon Activity |
| ∗The dot plots of a searched regulon are shown for all cell subpopulations in each disease state of each tissue based on the regulon specific score inferred using pySCENIC and by calculating the average expression. |
| Page: 1 |
Top |
Somatic mutation of malignant transformation related genes |
| Annotation of somatic variants for genes involved in malignant transformation |
| Hugo Symbol | Variant Class | Variant Classification | dbSNP RS | HGVSc | HGVSp | HGVSp Short | SWISSPROT | BIOTYPE | SIFT | PolyPhen | Tumor Sample Barcode | Tissue | Histology | Sex | Age | Stage | Therapy Types | Drugs | Outcome |
| MRPS14 | SNV | Missense_Mutation | rs764040620 | c.56C>T | p.Ser19Leu | p.S19L | O60783 | protein_coding | tolerated(0.37) | benign(0) | TCGA-AC-A23H-01 | Breast | breast invasive carcinoma | Female | >=65 | I/II | Unknown | Unknown | PD |
| MRPS14 | SNV | Missense_Mutation | rs749100830 | c.304N>T | p.Arg102Trp | p.R102W | O60783 | protein_coding | tolerated(0.1) | benign(0.035) | TCGA-C8-A12P-01 | Breast | breast invasive carcinoma | Female | <65 | I/II | Unknown | Unknown | SD |
| MRPS14 | SNV | Missense_Mutation | c.199N>T | p.Leu67Phe | p.L67F | O60783 | protein_coding | tolerated(0.05) | benign(0.321) | TCGA-EK-A3GK-01 | Cervix | cervical & endocervical cancer | Female | <65 | I/II | Unknown | Unknown | SD | |
| MRPS14 | SNV | Missense_Mutation | c.116A>C | p.Lys39Thr | p.K39T | O60783 | protein_coding | deleterious(0) | probably_damaging(0.992) | TCGA-AA-3977-01 | Colorectum | colon adenocarcinoma | Male | >=65 | I/II | Unknown | Unknown | SD | |
| MRPS14 | SNV | Missense_Mutation | c.181N>G | p.Thr61Ala | p.T61A | O60783 | protein_coding | tolerated(0.14) | benign(0.04) | TCGA-EI-6882-01 | Colorectum | rectum adenocarcinoma | Male | <65 | I/II | Unknown | Unknown | SD | |
| MRPS14 | SNV | Missense_Mutation | rs781298771 | c.157N>T | p.Arg53Cys | p.R53C | O60783 | protein_coding | deleterious(0) | probably_damaging(0.957) | TCGA-A5-A2K5-01 | Endometrium | uterine corpus endometrioid carcinoma | Female | >=65 | I/II | Unknown | Unknown | SD |
| MRPS14 | SNV | Missense_Mutation | rs139531485 | c.142N>A | p.Ala48Thr | p.A48T | O60783 | protein_coding | deleterious(0.02) | probably_damaging(0.97) | TCGA-AJ-A3BG-01 | Endometrium | uterine corpus endometrioid carcinoma | Female | >=65 | I/II | Chemotherapy | carboplatin | PD |
| MRPS14 | SNV | Missense_Mutation | rs750064013 | c.308N>A | p.Arg103His | p.R103H | O60783 | protein_coding | deleterious(0.01) | probably_damaging(0.973) | TCGA-AP-A0LM-01 | Endometrium | uterine corpus endometrioid carcinoma | Female | <65 | III/IV | Chemotherapy | cisplatin | SD |
| MRPS14 | SNV | Missense_Mutation | rs752490303 | c.77N>A | p.Arg26Gln | p.R26Q | O60783 | protein_coding | deleterious(0) | possibly_damaging(0.888) | TCGA-AP-A0LM-01 | Endometrium | uterine corpus endometrioid carcinoma | Female | <65 | III/IV | Chemotherapy | cisplatin | SD |
| MRPS14 | SNV | Missense_Mutation | c.334N>T | p.Arg112Cys | p.R112C | O60783 | protein_coding | deleterious(0.02) | possibly_damaging(0.874) | TCGA-AX-A0J1-01 | Endometrium | uterine corpus endometrioid carcinoma | Female | >=65 | I/II | Unknown | Unknown | SD |
| Page: 1 2 |
Top |
Related drugs of malignant transformation related genes |
| Identification of chemicals and drugs interact with genes involved in malignant transfromation |
| (DGIdb 4.0) |
| Entrez ID | Symbol | Category | Interaction Types | Drug Claim Name | Drug Name | PMIDs |
| Page: 1 |

Copyright 2023-Present -The University of Texas Health Science Center at Houston |