
|
|||||
|
 | |
| |
| |
| |
| |
| |
|
Gene: MRPL54 |
Gene summary for MRPL54 |
| Gene information | Species | Human | Gene symbol | MRPL54 | Gene ID | 116541 |
| Gene name | mitochondrial ribosomal protein L54 | |
| Gene Alias | L54mt | |
| Cytomap | 19p13.3 | |
| Gene Type | protein-coding | GO ID | GO:0000313 | UniProtAcc | Q6P161 |
Top |
Malignant transformation analysis |
| Identification of the aberrant gene expression in precancerous and cancerous lesions by comparing the gene expression of stem-like cells in diseased tissues with normal stem cells |
| Entrez ID | Symbol | Replicates | Species | Organ | Tissue | Adj P-value | Log2FC | Malignancy |
| 116541 | MRPL54 | CA_HPV_1 | Human | Cervix | CC | 4.87e-06 | -2.30e-01 | 0.0264 |
| 116541 | MRPL54 | N_HPV_1 | Human | Cervix | N_HPV | 4.17e-03 | -1.73e-01 | 0.0079 |
| 116541 | MRPL54 | CCI_1 | Human | Cervix | CC | 3.85e-08 | -5.65e-01 | 0.528 |
| 116541 | MRPL54 | CCI_3 | Human | Cervix | CC | 3.69e-07 | -5.33e-01 | 0.516 |
| 116541 | MRPL54 | CCII_1 | Human | Cervix | CC | 8.50e-13 | -5.53e-01 | 0.3249 |
| 116541 | MRPL54 | L1 | Human | Cervix | CC | 1.15e-06 | -3.82e-01 | 0.0802 |
| 116541 | MRPL54 | LZE2T | Human | Esophagus | ESCC | 3.63e-03 | 2.59e-01 | 0.082 |
| 116541 | MRPL54 | LZE4T | Human | Esophagus | ESCC | 5.54e-10 | 3.82e-01 | 0.0811 |
| 116541 | MRPL54 | LZE5T | Human | Esophagus | ESCC | 2.81e-06 | 7.10e-01 | 0.0514 |
| 116541 | MRPL54 | LZE7T | Human | Esophagus | ESCC | 6.54e-11 | 5.43e-01 | 0.0667 |
| 116541 | MRPL54 | LZE8T | Human | Esophagus | ESCC | 1.88e-12 | 5.34e-01 | 0.067 |
| 116541 | MRPL54 | LZE20T | Human | Esophagus | ESCC | 5.05e-07 | 4.10e-01 | 0.0662 |
| 116541 | MRPL54 | LZE22D1 | Human | Esophagus | HGIN | 1.50e-06 | 1.86e-01 | 0.0595 |
| 116541 | MRPL54 | LZE22T | Human | Esophagus | ESCC | 2.92e-03 | 2.35e-01 | 0.068 |
| 116541 | MRPL54 | LZE24T | Human | Esophagus | ESCC | 9.90e-22 | 6.97e-01 | 0.0596 |
| 116541 | MRPL54 | LZE6T | Human | Esophagus | ESCC | 8.07e-14 | 6.01e-01 | 0.0845 |
| 116541 | MRPL54 | P1T-E | Human | Esophagus | ESCC | 8.07e-12 | 8.60e-01 | 0.0875 |
| 116541 | MRPL54 | P2T-E | Human | Esophagus | ESCC | 8.35e-26 | 4.29e-01 | 0.1177 |
| 116541 | MRPL54 | P4T-E | Human | Esophagus | ESCC | 2.10e-40 | 1.06e+00 | 0.1323 |
| 116541 | MRPL54 | P5T-E | Human | Esophagus | ESCC | 2.11e-30 | 5.08e-01 | 0.1327 |
| Page: 1 2 3 4 5 6 7 8 9 |
| Tissue | Expression Dynamics | Abbreviation |
| Cervix | 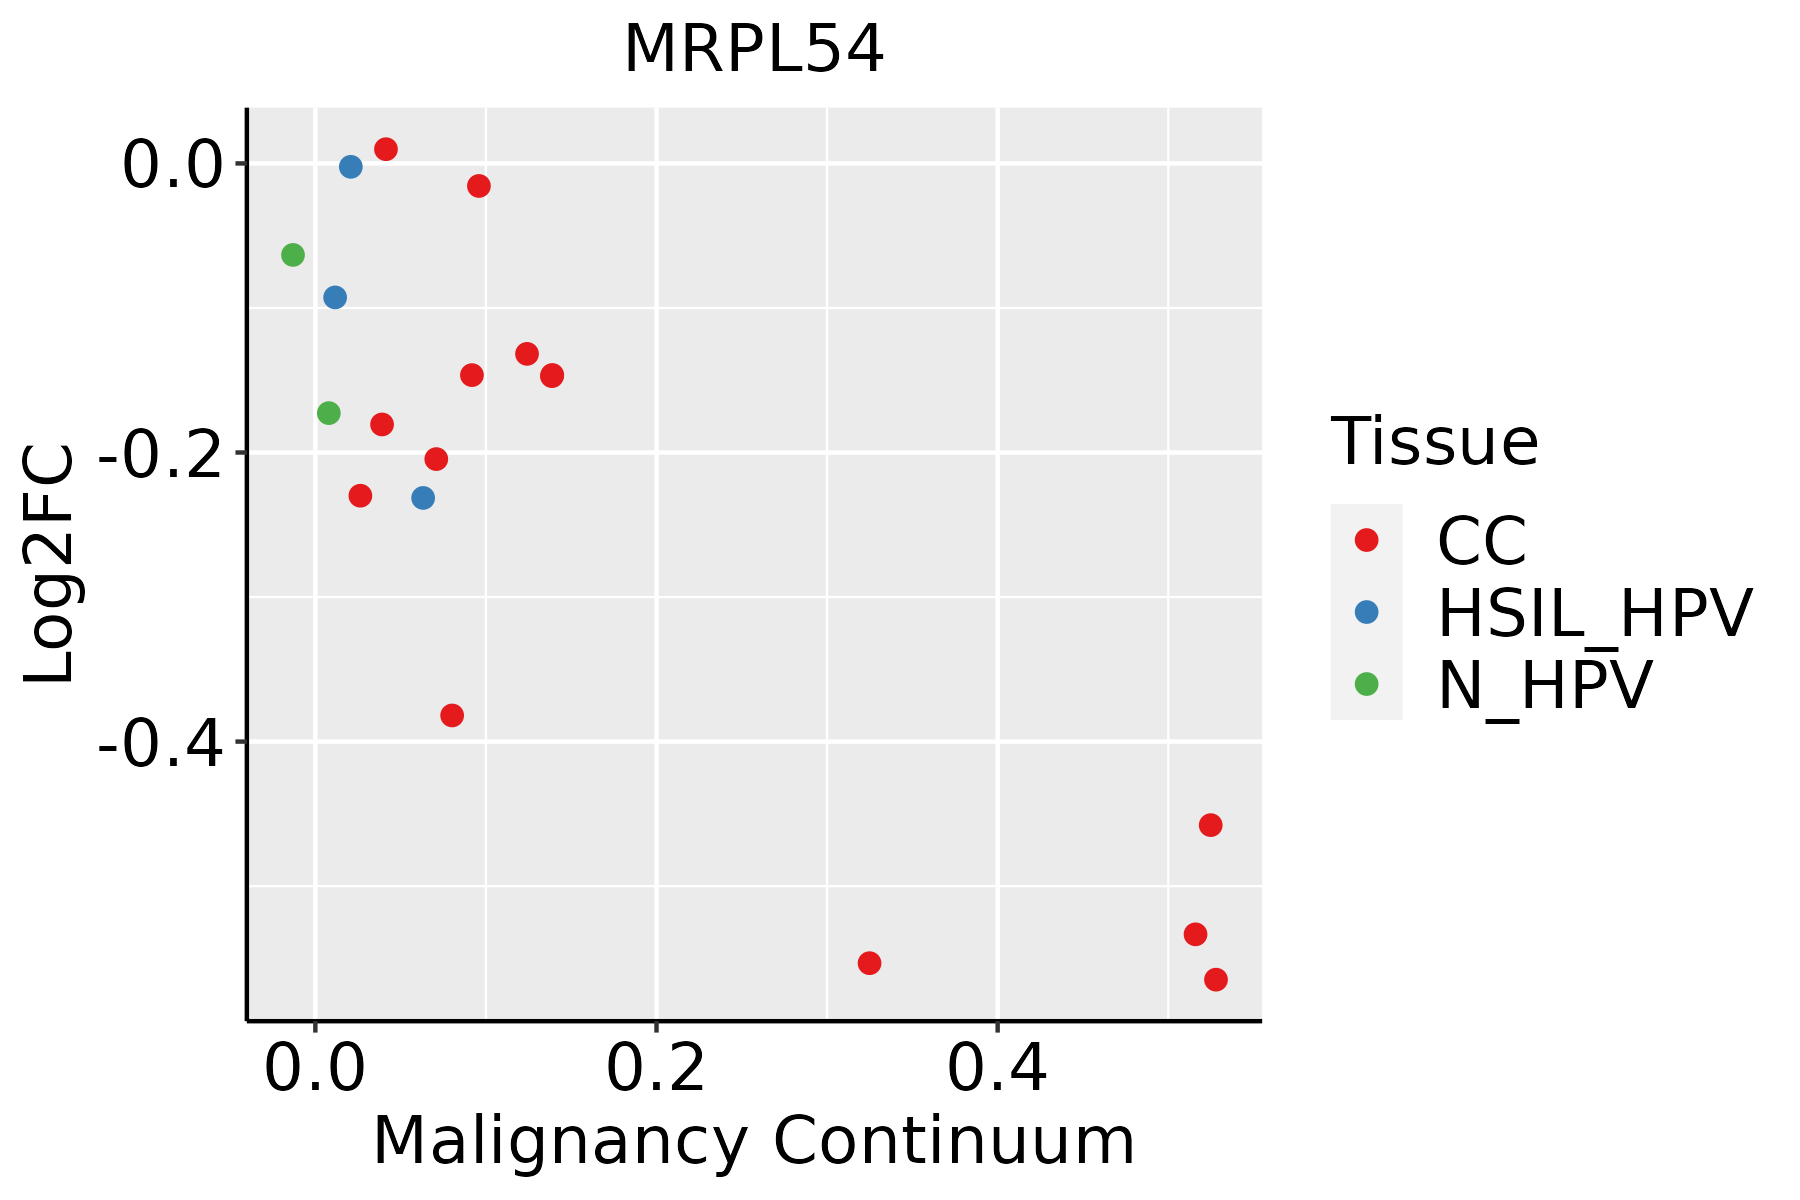 | CC: Cervix cancer |
| HSIL_HPV: HPV-infected high-grade squamous intraepithelial lesions | ||
| N_HPV: HPV-infected normal cervix | ||
| Esophagus | 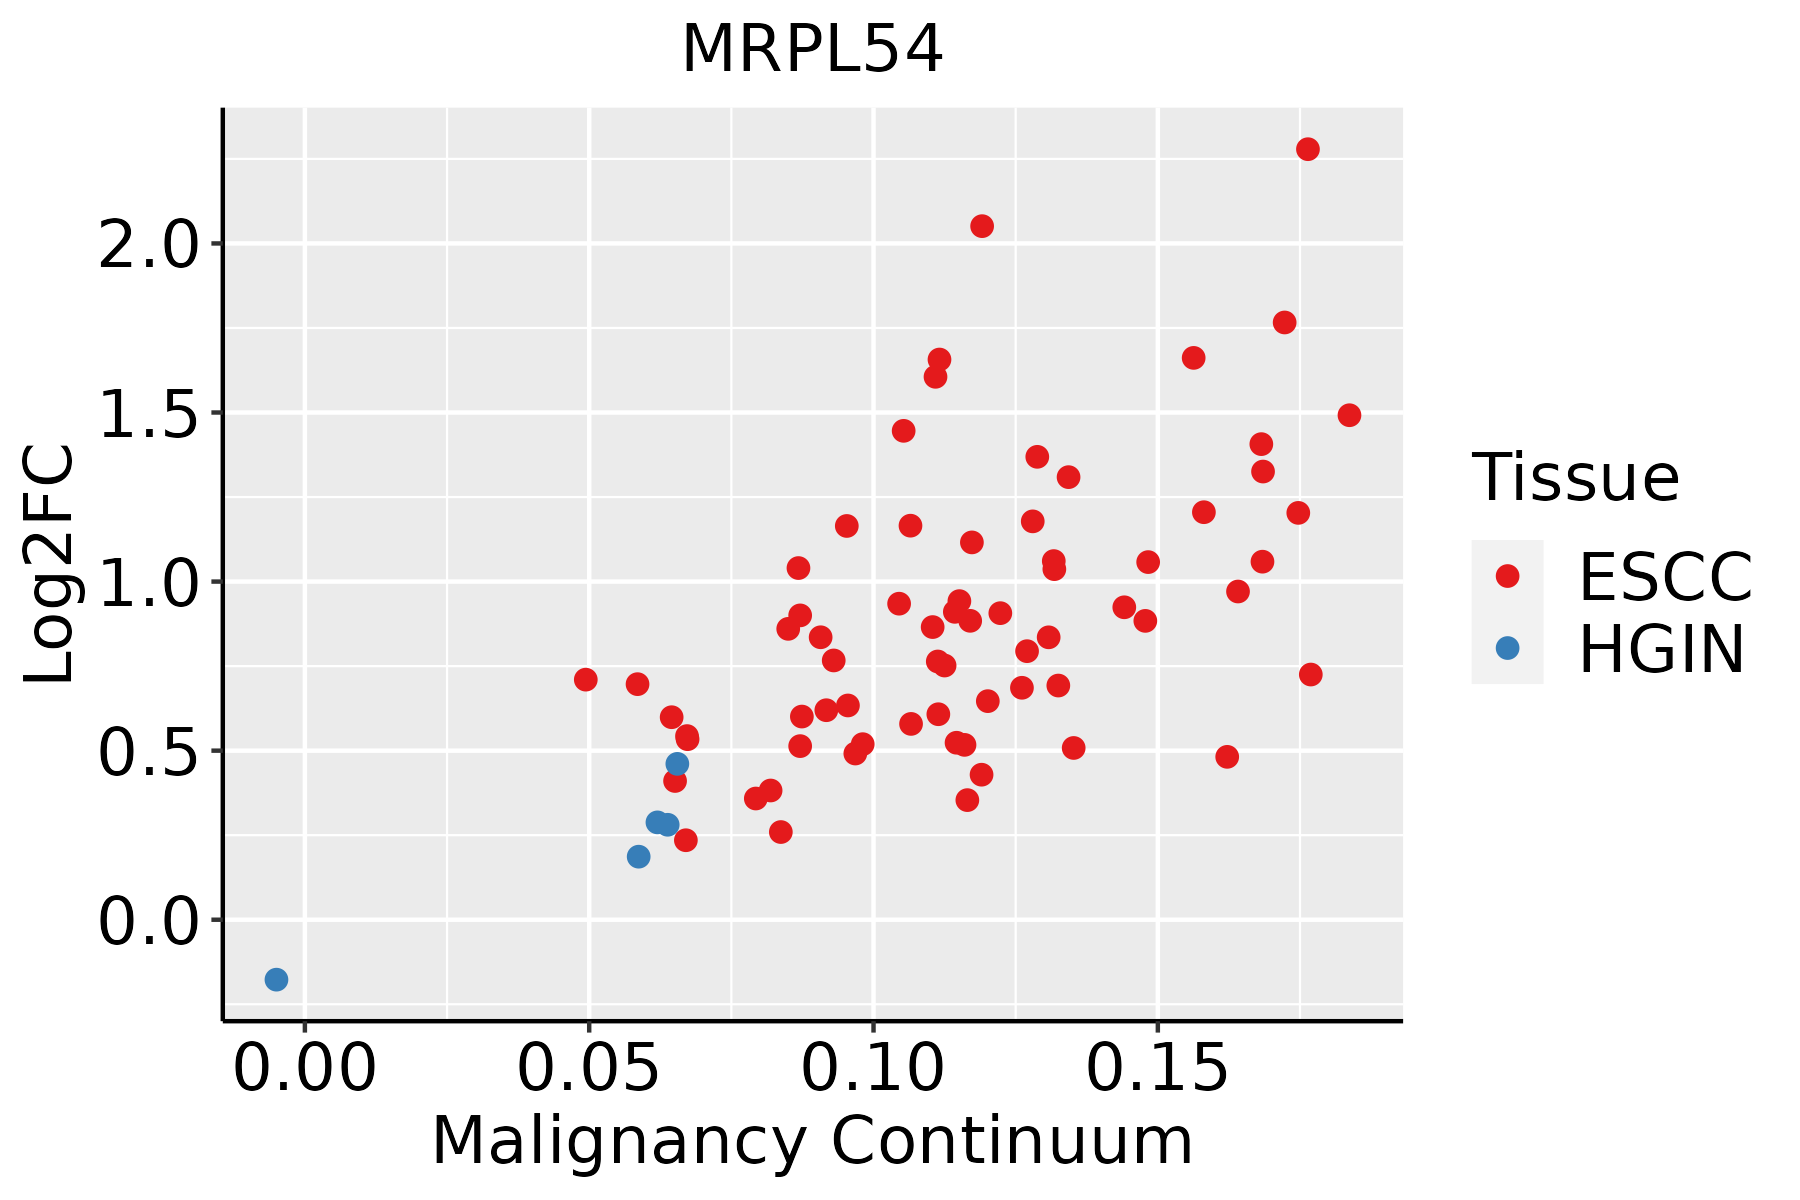 | ESCC: Esophageal squamous cell carcinoma |
| HGIN: High-grade intraepithelial neoplasias | ||
| LGIN: Low-grade intraepithelial neoplasias | ||
| GC | 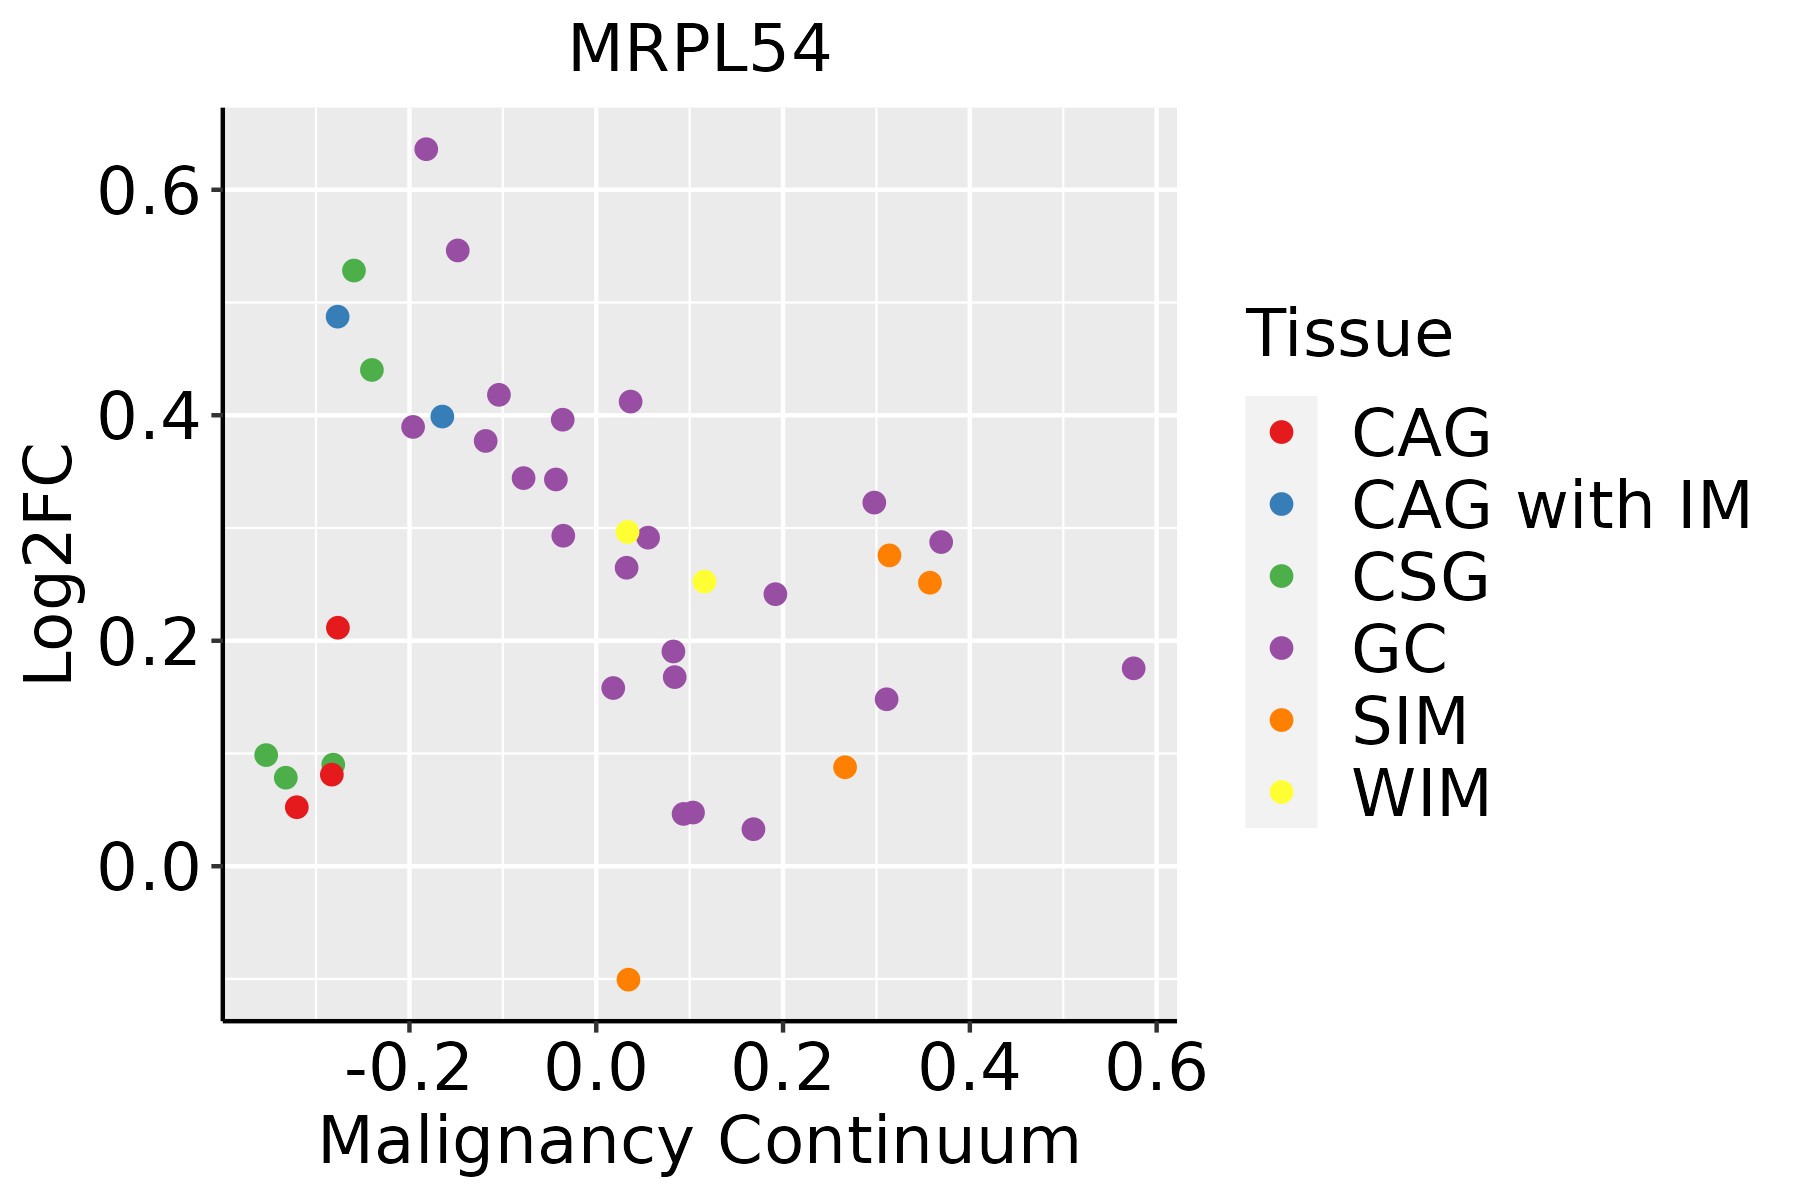 | CAG: Chronic atrophic gastritis |
| CAG with IM: Chronic atrophic gastritis with intestinal metaplasia | ||
| CSG: Chronic superficial gastritis | ||
| GC: Gastric cancer | ||
| SIM: Severe intestinal metaplasia | ||
| WIM: Wild intestinal metaplasia | ||
| Liver | 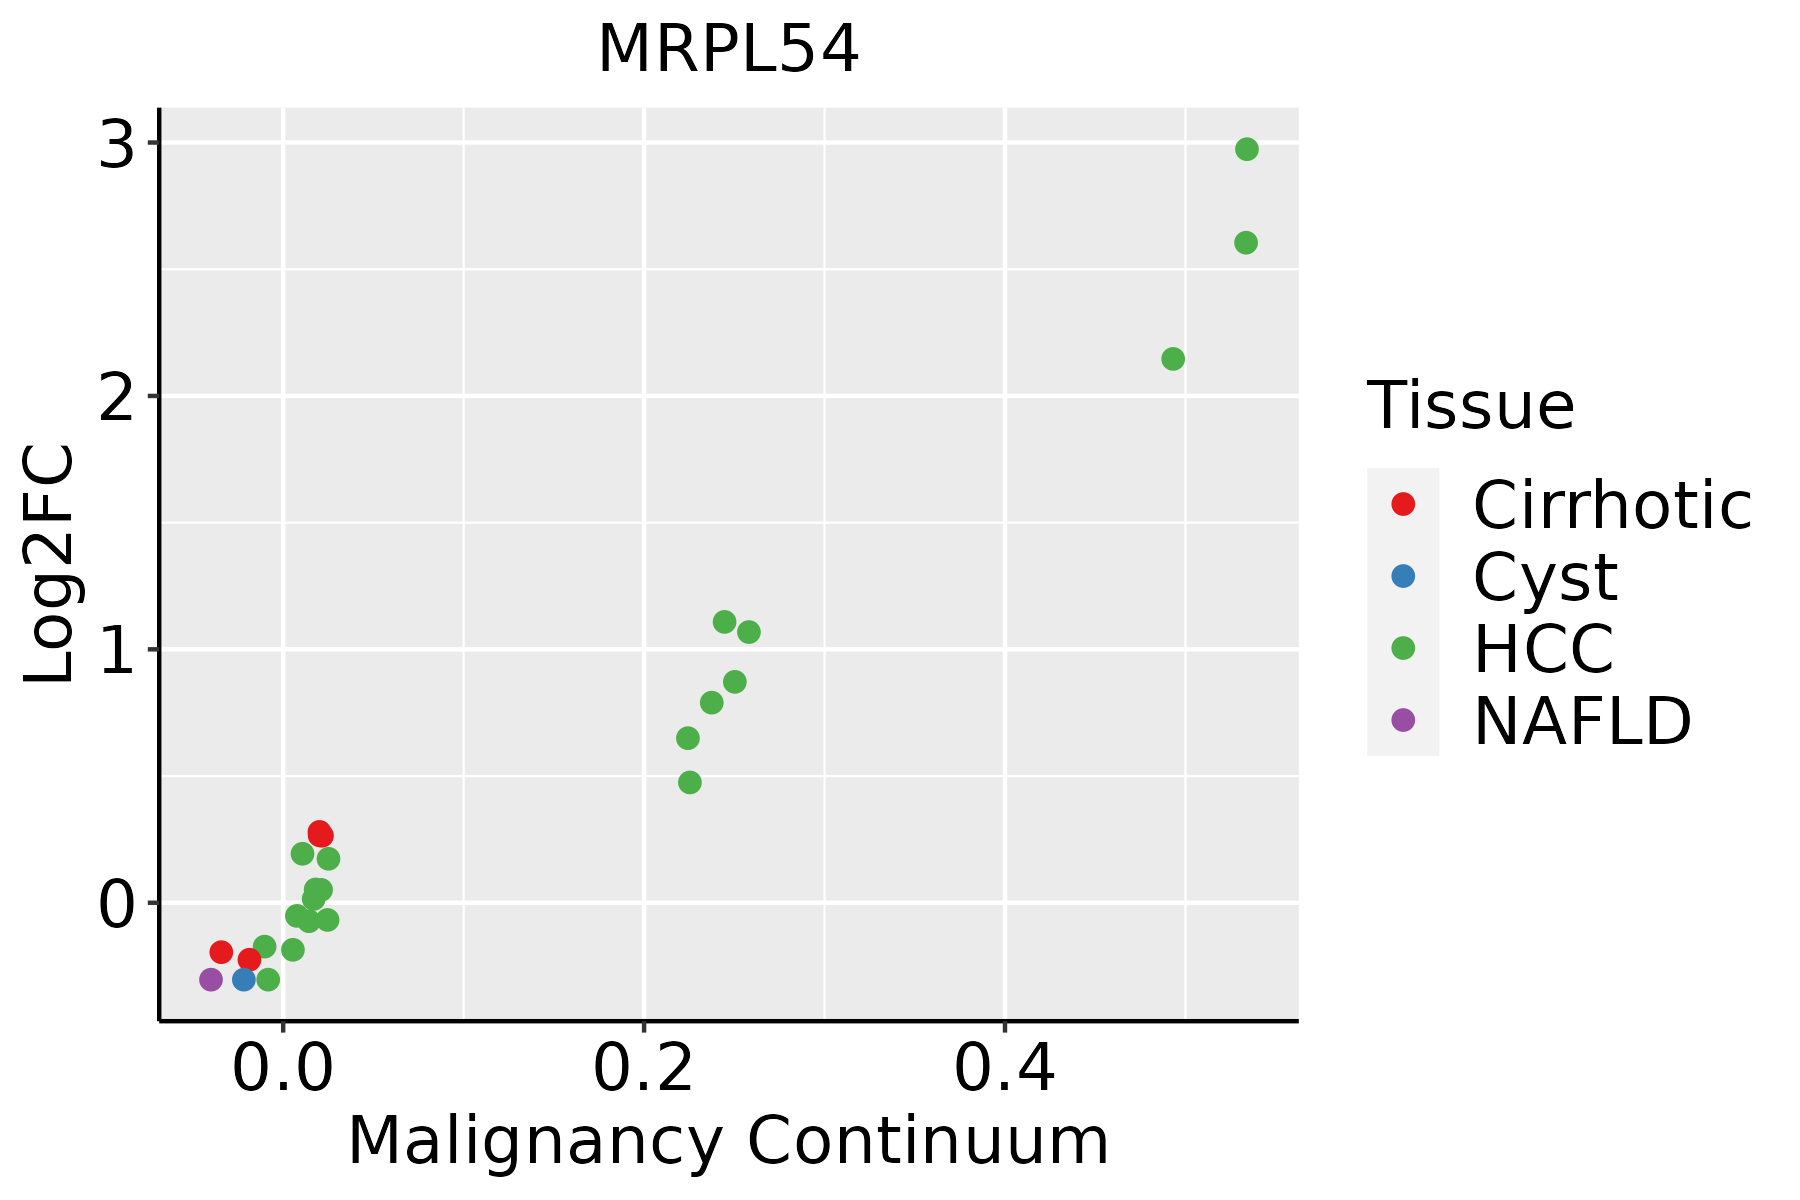 | HCC: Hepatocellular carcinoma |
| NAFLD: Non-alcoholic fatty liver disease | ||
| Oral Cavity | 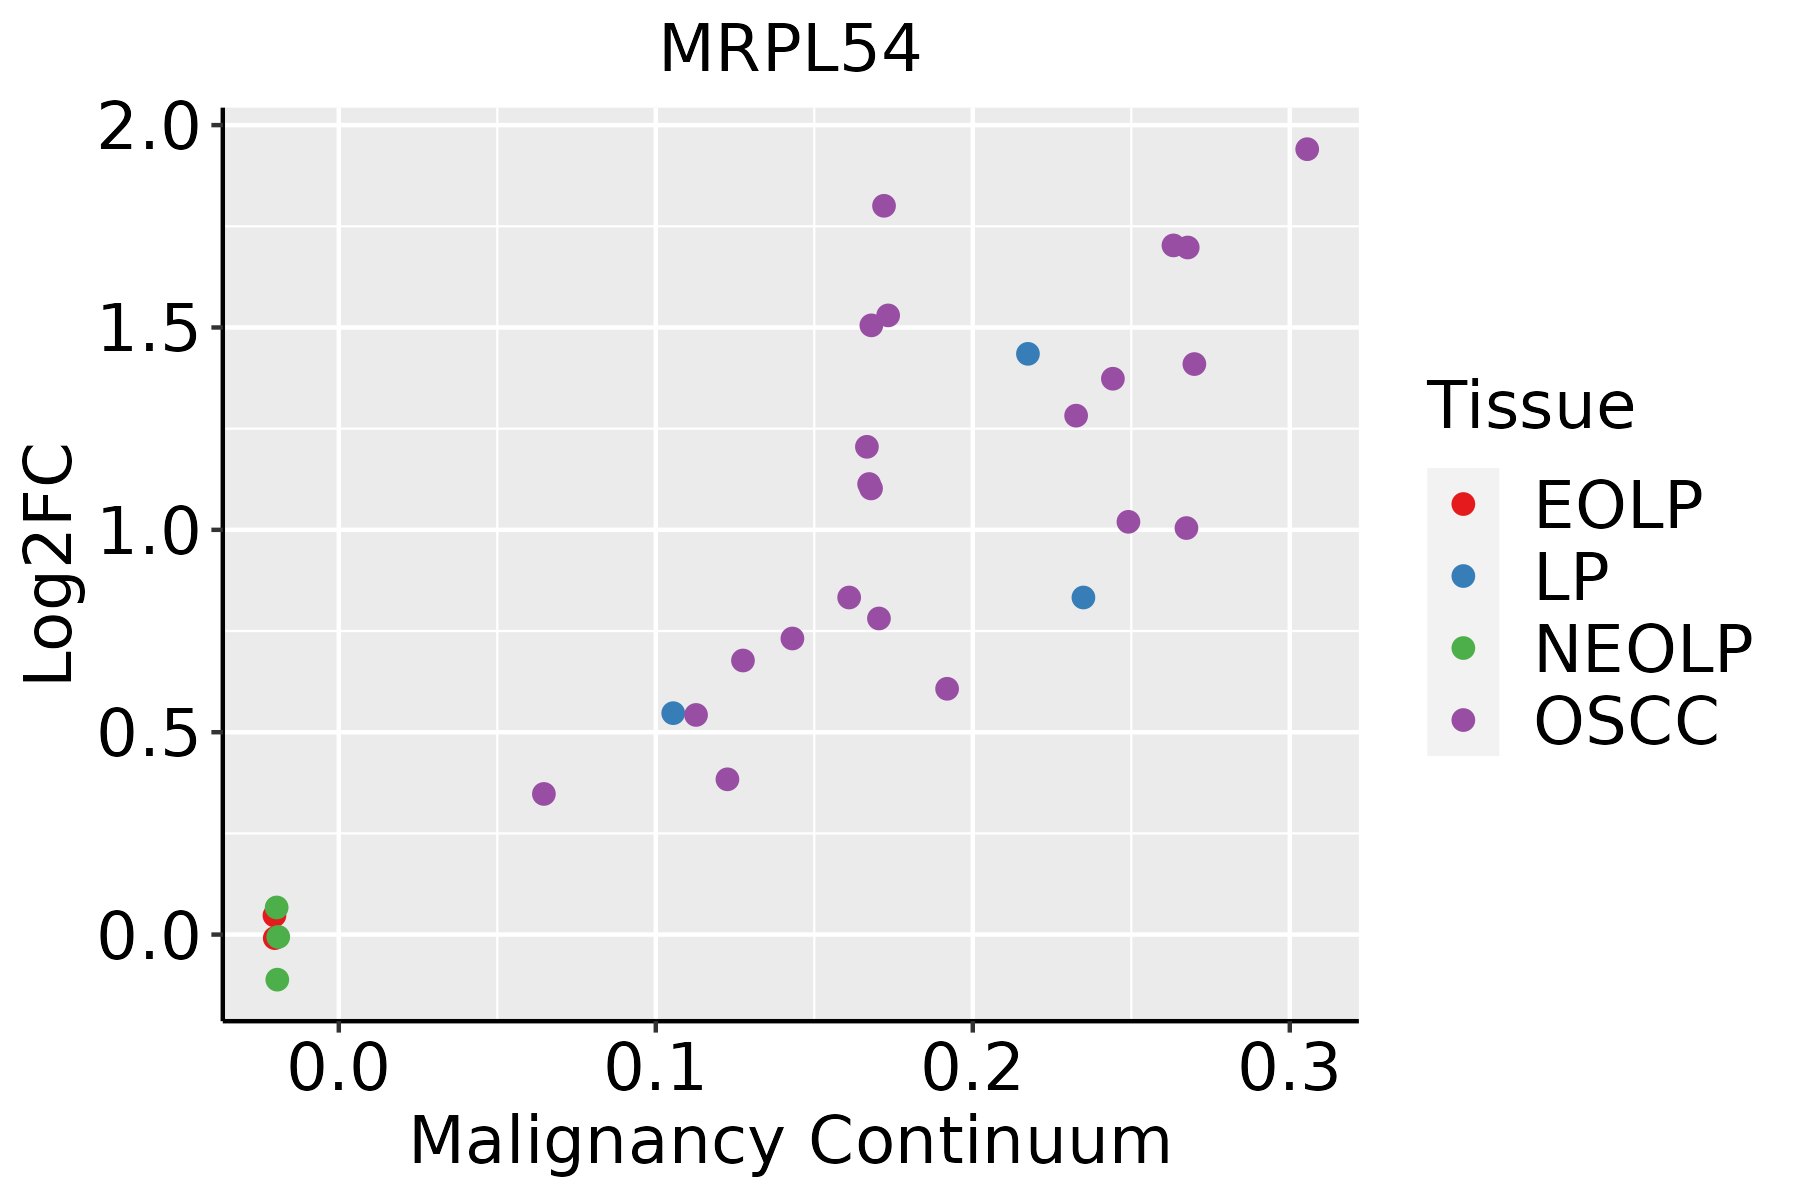 | EOLP: Erosive Oral lichen planus |
| LP: leukoplakia | ||
| NEOLP: Non-erosive oral lichen planus | ||
| OSCC: Oral squamous cell carcinoma | ||
| Prostate | 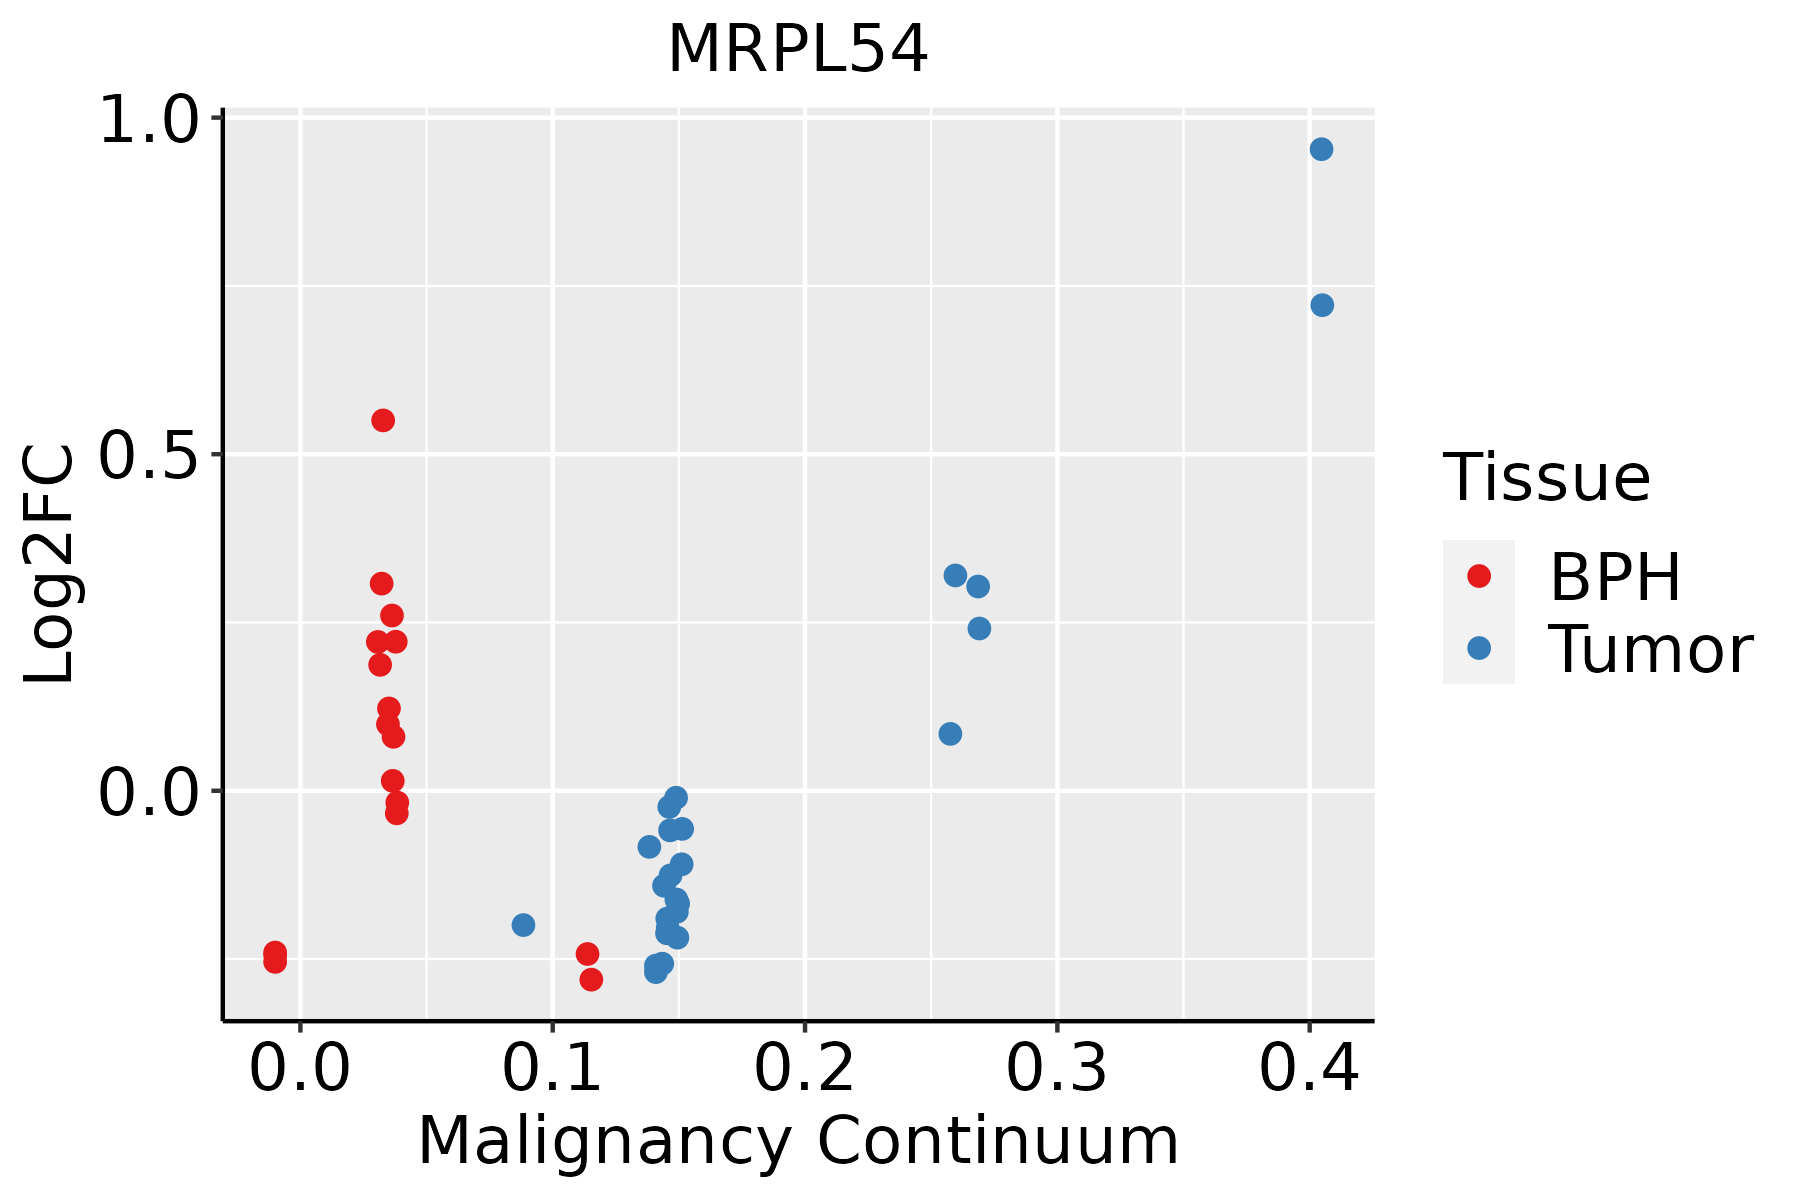 | BPH: Benign Prostatic Hyperplasia |
| Skin | 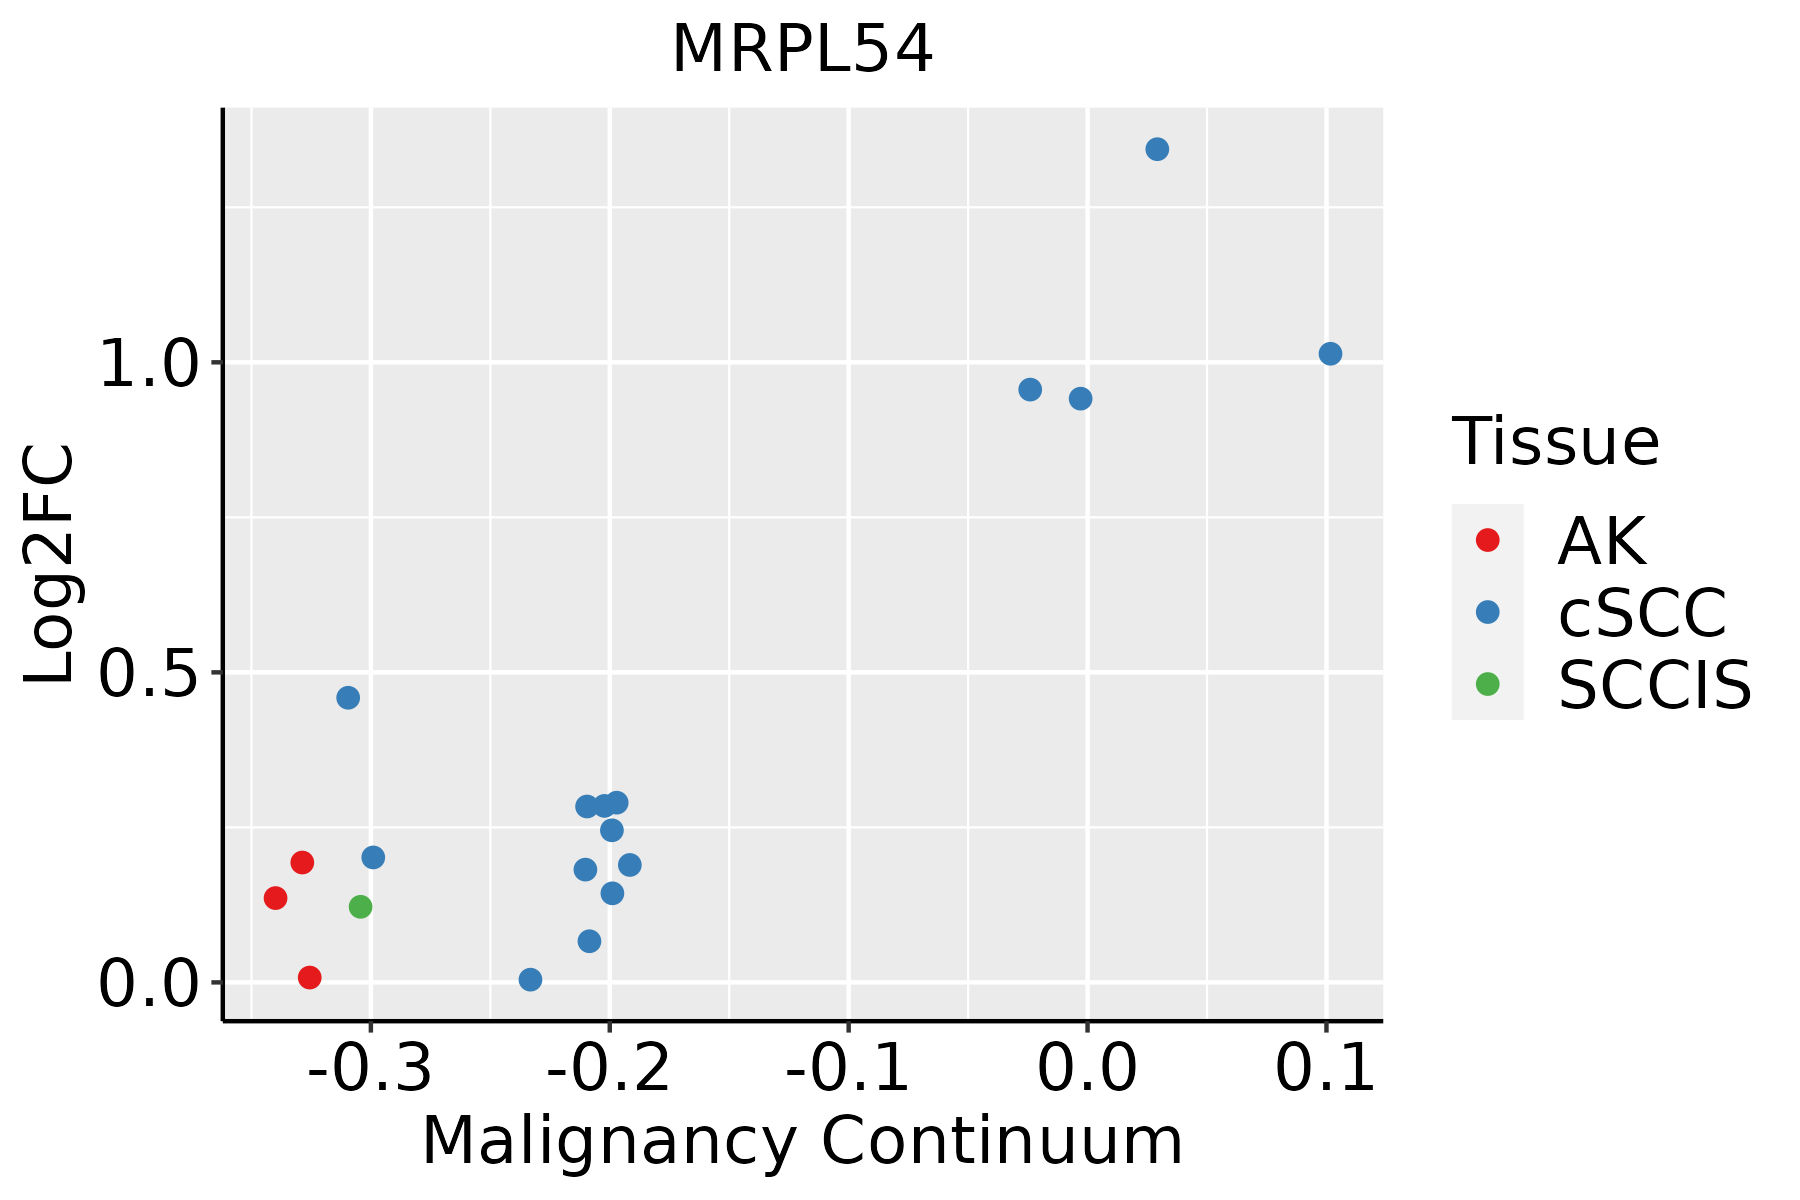 | AK: Actinic keratosis |
| cSCC: Cutaneous squamous cell carcinoma | ||
| SCCIS:squamous cell carcinoma in situ | ||
| Thyroid | 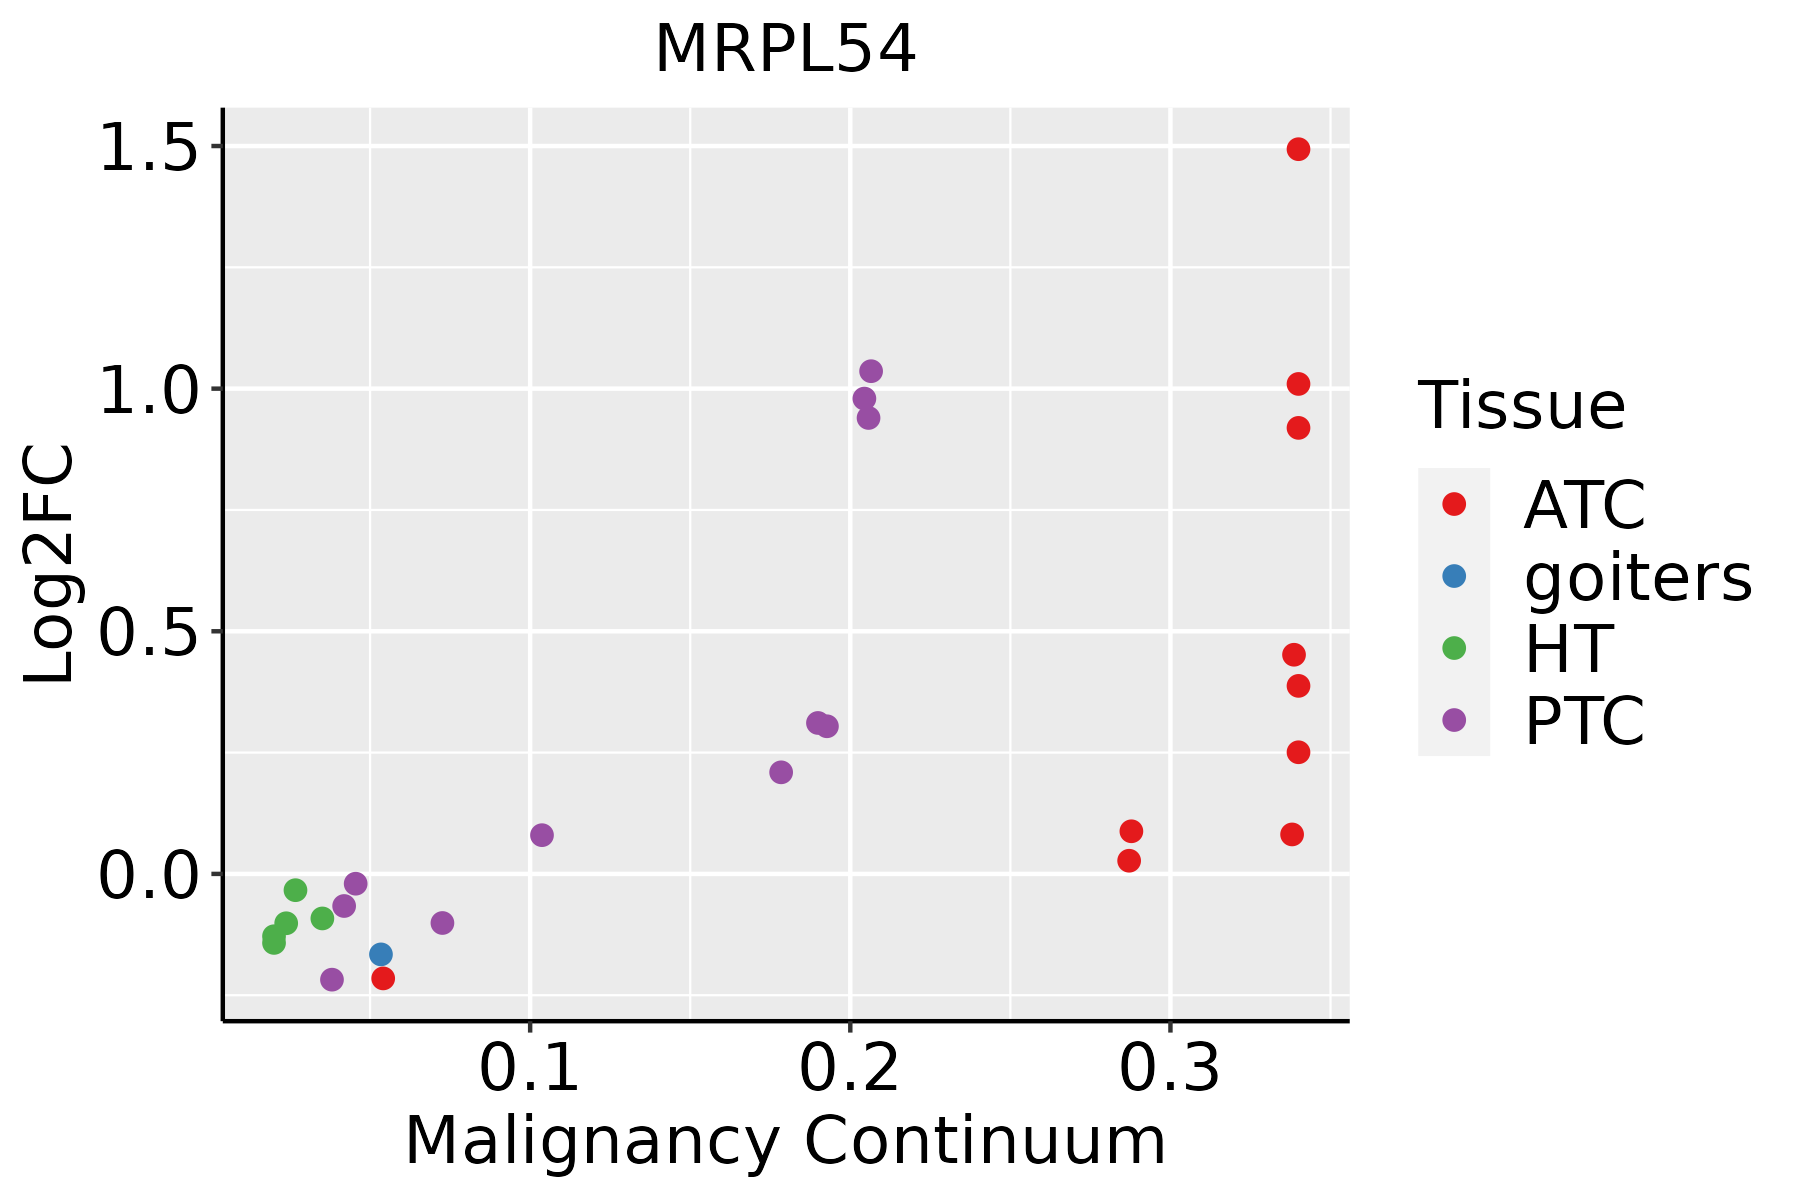 | ATC: Anaplastic thyroid cancer |
| HT: Hashimoto's thyroiditis | ||
| PTC: Papillary thyroid cancer |
| ∗log2FC in expression of this searched gene in stem-like cells from each diseased tissue sample relative to stem-like cells in normal samples in each tissue plotted against the malignancy continuum. Samples are colored based on if they are from different disease stage. |
Top |
Malignant transformation related pathway analysis |
| Find out the enriched GO biological processes and KEGG pathways involved in transition from healthy to precancer to cancer |
| Tissue | Disease Stage | Enriched GO biological Processes |
| Colorectum | AD |  |
| Colorectum | SER |  |
| Colorectum | MSS |  |
| Colorectum | MSI-H |  |
| Colorectum | FAP |  |
| ∗Top 15 enriched GO BP terms are showed in the bar plot of each disease state in each tissue. Each row represents a significant GO biological process which is colored according to the -log10(p.adjust). |
| Page: 1 2 3 4 5 6 7 8 9 |
| GO ID | Tissue | Disease Stage | Description | Gene Ratio | Bg Ratio | pvalue | p.adjust | Count |
| Page: 1 |
| Pathway ID | Tissue | Disease Stage | Description | Gene Ratio | Bg Ratio | pvalue | p.adjust | qvalue | Count |
| Page: 1 |
Top |
Cell-cell communication analysis |
| Identification of potential cell-cell interactions between two cell types and their ligand-receptor pairs for different disease states |
| Ligand | Receptor | LRpair | Pathway | Tissue | Disease Stage |
| Page: 1 |
Top |
Single-cell gene regulatory network inference analysis |
| Find out the significant the regulons (TFs) and the target genes of each regulon across cell types for different disease states |
| TF | Cell Type | Tissue | Disease Stage | Target Gene | RSS | Regulon Activity |
| ∗The dot plots of a searched regulon are shown for all cell subpopulations in each disease state of each tissue based on the regulon specific score inferred using pySCENIC and by calculating the average expression. |
| Page: 1 |
Top |
Somatic mutation of malignant transformation related genes |
| Annotation of somatic variants for genes involved in malignant transformation |
| Hugo Symbol | Variant Class | Variant Classification | dbSNP RS | HGVSc | HGVSp | HGVSp Short | SWISSPROT | BIOTYPE | SIFT | PolyPhen | Tumor Sample Barcode | Tissue | Histology | Sex | Age | Stage | Therapy Types | Drugs | Outcome |
| MRPL54 | SNV | Missense_Mutation | rs772250551 | c.365N>A | p.Arg122Gln | p.R122Q | Q6P161 | protein_coding | deleterious(0) | probably_damaging(0.997) | TCGA-A6-6780-01 | Colorectum | colon adenocarcinoma | Male | >=65 | I/II | Unknown | Unknown | SD |
| MRPL54 | SNV | Missense_Mutation | rs777202419 | c.383G>A | p.Arg128His | p.R128H | Q6P161 | protein_coding | tolerated(0.09) | benign(0.221) | TCGA-G4-6588-01 | Colorectum | colon adenocarcinoma | Female | <65 | I/II | Unknown | Unknown | SD |
| MRPL54 | SNV | Missense_Mutation | rs143484211 | c.343N>T | p.Arg115Trp | p.R115W | Q6P161 | protein_coding | tolerated(0.3) | benign(0.005) | TCGA-DT-5265-01 | Colorectum | rectum adenocarcinoma | Male | <65 | I/II | Unknown | Unknown | SD |
| MRPL54 | SNV | Missense_Mutation | novel | c.16C>T | p.Leu6Phe | p.L6F | Q6P161 | protein_coding | deleterious_low_confidence(0.03) | possibly_damaging(0.726) | TCGA-F5-6465-01 | Colorectum | rectum adenocarcinoma | Female | <65 | I/II | Unknown | Unknown | SD |
| MRPL54 | deletion | Frame_Shift_Del | c.47delN | p.Ala18ProfsTer5 | p.A18Pfs*5 | Q6P161 | protein_coding | TCGA-D5-6928-01 | Colorectum | colon adenocarcinoma | Male | >=65 | I/II | Unknown | Unknown | SD | |||
| MRPL54 | deletion | Frame_Shift_Del | c.47delN | p.Ala18ProfsTer5 | p.A18Pfs*5 | Q6P161 | protein_coding | TCGA-QG-A5Z2-01 | Colorectum | colon adenocarcinoma | Male | <65 | I/II | Unknown | Unknown | SD | |||
| MRPL54 | SNV | Missense_Mutation | rs200612448 | c.356N>A | p.Arg119Gln | p.R119Q | Q6P161 | protein_coding | deleterious(0) | possibly_damaging(0.88) | TCGA-A5-A0GW-01 | Endometrium | uterine corpus endometrioid carcinoma | Female | <65 | I/II | Unknown | Unknown | SD |
| MRPL54 | SNV | Missense_Mutation | novel | c.146G>A | p.Gly49Asp | p.G49D | Q6P161 | protein_coding | deleterious(0.02) | possibly_damaging(0.638) | TCGA-AX-A06F-01 | Endometrium | uterine corpus endometrioid carcinoma | Female | <65 | III/IV | Chemotherapy | carboplatin | SD |
| MRPL54 | SNV | Missense_Mutation | novel | c.162G>T | p.Glu54Asp | p.E54D | Q6P161 | protein_coding | tolerated(0.13) | benign(0.003) | TCGA-B5-A3FC-01 | Endometrium | uterine corpus endometrioid carcinoma | Female | <65 | I/II | Unknown | Unknown | SD |
| MRPL54 | SNV | Missense_Mutation | novel | c.100N>A | p.Asp34Asn | p.D34N | Q6P161 | protein_coding | tolerated(0.47) | benign(0.001) | TCGA-EO-A22R-01 | Endometrium | uterine corpus endometrioid carcinoma | Female | <65 | I/II | Unknown | Unknown | SD |
| Page: 1 2 |
Top |
Related drugs of malignant transformation related genes |
| Identification of chemicals and drugs interact with genes involved in malignant transfromation |
| (DGIdb 4.0) |
| Entrez ID | Symbol | Category | Interaction Types | Drug Claim Name | Drug Name | PMIDs |
| Page: 1 |

Copyright 2023-Present -The University of Texas Health Science Center at Houston |