
|
|||||
|
 | |
| |
| |
| |
| |
| |
|
Gene: MRPL45 |
Gene summary for MRPL45 |
| Gene information | Species | Human | Gene symbol | MRPL45 | Gene ID | 84311 |
| Gene name | mitochondrial ribosomal protein L45 | |
| Gene Alias | L45mt | |
| Cytomap | 17q12 | |
| Gene Type | protein-coding | GO ID | GO:0000313 | UniProtAcc | A0A087WU62 |
Top |
Malignant transformation analysis |
| Identification of the aberrant gene expression in precancerous and cancerous lesions by comparing the gene expression of stem-like cells in diseased tissues with normal stem cells |
| Entrez ID | Symbol | Replicates | Species | Organ | Tissue | Adj P-value | Log2FC | Malignancy |
| 84311 | MRPL45 | LZE2T | Human | Esophagus | ESCC | 2.02e-03 | 3.80e-01 | 0.082 |
| 84311 | MRPL45 | LZE4T | Human | Esophagus | ESCC | 3.37e-10 | 4.12e-01 | 0.0811 |
| 84311 | MRPL45 | LZE5T | Human | Esophagus | ESCC | 3.35e-04 | 1.74e-01 | 0.0514 |
| 84311 | MRPL45 | LZE7T | Human | Esophagus | ESCC | 8.11e-04 | 4.71e-01 | 0.0667 |
| 84311 | MRPL45 | LZE8T | Human | Esophagus | ESCC | 5.36e-05 | 1.31e-01 | 0.067 |
| 84311 | MRPL45 | LZE22D1 | Human | Esophagus | HGIN | 4.45e-07 | 2.09e-01 | 0.0595 |
| 84311 | MRPL45 | LZE24T | Human | Esophagus | ESCC | 5.47e-18 | 6.35e-01 | 0.0596 |
| 84311 | MRPL45 | LZE21T | Human | Esophagus | ESCC | 2.32e-03 | 2.94e-01 | 0.0655 |
| 84311 | MRPL45 | LZE6T | Human | Esophagus | ESCC | 2.35e-04 | 4.07e-01 | 0.0845 |
| 84311 | MRPL45 | P1T-E | Human | Esophagus | ESCC | 2.14e-04 | 5.76e-01 | 0.0875 |
| 84311 | MRPL45 | P2T-E | Human | Esophagus | ESCC | 1.13e-38 | 7.31e-01 | 0.1177 |
| 84311 | MRPL45 | P4T-E | Human | Esophagus | ESCC | 1.02e-25 | 6.90e-01 | 0.1323 |
| 84311 | MRPL45 | P5T-E | Human | Esophagus | ESCC | 2.93e-32 | 6.99e-01 | 0.1327 |
| 84311 | MRPL45 | P8T-E | Human | Esophagus | ESCC | 1.71e-25 | 5.56e-01 | 0.0889 |
| 84311 | MRPL45 | P9T-E | Human | Esophagus | ESCC | 1.56e-12 | 3.97e-01 | 0.1131 |
| 84311 | MRPL45 | P10T-E | Human | Esophagus | ESCC | 4.61e-09 | 1.73e-01 | 0.116 |
| 84311 | MRPL45 | P11T-E | Human | Esophagus | ESCC | 4.44e-12 | 6.73e-01 | 0.1426 |
| 84311 | MRPL45 | P12T-E | Human | Esophagus | ESCC | 1.69e-34 | 7.99e-01 | 0.1122 |
| 84311 | MRPL45 | P15T-E | Human | Esophagus | ESCC | 2.67e-34 | 7.62e-01 | 0.1149 |
| 84311 | MRPL45 | P16T-E | Human | Esophagus | ESCC | 1.19e-33 | 6.71e-01 | 0.1153 |
| Page: 1 2 3 4 5 6 |
| Tissue | Expression Dynamics | Abbreviation |
| Esophagus |  | ESCC: Esophageal squamous cell carcinoma |
| HGIN: High-grade intraepithelial neoplasias | ||
| LGIN: Low-grade intraepithelial neoplasias | ||
| Liver | 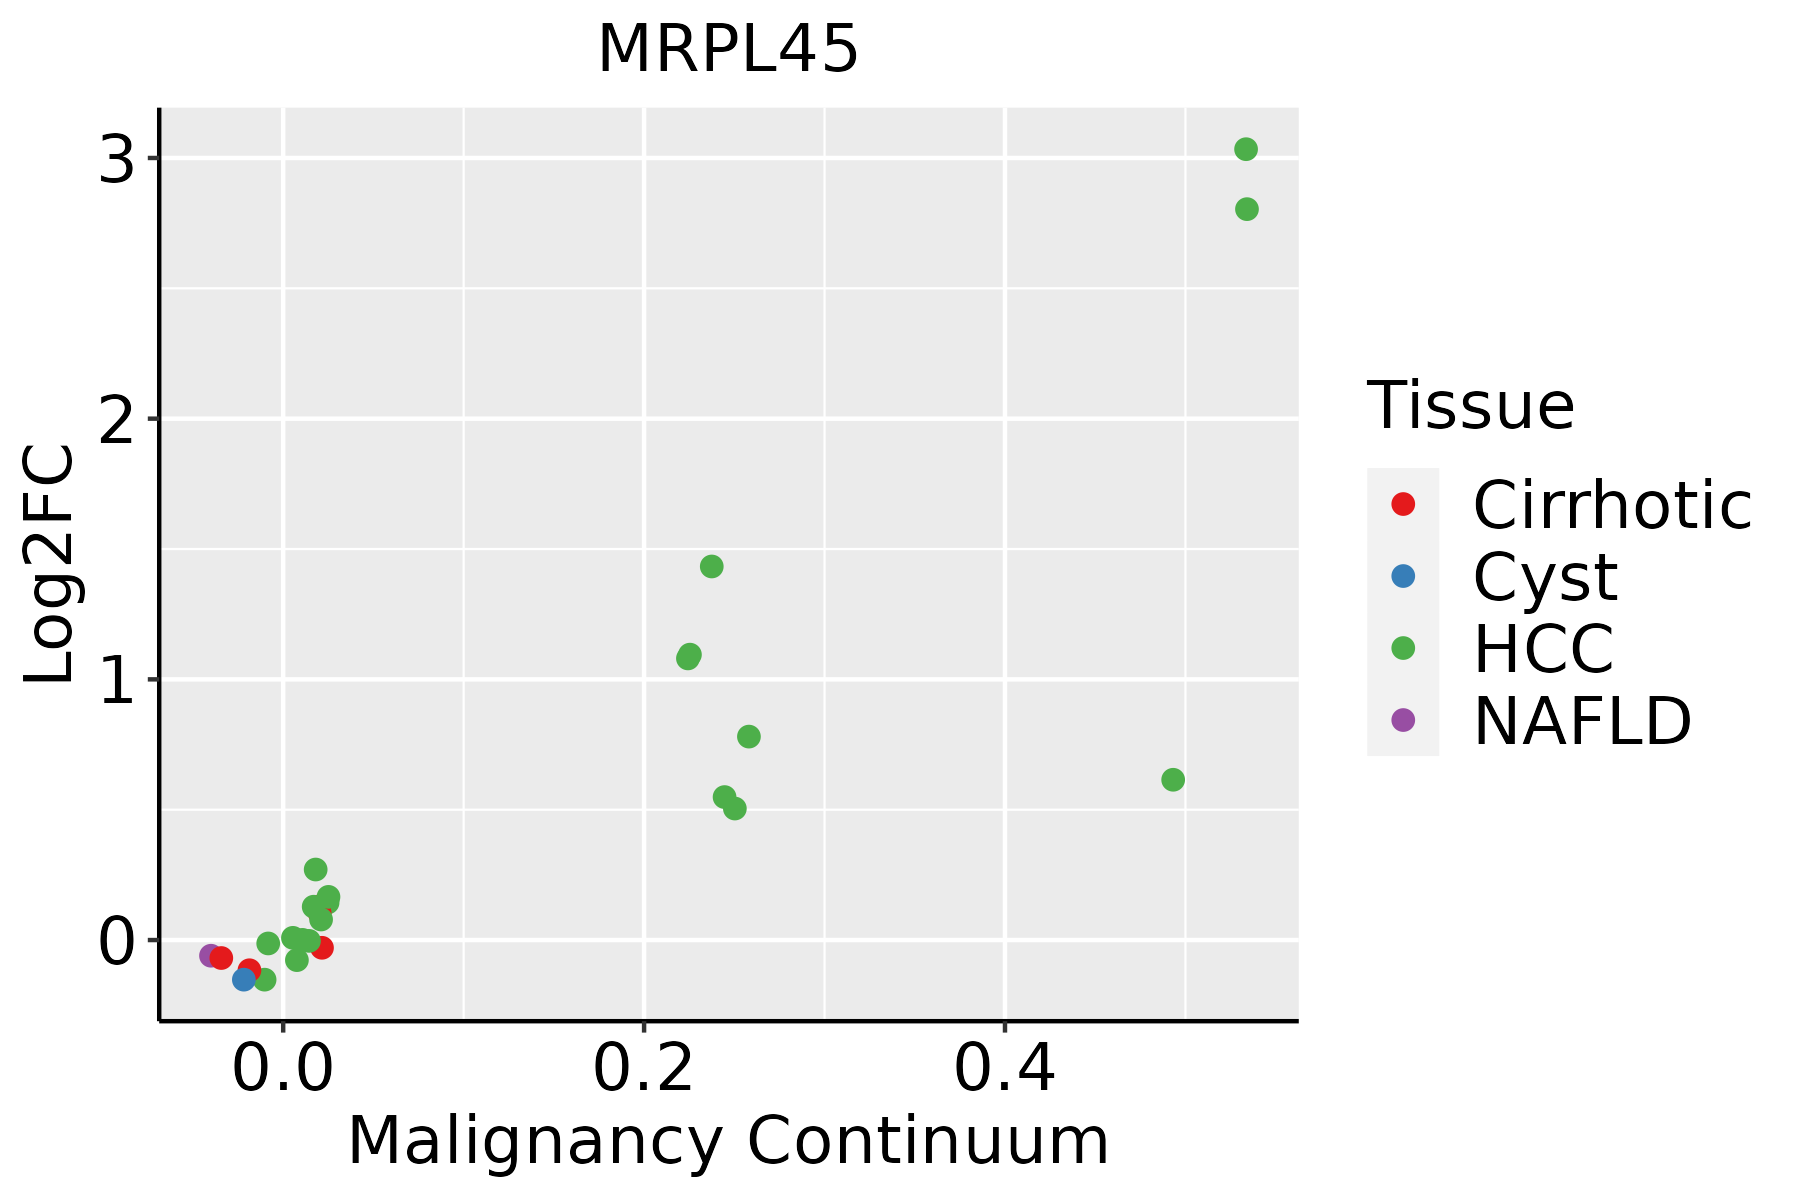 | HCC: Hepatocellular carcinoma |
| NAFLD: Non-alcoholic fatty liver disease | ||
| Oral Cavity | 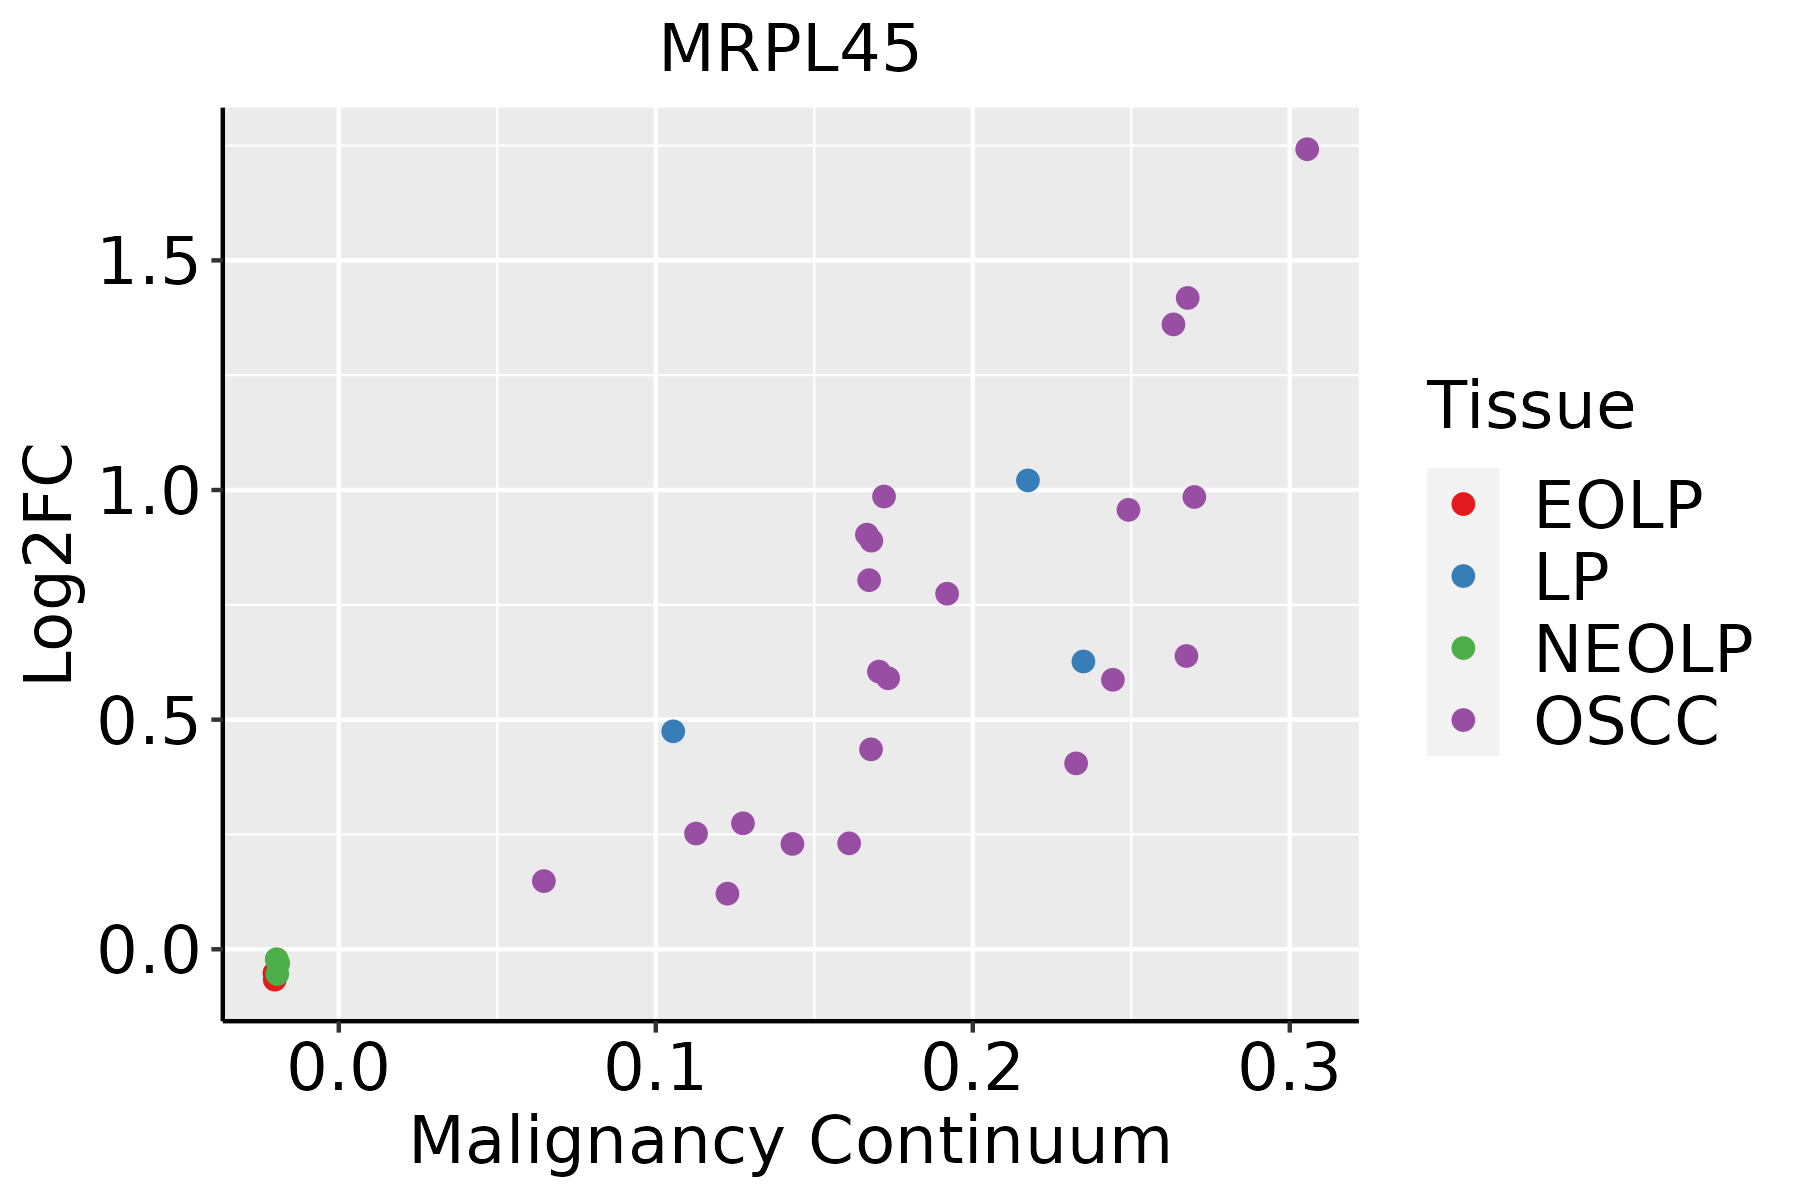 | EOLP: Erosive Oral lichen planus |
| LP: leukoplakia | ||
| NEOLP: Non-erosive oral lichen planus | ||
| OSCC: Oral squamous cell carcinoma | ||
| Skin | 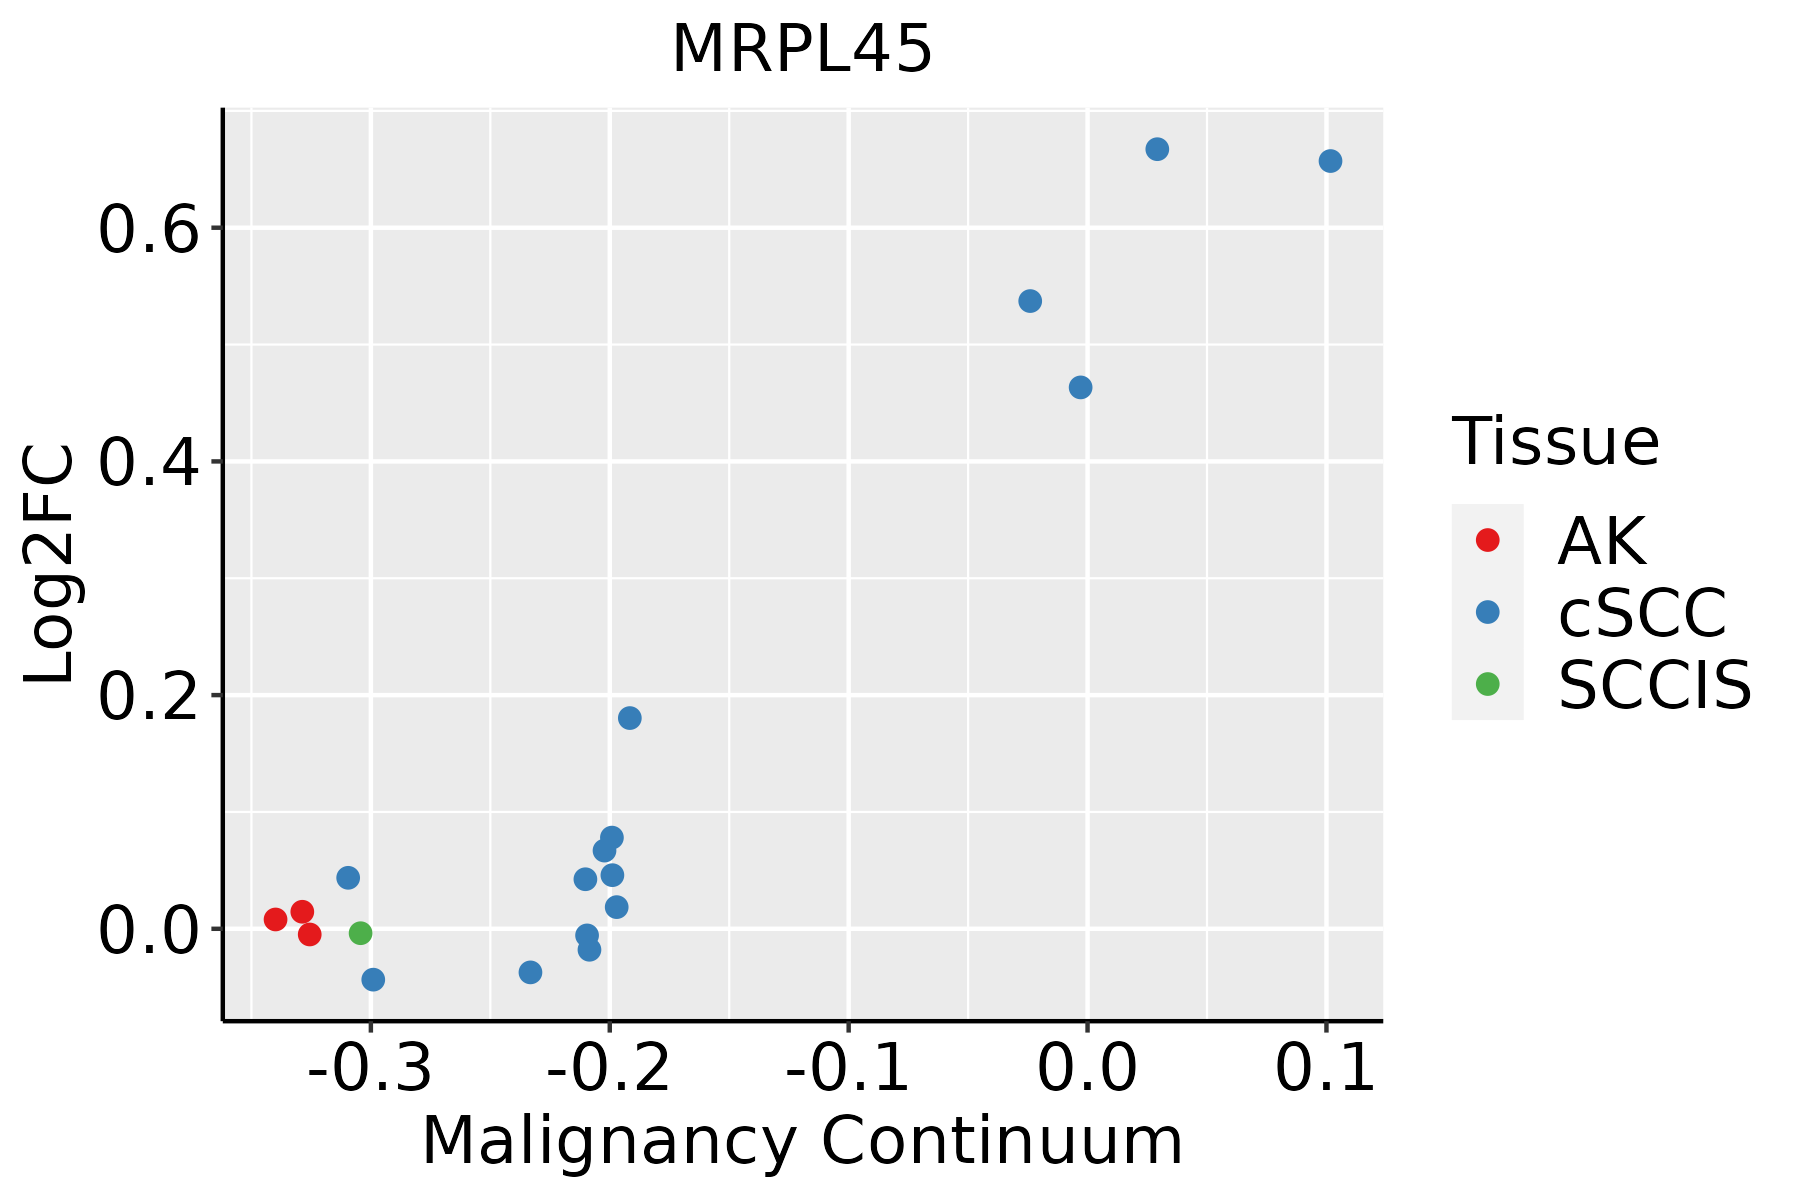 | AK: Actinic keratosis |
| cSCC: Cutaneous squamous cell carcinoma | ||
| SCCIS:squamous cell carcinoma in situ |
| ∗log2FC in expression of this searched gene in stem-like cells from each diseased tissue sample relative to stem-like cells in normal samples in each tissue plotted against the malignancy continuum. Samples are colored based on if they are from different disease stage. |
Top |
Malignant transformation related pathway analysis |
| Find out the enriched GO biological processes and KEGG pathways involved in transition from healthy to precancer to cancer |
| Tissue | Disease Stage | Enriched GO biological Processes |
| Colorectum | AD |  |
| Colorectum | SER |  |
| Colorectum | MSS |  |
| Colorectum | MSI-H |  |
| Colorectum | FAP |  |
| ∗Top 15 enriched GO BP terms are showed in the bar plot of each disease state in each tissue. Each row represents a significant GO biological process which is colored according to the -log10(p.adjust). |
| Page: 1 2 3 4 5 6 7 8 9 |
| GO ID | Tissue | Disease Stage | Description | Gene Ratio | Bg Ratio | pvalue | p.adjust | Count |
| Page: 1 |
| Pathway ID | Tissue | Disease Stage | Description | Gene Ratio | Bg Ratio | pvalue | p.adjust | qvalue | Count |
| Page: 1 |
Top |
Cell-cell communication analysis |
| Identification of potential cell-cell interactions between two cell types and their ligand-receptor pairs for different disease states |
| Ligand | Receptor | LRpair | Pathway | Tissue | Disease Stage |
| Page: 1 |
Top |
Single-cell gene regulatory network inference analysis |
| Find out the significant the regulons (TFs) and the target genes of each regulon across cell types for different disease states |
| TF | Cell Type | Tissue | Disease Stage | Target Gene | RSS | Regulon Activity |
| ∗The dot plots of a searched regulon are shown for all cell subpopulations in each disease state of each tissue based on the regulon specific score inferred using pySCENIC and by calculating the average expression. |
| Page: 1 |
Top |
Somatic mutation of malignant transformation related genes |
| Annotation of somatic variants for genes involved in malignant transformation |
| Hugo Symbol | Variant Class | Variant Classification | dbSNP RS | HGVSc | HGVSp | HGVSp Short | SWISSPROT | BIOTYPE | SIFT | PolyPhen | Tumor Sample Barcode | Tissue | Histology | Sex | Age | Stage | Therapy Types | Drugs | Outcome |
| MRPL45 | SNV | Missense_Mutation | novel | c.73N>G | p.Leu25Val | p.L25V | protein_coding | tolerated(0.18) | possibly_damaging(0.531) | TCGA-AC-A23H-01 | Breast | breast invasive carcinoma | Female | >=65 | I/II | Unknown | Unknown | PD | |
| MRPL45 | SNV | Missense_Mutation | novel | c.872N>T | p.Glu291Val | p.E291V | protein_coding | deleterious(0) | possibly_damaging(0.558) | TCGA-AQ-A04J-01 | Breast | breast invasive carcinoma | Female | <65 | I/II | Chemotherapy | cytoxan | SD | |
| MRPL45 | SNV | Missense_Mutation | novel | c.406N>C | p.Asp136His | p.D136H | protein_coding | deleterious(0.04) | possibly_damaging(0.765) | TCGA-VS-A958-01 | Cervix | cervical & endocervical cancer | Female | <65 | I/II | Chemotherapy | cisplatin | CR | |
| MRPL45 | SNV | Missense_Mutation | rs769411482 | c.286N>T | p.Arg96Cys | p.R96C | protein_coding | deleterious(0) | probably_damaging(0.928) | TCGA-A6-6140-01 | Colorectum | colon adenocarcinoma | Male | <65 | I/II | Chemotherapy | oxaliplatin | SD | |
| MRPL45 | SNV | Missense_Mutation | novel | c.819N>T | p.Lys273Asn | p.K273N | protein_coding | deleterious(0) | possibly_damaging(0.878) | TCGA-AA-3864-01 | Colorectum | colon adenocarcinoma | Male | >=65 | I/II | Unknown | Unknown | SD | |
| MRPL45 | SNV | Missense_Mutation | novel | c.28T>A | p.Ser10Thr | p.S10T | protein_coding | tolerated(0.32) | benign(0.001) | TCGA-CK-4951-01 | Colorectum | colon adenocarcinoma | Female | >=65 | I/II | Unknown | Unknown | PD | |
| MRPL45 | insertion | Frame_Shift_Ins | novel | c.111_112insA | p.Arg40ThrfsTer10 | p.R40Tfs*10 | protein_coding | TCGA-AG-A002-01 | Colorectum | rectum adenocarcinoma | Male | <65 | I/II | Unknown | Unknown | SD | |||
| MRPL45 | SNV | Missense_Mutation | rs149900445 | c.88N>A | p.Ala30Thr | p.A30T | protein_coding | tolerated(0.55) | benign(0.003) | TCGA-AJ-A3EL-01 | Endometrium | uterine corpus endometrioid carcinoma | Female | <65 | I/II | Unknown | Unknown | SD | |
| MRPL45 | SNV | Missense_Mutation | novel | c.27N>A | p.Phe9Leu | p.F9L | protein_coding | tolerated(1) | benign(0) | TCGA-AJ-A5DW-01 | Endometrium | uterine corpus endometrioid carcinoma | Female | <65 | I/II | Unknown | Unknown | SD | |
| MRPL45 | SNV | Missense_Mutation | novel | c.697N>C | p.Tyr233His | p.Y233H | protein_coding | tolerated(0.4) | probably_damaging(0.987) | TCGA-AP-A059-01 | Endometrium | uterine corpus endometrioid carcinoma | Female | >=65 | I/II | Unknown | Unknown | SD |
| Page: 1 2 3 |
Top |
Related drugs of malignant transformation related genes |
| Identification of chemicals and drugs interact with genes involved in malignant transfromation |
| (DGIdb 4.0) |
| Entrez ID | Symbol | Category | Interaction Types | Drug Claim Name | Drug Name | PMIDs |
| Page: 1 |

Copyright 2023-Present -The University of Texas Health Science Center at Houston |