
|
|||||
|
 | |
| |
| |
| |
| |
| |
|
Gene: MRPL44 |
Gene summary for MRPL44 |
| Gene information | Species | Human | Gene symbol | MRPL44 | Gene ID | 65080 |
| Gene name | mitochondrial ribosomal protein L44 | |
| Gene Alias | COXPD16 | |
| Cytomap | 2q36.1 | |
| Gene Type | protein-coding | GO ID | GO:0006139 | UniProtAcc | A0A024R473 |
Top |
Malignant transformation analysis |
| Identification of the aberrant gene expression in precancerous and cancerous lesions by comparing the gene expression of stem-like cells in diseased tissues with normal stem cells |
| Entrez ID | Symbol | Replicates | Species | Organ | Tissue | Adj P-value | Log2FC | Malignancy |
| 65080 | MRPL44 | LZE4T | Human | Esophagus | ESCC | 2.68e-14 | 4.08e-01 | 0.0811 |
| 65080 | MRPL44 | LZE7T | Human | Esophagus | ESCC | 2.25e-03 | 2.26e-01 | 0.0667 |
| 65080 | MRPL44 | LZE20T | Human | Esophagus | ESCC | 2.72e-06 | 1.61e-01 | 0.0662 |
| 65080 | MRPL44 | LZE24T | Human | Esophagus | ESCC | 6.72e-11 | 3.69e-01 | 0.0596 |
| 65080 | MRPL44 | P1T-E | Human | Esophagus | ESCC | 2.45e-04 | 2.02e-01 | 0.0875 |
| 65080 | MRPL44 | P2T-E | Human | Esophagus | ESCC | 5.80e-24 | 4.63e-01 | 0.1177 |
| 65080 | MRPL44 | P4T-E | Human | Esophagus | ESCC | 5.39e-25 | 5.86e-01 | 0.1323 |
| 65080 | MRPL44 | P5T-E | Human | Esophagus | ESCC | 2.85e-25 | 5.19e-01 | 0.1327 |
| 65080 | MRPL44 | P8T-E | Human | Esophagus | ESCC | 2.81e-23 | 3.25e-01 | 0.0889 |
| 65080 | MRPL44 | P9T-E | Human | Esophagus | ESCC | 2.74e-13 | 3.04e-01 | 0.1131 |
| 65080 | MRPL44 | P10T-E | Human | Esophagus | ESCC | 3.16e-21 | 4.17e-01 | 0.116 |
| 65080 | MRPL44 | P11T-E | Human | Esophagus | ESCC | 1.21e-15 | 4.45e-01 | 0.1426 |
| 65080 | MRPL44 | P12T-E | Human | Esophagus | ESCC | 8.29e-32 | 5.96e-01 | 0.1122 |
| 65080 | MRPL44 | P15T-E | Human | Esophagus | ESCC | 1.43e-37 | 8.46e-01 | 0.1149 |
| 65080 | MRPL44 | P16T-E | Human | Esophagus | ESCC | 8.20e-26 | 4.97e-01 | 0.1153 |
| 65080 | MRPL44 | P17T-E | Human | Esophagus | ESCC | 1.43e-05 | 3.15e-01 | 0.1278 |
| 65080 | MRPL44 | P19T-E | Human | Esophagus | ESCC | 5.70e-03 | 3.18e-01 | 0.1662 |
| 65080 | MRPL44 | P20T-E | Human | Esophagus | ESCC | 6.39e-18 | 4.41e-01 | 0.1124 |
| 65080 | MRPL44 | P21T-E | Human | Esophagus | ESCC | 8.21e-30 | 6.29e-01 | 0.1617 |
| 65080 | MRPL44 | P22T-E | Human | Esophagus | ESCC | 4.14e-24 | 4.17e-01 | 0.1236 |
| Page: 1 2 3 4 5 |
| Tissue | Expression Dynamics | Abbreviation |
| Esophagus | 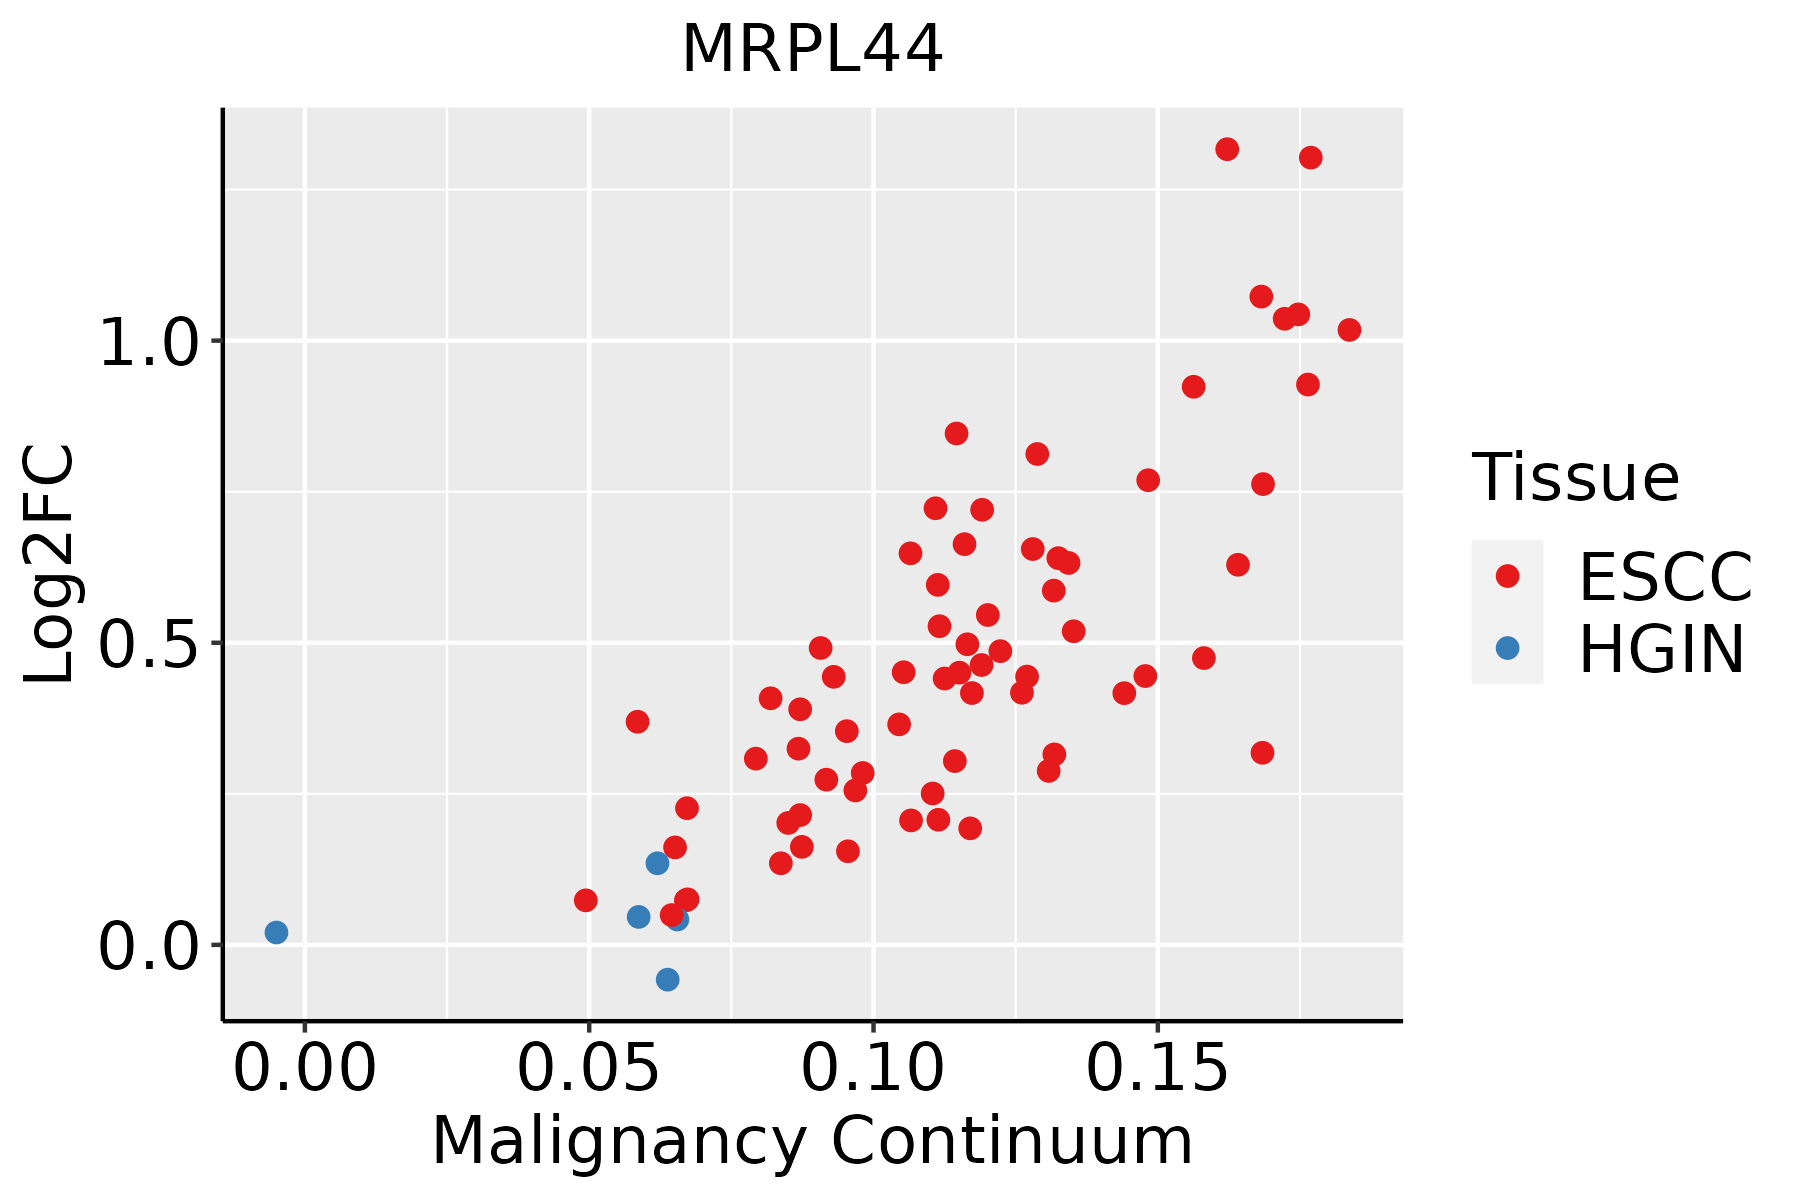 | ESCC: Esophageal squamous cell carcinoma |
| HGIN: High-grade intraepithelial neoplasias | ||
| LGIN: Low-grade intraepithelial neoplasias | ||
| Liver | 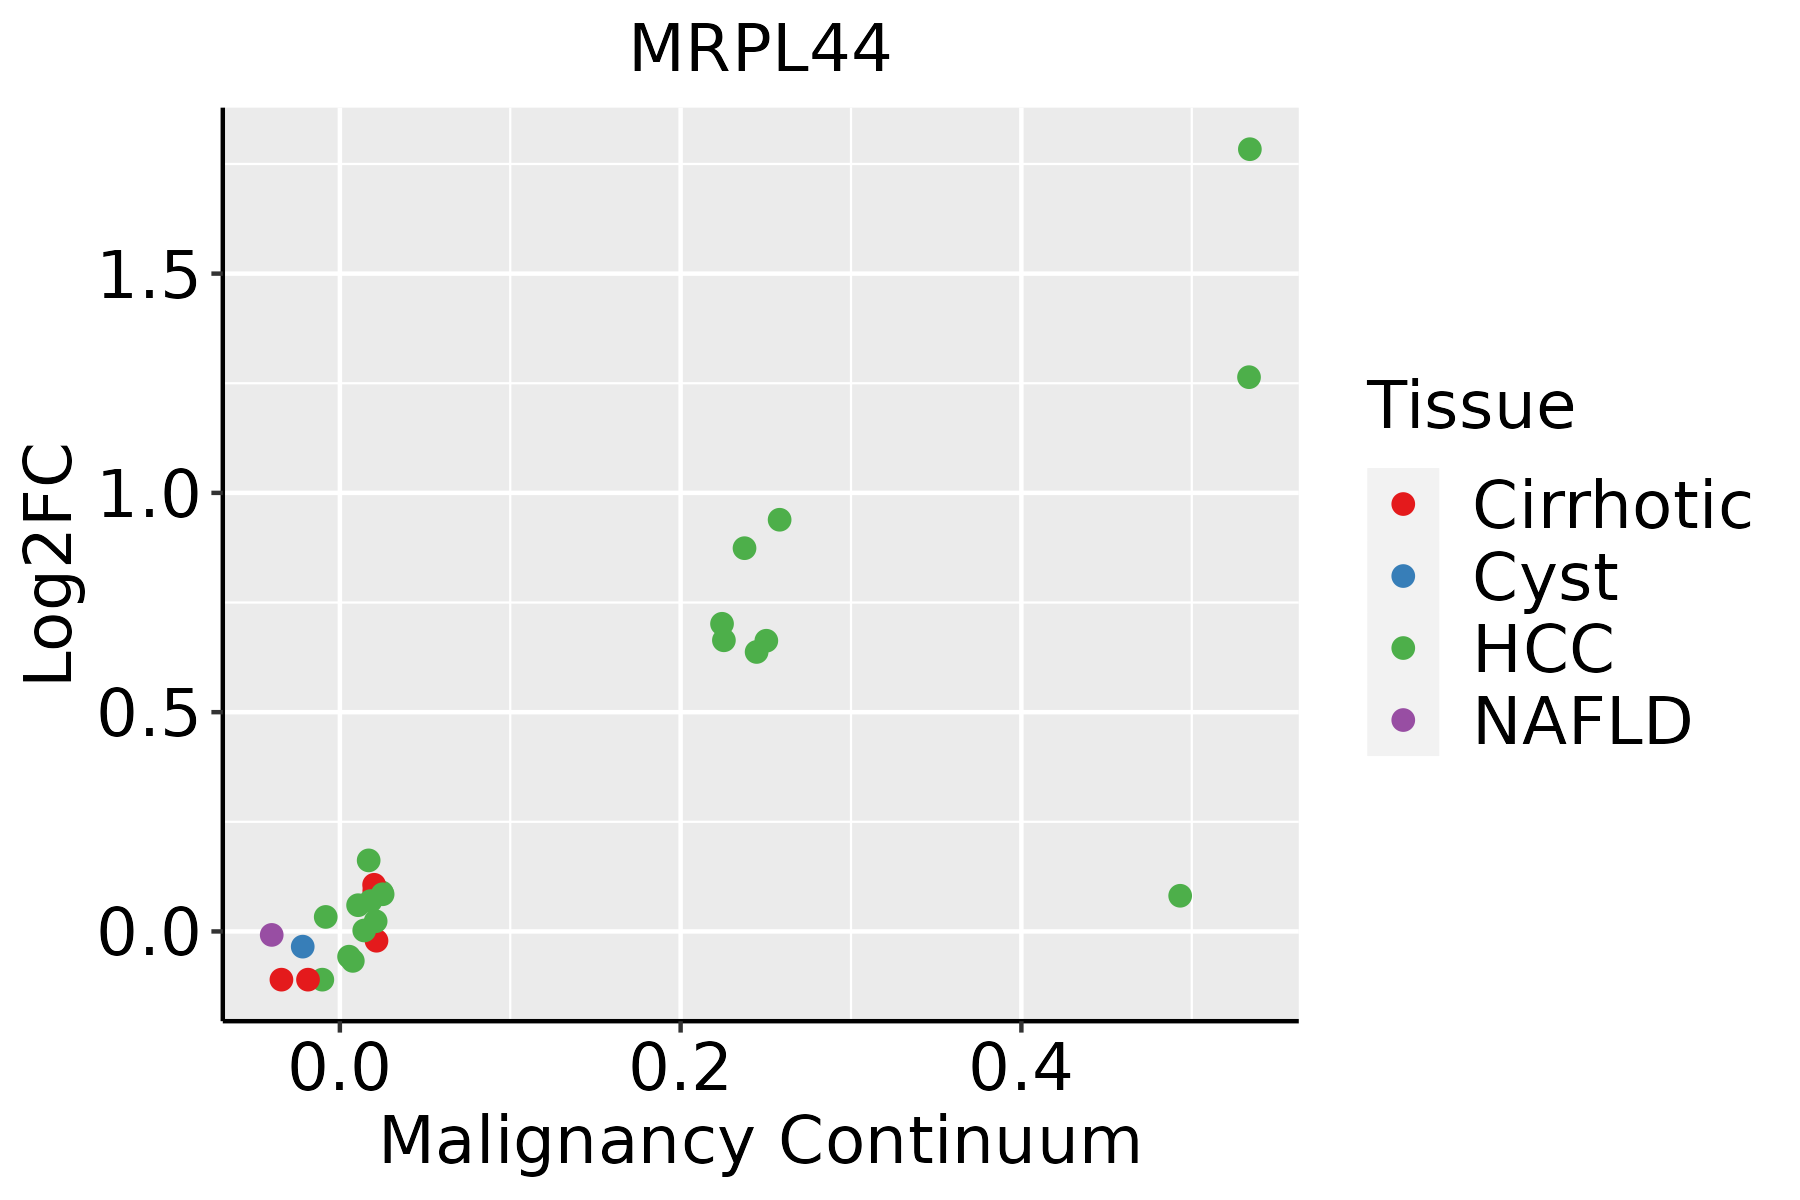 | HCC: Hepatocellular carcinoma |
| NAFLD: Non-alcoholic fatty liver disease | ||
| Oral Cavity | 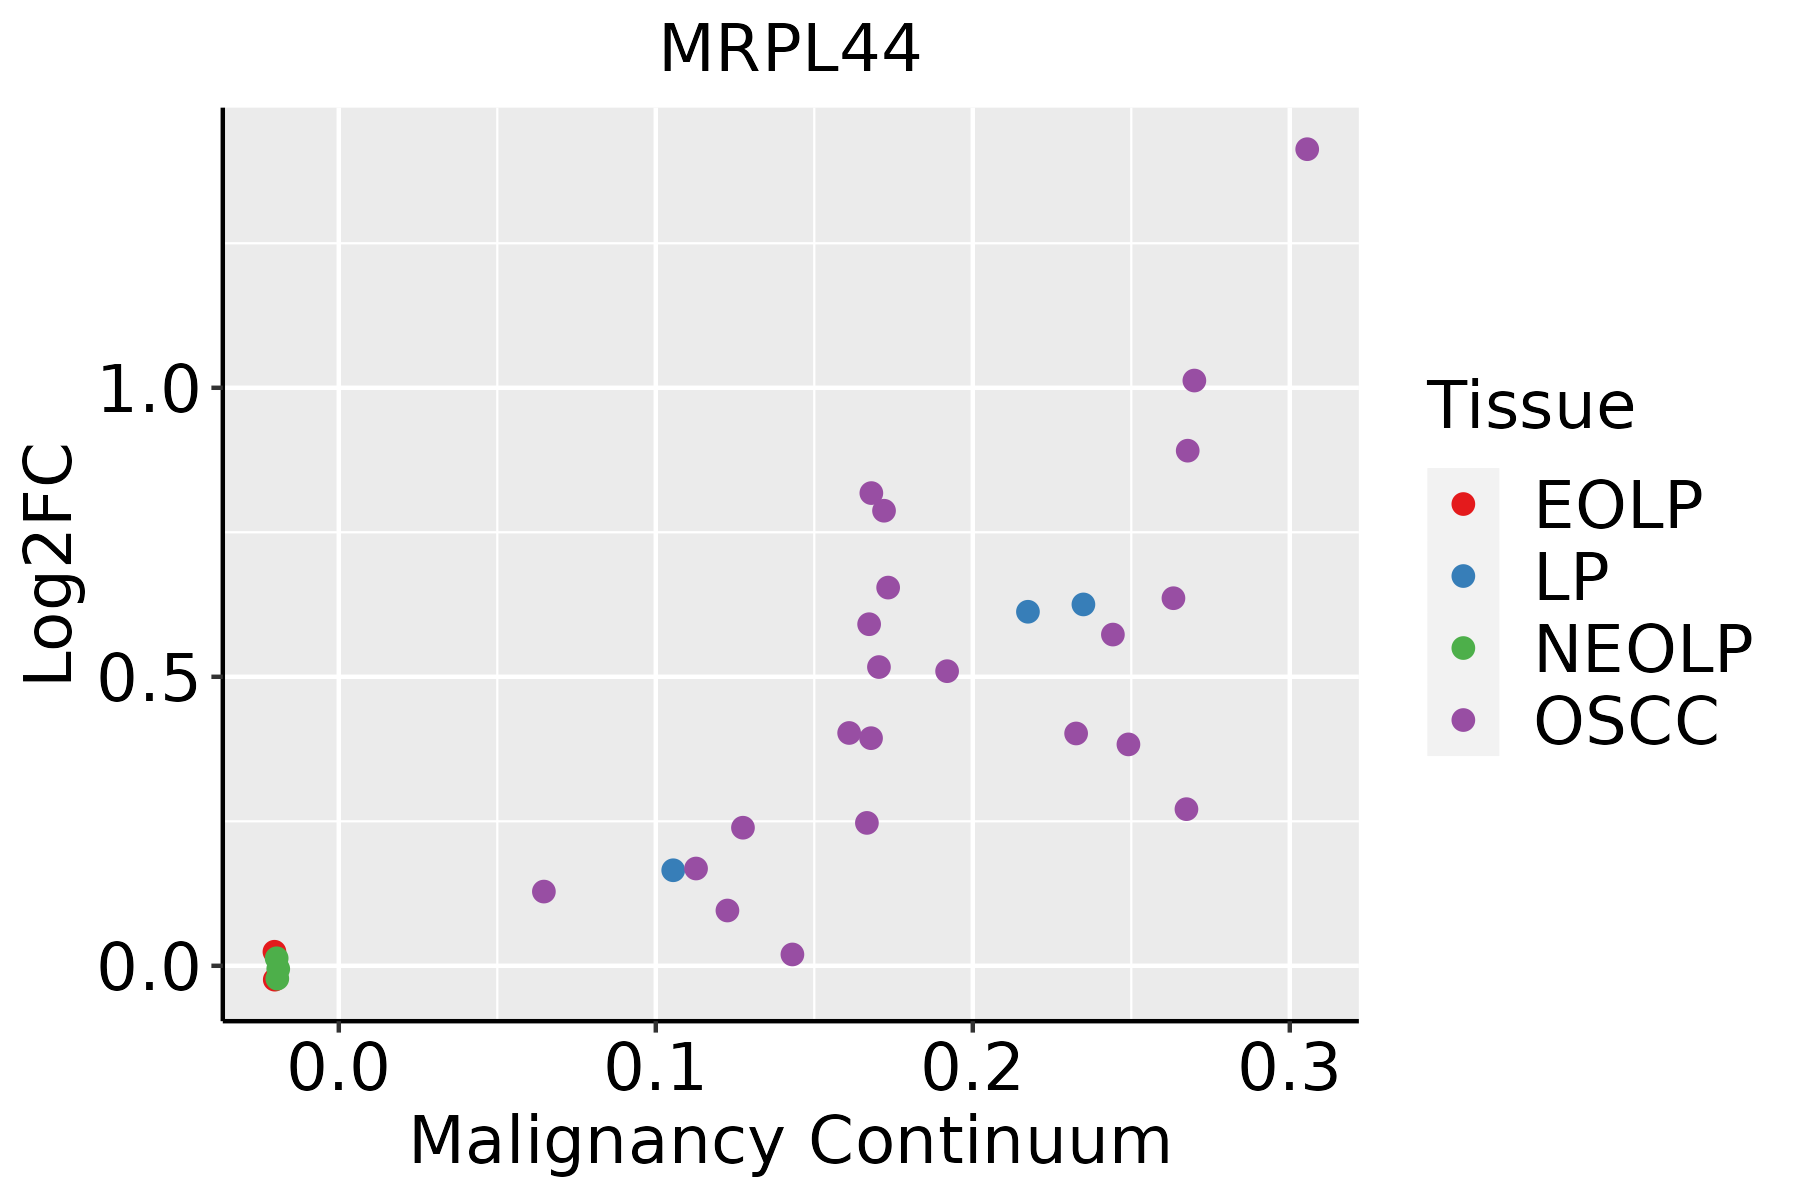 | EOLP: Erosive Oral lichen planus |
| LP: leukoplakia | ||
| NEOLP: Non-erosive oral lichen planus | ||
| OSCC: Oral squamous cell carcinoma | ||
| Skin | 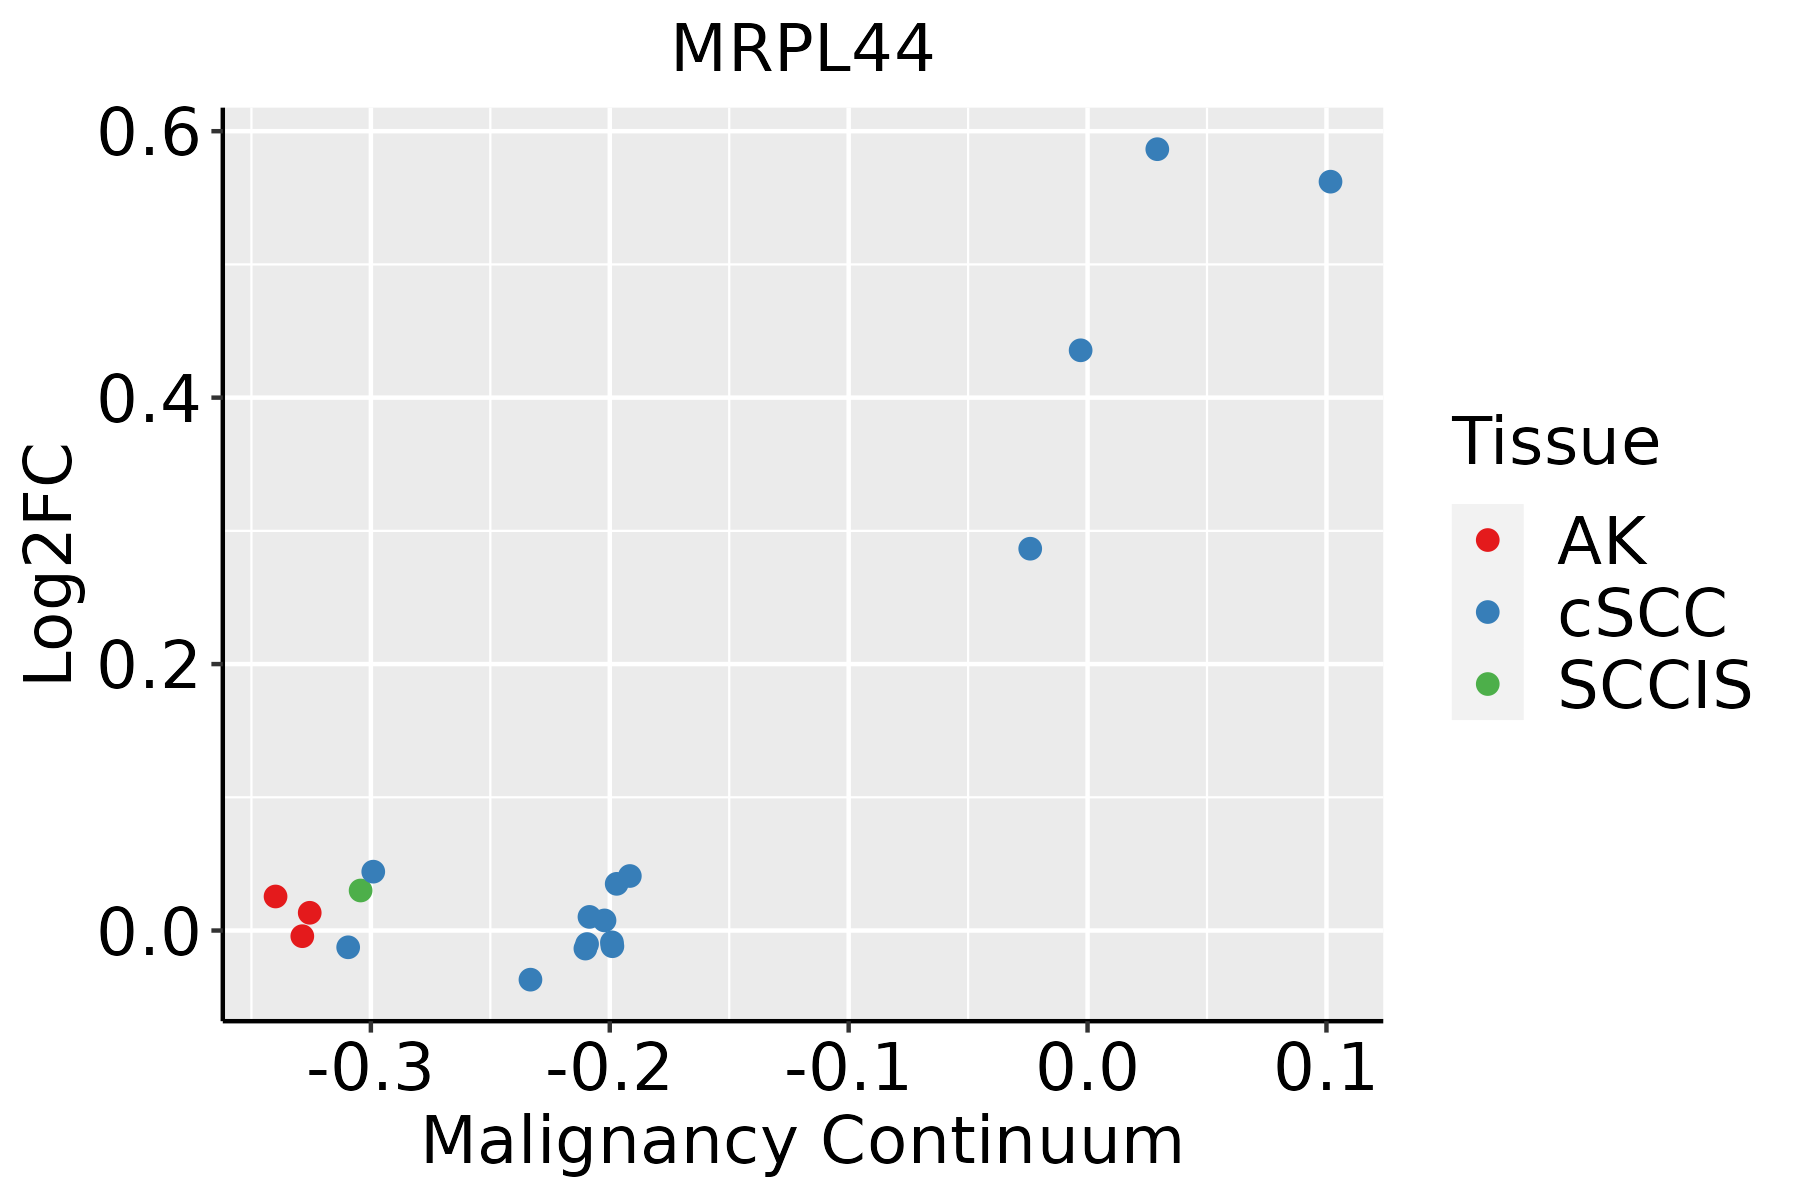 | AK: Actinic keratosis |
| cSCC: Cutaneous squamous cell carcinoma | ||
| SCCIS:squamous cell carcinoma in situ |
| ∗log2FC in expression of this searched gene in stem-like cells from each diseased tissue sample relative to stem-like cells in normal samples in each tissue plotted against the malignancy continuum. Samples are colored based on if they are from different disease stage. |
Top |
Malignant transformation related pathway analysis |
| Find out the enriched GO biological processes and KEGG pathways involved in transition from healthy to precancer to cancer |
| Tissue | Disease Stage | Enriched GO biological Processes |
| Colorectum | AD |  |
| Colorectum | SER |  |
| Colorectum | MSS |  |
| Colorectum | MSI-H |  |
| Colorectum | FAP |  |
| ∗Top 15 enriched GO BP terms are showed in the bar plot of each disease state in each tissue. Each row represents a significant GO biological process which is colored according to the -log10(p.adjust). |
| Page: 1 2 3 4 5 6 7 8 9 |
| GO ID | Tissue | Disease Stage | Description | Gene Ratio | Bg Ratio | pvalue | p.adjust | Count |
| GO:0016072110 | Esophagus | ESCC | rRNA metabolic process | 197/8552 | 236/18723 | 1.31e-33 | 1.18e-30 | 197 |
| GO:003466012 | Esophagus | ESCC | ncRNA metabolic process | 346/8552 | 485/18723 | 4.35e-31 | 2.51e-28 | 346 |
| GO:0006401110 | Esophagus | ESCC | RNA catabolic process | 204/8552 | 278/18723 | 3.39e-21 | 5.66e-19 | 204 |
| GO:014005313 | Esophagus | ESCC | mitochondrial gene expression | 93/8552 | 108/18723 | 1.96e-18 | 2.03e-16 | 93 |
| GO:0034655110 | Esophagus | ESCC | nucleobase-containing compound catabolic process | 272/8552 | 407/18723 | 2.92e-18 | 2.90e-16 | 272 |
| GO:003254314 | Esophagus | ESCC | mitochondrial translation | 68/8552 | 76/18723 | 1.02e-15 | 6.86e-14 | 68 |
| GO:004670018 | Esophagus | ESCC | heterocycle catabolic process | 286/8552 | 445/18723 | 1.12e-15 | 7.47e-14 | 286 |
| GO:004427019 | Esophagus | ESCC | cellular nitrogen compound catabolic process | 288/8552 | 451/18723 | 3.03e-15 | 1.79e-13 | 288 |
| GO:001943918 | Esophagus | ESCC | aromatic compound catabolic process | 295/8552 | 467/18723 | 1.09e-14 | 5.98e-13 | 295 |
| GO:190136118 | Esophagus | ESCC | organic cyclic compound catabolic process | 307/8552 | 495/18723 | 9.99e-14 | 4.80e-12 | 307 |
| GO:00905013 | Esophagus | ESCC | RNA phosphodiester bond hydrolysis | 110/8552 | 152/18723 | 1.95e-11 | 6.81e-10 | 110 |
| GO:00903053 | Esophagus | ESCC | nucleic acid phosphodiester bond hydrolysis | 163/8552 | 261/18723 | 3.07e-08 | 5.73e-07 | 163 |
| GO:000641419 | Esophagus | ESCC | translational elongation | 41/8552 | 55/18723 | 1.26e-05 | 1.16e-04 | 41 |
| GO:00346613 | Esophagus | ESCC | ncRNA catabolic process | 33/8552 | 43/18723 | 3.25e-05 | 2.69e-04 | 33 |
| GO:00905023 | Esophagus | ESCC | RNA phosphodiester bond hydrolysis, endonucleolytic | 55/8552 | 82/18723 | 7.34e-05 | 5.51e-04 | 55 |
| GO:00160752 | Esophagus | ESCC | rRNA catabolic process | 18/8552 | 21/18723 | 1.81e-04 | 1.16e-03 | 18 |
| GO:001607212 | Liver | HCC | rRNA metabolic process | 193/7958 | 236/18723 | 1.26e-35 | 1.14e-32 | 193 |
| GO:00346601 | Liver | HCC | ncRNA metabolic process | 332/7958 | 485/18723 | 1.48e-31 | 7.80e-29 | 332 |
| GO:004427021 | Liver | HCC | cellular nitrogen compound catabolic process | 303/7958 | 451/18723 | 9.76e-27 | 3.64e-24 | 303 |
| GO:004670021 | Liver | HCC | heterocycle catabolic process | 299/7958 | 445/18723 | 2.07e-26 | 7.29e-24 | 299 |
| Page: 1 2 3 4 |
| Pathway ID | Tissue | Disease Stage | Description | Gene Ratio | Bg Ratio | pvalue | p.adjust | qvalue | Count |
| Page: 1 |
Top |
Cell-cell communication analysis |
| Identification of potential cell-cell interactions between two cell types and their ligand-receptor pairs for different disease states |
| Ligand | Receptor | LRpair | Pathway | Tissue | Disease Stage |
| Page: 1 |
Top |
Single-cell gene regulatory network inference analysis |
| Find out the significant the regulons (TFs) and the target genes of each regulon across cell types for different disease states |
| TF | Cell Type | Tissue | Disease Stage | Target Gene | RSS | Regulon Activity |
| ∗The dot plots of a searched regulon are shown for all cell subpopulations in each disease state of each tissue based on the regulon specific score inferred using pySCENIC and by calculating the average expression. |
| Page: 1 |
Top |
Somatic mutation of malignant transformation related genes |
| Annotation of somatic variants for genes involved in malignant transformation |
| Hugo Symbol | Variant Class | Variant Classification | dbSNP RS | HGVSc | HGVSp | HGVSp Short | SWISSPROT | BIOTYPE | SIFT | PolyPhen | Tumor Sample Barcode | Tissue | Histology | Sex | Age | Stage | Therapy Types | Drugs | Outcome |
| MRPL44 | SNV | Missense_Mutation | novel | c.366N>A | p.Asn122Lys | p.N122K | Q9H9J2 | protein_coding | deleterious(0) | probably_damaging(0.984) | TCGA-AC-A3QQ-01 | Breast | breast invasive carcinoma | Female | <65 | I/II | Unknown | Unknown | SD |
| MRPL44 | SNV | Missense_Mutation | rs149672795 | c.379N>A | p.Glu127Lys | p.E127K | Q9H9J2 | protein_coding | tolerated(0.23) | benign(0.005) | TCGA-AN-A046-01 | Breast | breast invasive carcinoma | Female | >=65 | I/II | Unknown | Unknown | SD |
| MRPL44 | insertion | Frame_Shift_Ins | novel | c.365_366insAG | p.Asn122LysfsTer33 | p.N122Kfs*33 | Q9H9J2 | protein_coding | TCGA-AC-A3QQ-01 | Breast | breast invasive carcinoma | Female | <65 | I/II | Unknown | Unknown | SD | ||
| MRPL44 | insertion | Frame_Shift_Ins | novel | c.614_615insATTTTTATATCACAGTAACAGGTTGTTCT | p.Ser205ArgfsTer25 | p.S205Rfs*25 | Q9H9J2 | protein_coding | TCGA-B6-A0I5-01 | Breast | breast invasive carcinoma | Female | <65 | I/II | Unknown | Unknown | SD | ||
| MRPL44 | SNV | Missense_Mutation | novel | c.96G>C | p.Lys32Asn | p.K32N | Q9H9J2 | protein_coding | deleterious(0) | probably_damaging(0.994) | TCGA-VS-A9UL-01 | Cervix | cervical & endocervical cancer | Female | >=65 | III/IV | Unknown | Unknown | PD |
| MRPL44 | deletion | Frame_Shift_Del | novel | c.434_437delNNNN | p.Tyr145Ter | p.Y145* | Q9H9J2 | protein_coding | TCGA-C5-A7CO-01 | Cervix | cervical & endocervical cancer | Female | >=65 | I/II | Chemotherapy | cisplatin | SD | ||
| MRPL44 | SNV | Missense_Mutation | rs534596036 | c.38N>G | p.His13Arg | p.H13R | Q9H9J2 | protein_coding | tolerated_low_confidence(0.13) | benign(0) | TCGA-AA-3715-01 | Colorectum | colon adenocarcinoma | Male | >=65 | I/II | Unknown | Unknown | PD |
| MRPL44 | SNV | Missense_Mutation | c.98N>G | p.Lys33Arg | p.K33R | Q9H9J2 | protein_coding | tolerated(0.88) | possibly_damaging(0.501) | TCGA-AA-3811-01 | Colorectum | colon adenocarcinoma | Female | >=65 | III/IV | Unknown | Unknown | PD | |
| MRPL44 | SNV | Missense_Mutation | c.402G>T | p.Gln134His | p.Q134H | Q9H9J2 | protein_coding | tolerated(0.3) | benign(0) | TCGA-AA-3977-01 | Colorectum | colon adenocarcinoma | Male | >=65 | I/II | Unknown | Unknown | SD | |
| MRPL44 | SNV | Missense_Mutation | novel | c.284N>A | p.Ser95Asn | p.S95N | Q9H9J2 | protein_coding | tolerated(0.49) | benign(0.001) | TCGA-AZ-4315-01 | Colorectum | colon adenocarcinoma | Male | <65 | I/II | Unknown | Unknown | SD |
| Page: 1 2 3 4 |
Top |
Related drugs of malignant transformation related genes |
| Identification of chemicals and drugs interact with genes involved in malignant transfromation |
| (DGIdb 4.0) |
| Entrez ID | Symbol | Category | Interaction Types | Drug Claim Name | Drug Name | PMIDs |
| Page: 1 |

Copyright 2023-Present -The University of Texas Health Science Center at Houston |