
|
|||||
|
 | |
| |
| |
| |
| |
| |
|
Gene: MRPL41 |
Gene summary for MRPL41 |
| Gene information | Species | Human | Gene symbol | MRPL41 | Gene ID | 64975 |
| Gene name | mitochondrial ribosomal protein L41 | |
| Gene Alias | BMRP | |
| Cytomap | 9q34.3 | |
| Gene Type | protein-coding | GO ID | GO:0006412 | UniProtAcc | Q8IXM3 |
Top |
Malignant transformation analysis |
| Identification of the aberrant gene expression in precancerous and cancerous lesions by comparing the gene expression of stem-like cells in diseased tissues with normal stem cells |
| Entrez ID | Symbol | Replicates | Species | Organ | Tissue | Adj P-value | Log2FC | Malignancy |
| 64975 | MRPL41 | GSM4909287 | Human | Breast | IDC | 4.21e-03 | -2.60e-01 | 0.2057 |
| 64975 | MRPL41 | GSM4909290 | Human | Breast | IDC | 2.79e-14 | 5.41e-01 | 0.2096 |
| 64975 | MRPL41 | GSM4909291 | Human | Breast | IDC | 9.82e-08 | 4.38e-01 | 0.1753 |
| 64975 | MRPL41 | GSM4909293 | Human | Breast | IDC | 2.75e-20 | 5.30e-01 | 0.1581 |
| 64975 | MRPL41 | GSM4909294 | Human | Breast | IDC | 6.65e-22 | 4.96e-01 | 0.2022 |
| 64975 | MRPL41 | GSM4909296 | Human | Breast | IDC | 2.77e-08 | 1.94e-01 | 0.1524 |
| 64975 | MRPL41 | GSM4909297 | Human | Breast | IDC | 2.52e-10 | -1.80e-01 | 0.1517 |
| 64975 | MRPL41 | GSM4909301 | Human | Breast | IDC | 7.77e-10 | 3.50e-01 | 0.1577 |
| 64975 | MRPL41 | GSM4909306 | Human | Breast | IDC | 1.58e-03 | 3.38e-01 | 0.1564 |
| 64975 | MRPL41 | GSM4909308 | Human | Breast | IDC | 2.99e-04 | 3.33e-01 | 0.158 |
| 64975 | MRPL41 | GSM4909311 | Human | Breast | IDC | 1.50e-28 | -2.08e-01 | 0.1534 |
| 64975 | MRPL41 | GSM4909312 | Human | Breast | IDC | 3.13e-10 | -1.25e-01 | 0.1552 |
| 64975 | MRPL41 | GSM4909313 | Human | Breast | IDC | 4.46e-04 | 8.76e-02 | 0.0391 |
| 64975 | MRPL41 | GSM4909315 | Human | Breast | IDC | 7.58e-06 | 3.76e-01 | 0.21 |
| 64975 | MRPL41 | GSM4909316 | Human | Breast | IDC | 3.68e-09 | 4.11e-01 | 0.21 |
| 64975 | MRPL41 | GSM4909319 | Human | Breast | IDC | 1.44e-35 | -3.48e-01 | 0.1563 |
| 64975 | MRPL41 | GSM4909320 | Human | Breast | IDC | 1.05e-06 | -2.24e-01 | 0.1575 |
| 64975 | MRPL41 | GSM4909321 | Human | Breast | IDC | 3.19e-14 | -7.75e-02 | 0.1559 |
| 64975 | MRPL41 | brca2 | Human | Breast | Precancer | 1.25e-04 | 2.30e-01 | -0.024 |
| 64975 | MRPL41 | NCCBC14 | Human | Breast | DCIS | 1.21e-10 | 2.44e-02 | 0.2021 |
| Page: 1 2 3 4 5 6 7 8 9 10 11 12 13 14 |
| Tissue | Expression Dynamics | Abbreviation |
| Breast |  | IDC: Invasive ductal carcinoma |
| DCIS: Ductal carcinoma in situ | ||
| Precancer(BRCA1-mut): Precancerous lesion from BRCA1 mutation carriers | ||
| Cervix |  | CC: Cervix cancer |
| HSIL_HPV: HPV-infected high-grade squamous intraepithelial lesions | ||
| N_HPV: HPV-infected normal cervix | ||
| Colorectum (GSE201348) |  | FAP: Familial adenomatous polyposis |
| CRC: Colorectal cancer | ||
| Colorectum (HTA11) |  | AD: Adenomas |
| SER: Sessile serrated lesions | ||
| MSI-H: Microsatellite-high colorectal cancer | ||
| MSS: Microsatellite stable colorectal cancer | ||
| Endometrium | 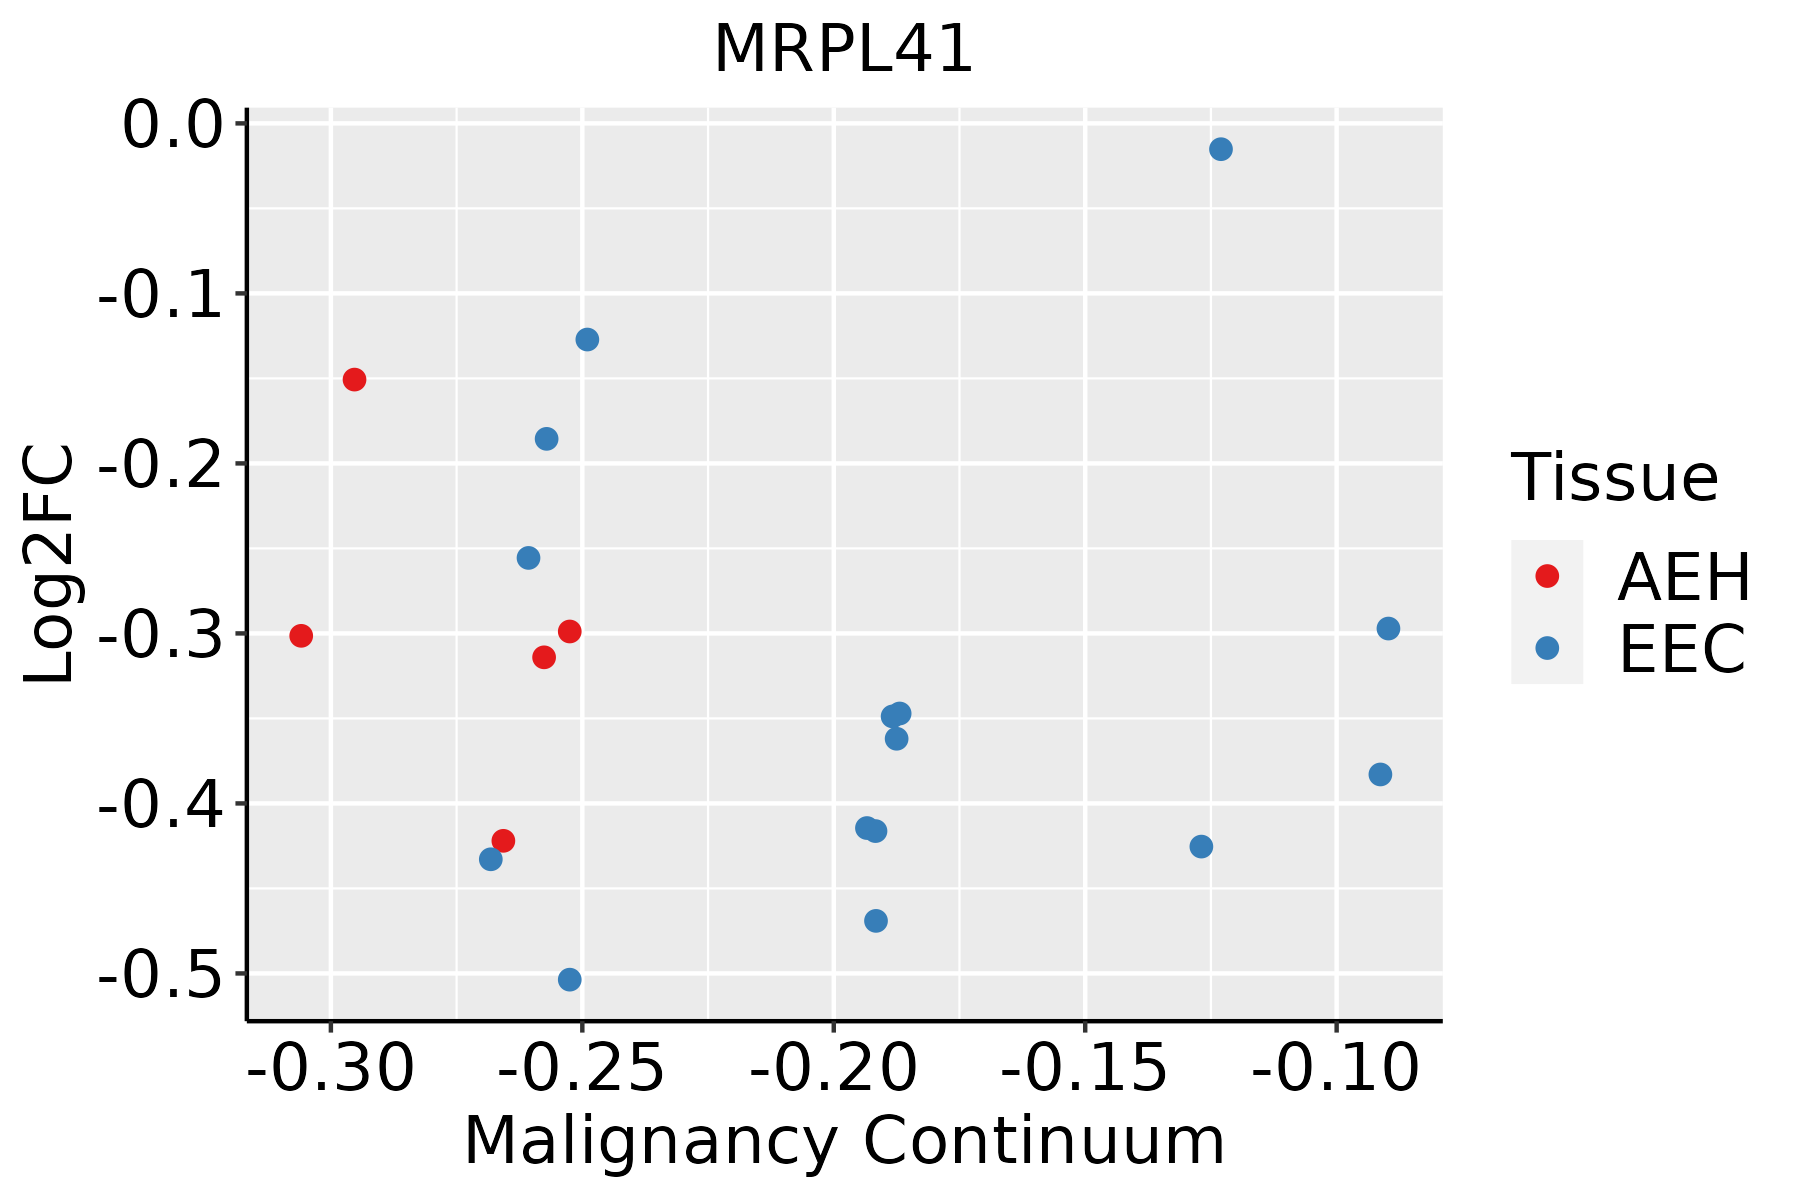 | AEH: Atypical endometrial hyperplasia |
| EEC: Endometrioid Cancer | ||
| Esophagus |  | ESCC: Esophageal squamous cell carcinoma |
| HGIN: High-grade intraepithelial neoplasias | ||
| LGIN: Low-grade intraepithelial neoplasias | ||
| GC | 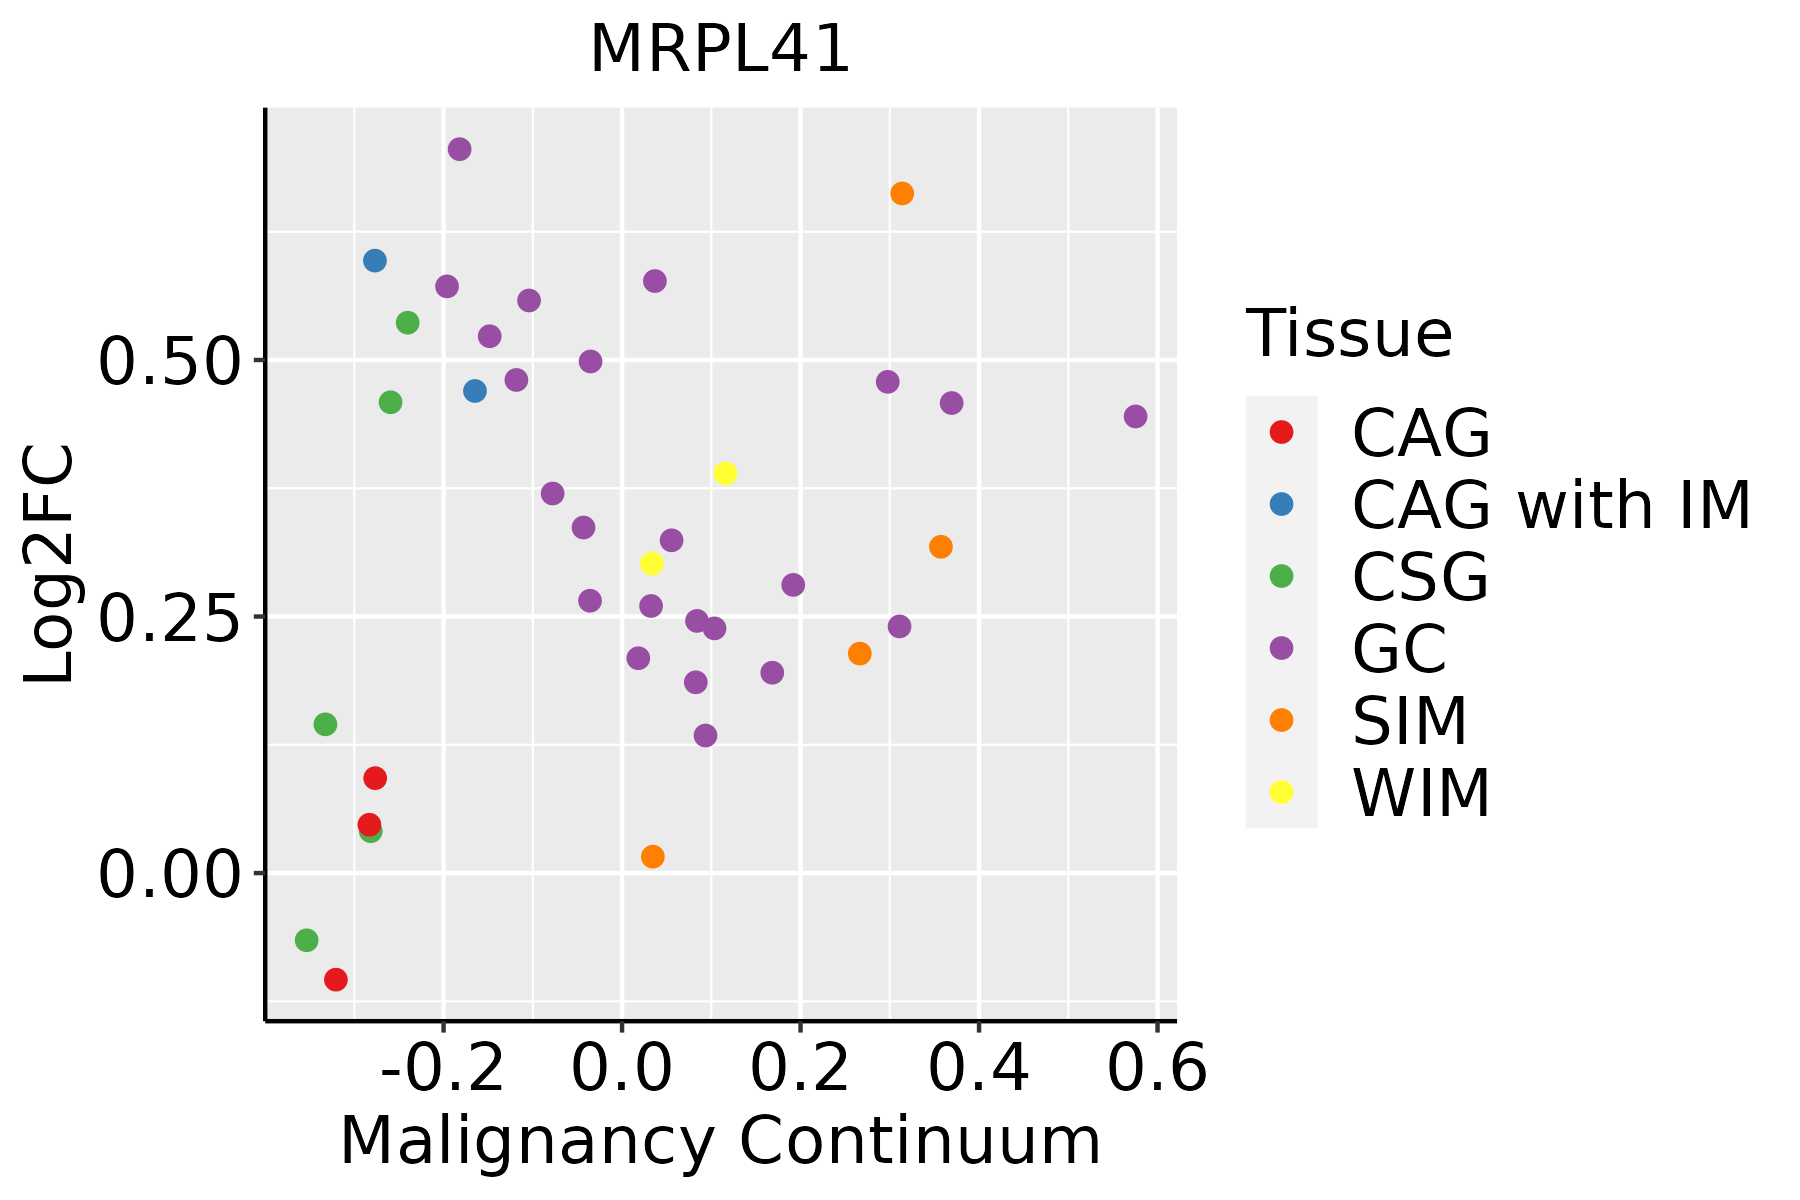 | CAG: Chronic atrophic gastritis |
| CAG with IM: Chronic atrophic gastritis with intestinal metaplasia | ||
| CSG: Chronic superficial gastritis | ||
| GC: Gastric cancer | ||
| SIM: Severe intestinal metaplasia | ||
| WIM: Wild intestinal metaplasia | ||
| Liver | 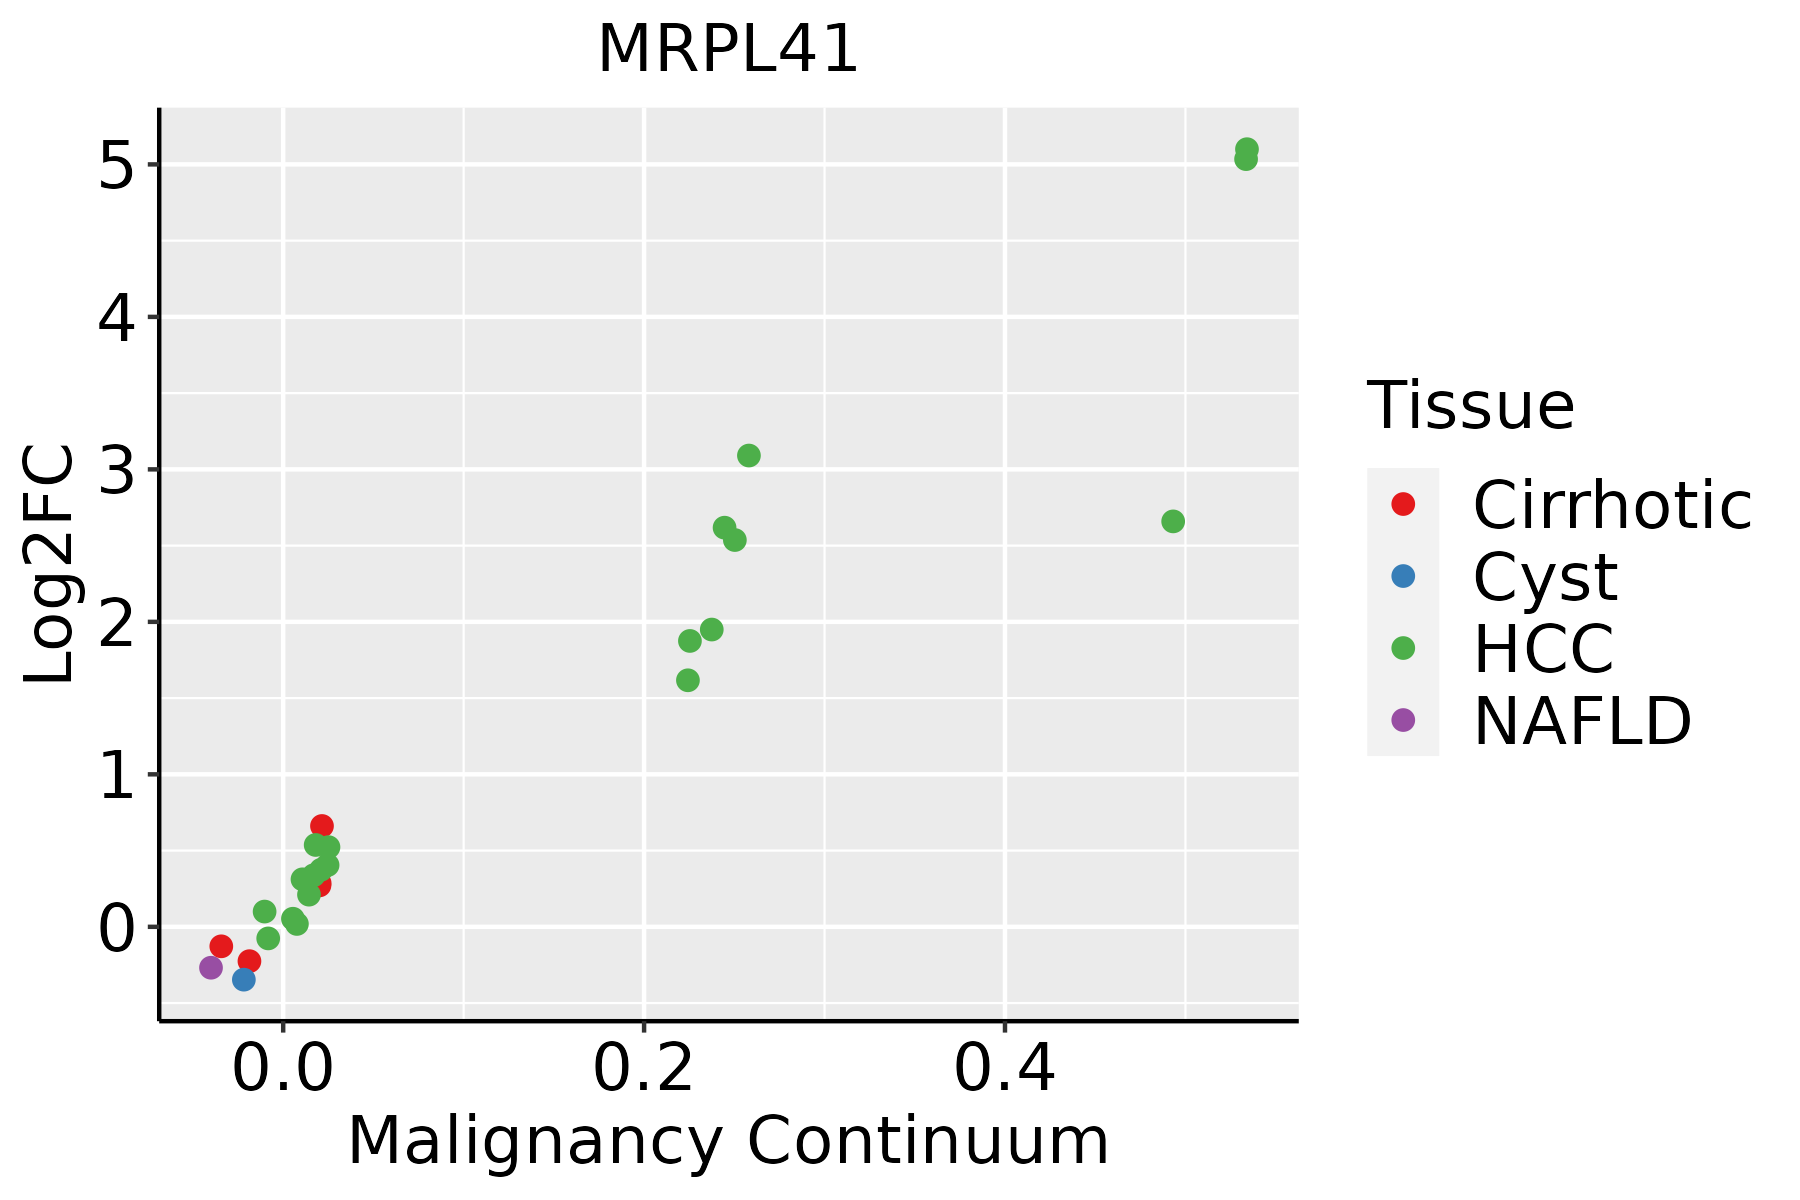 | HCC: Hepatocellular carcinoma |
| NAFLD: Non-alcoholic fatty liver disease | ||
| Oral Cavity | 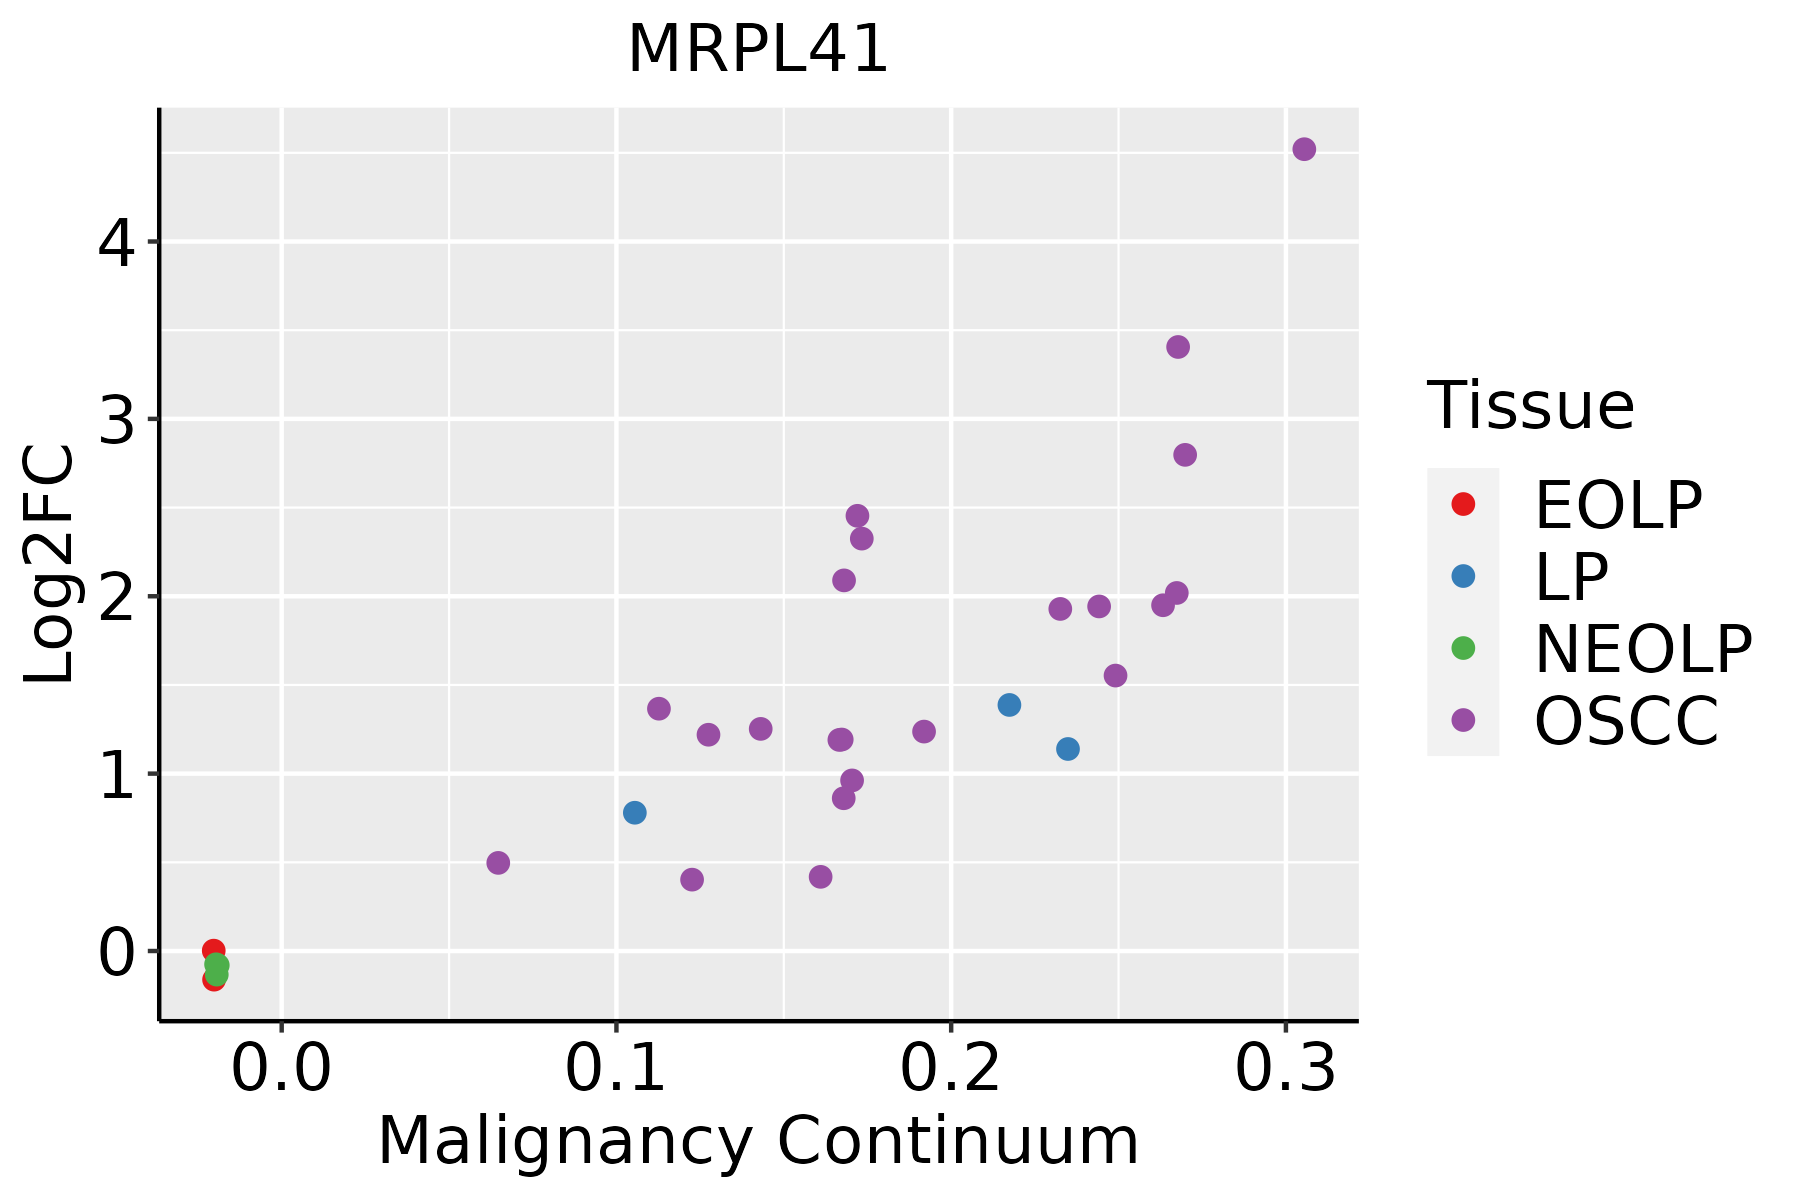 | EOLP: Erosive Oral lichen planus |
| LP: leukoplakia | ||
| NEOLP: Non-erosive oral lichen planus | ||
| OSCC: Oral squamous cell carcinoma | ||
| Prostate | 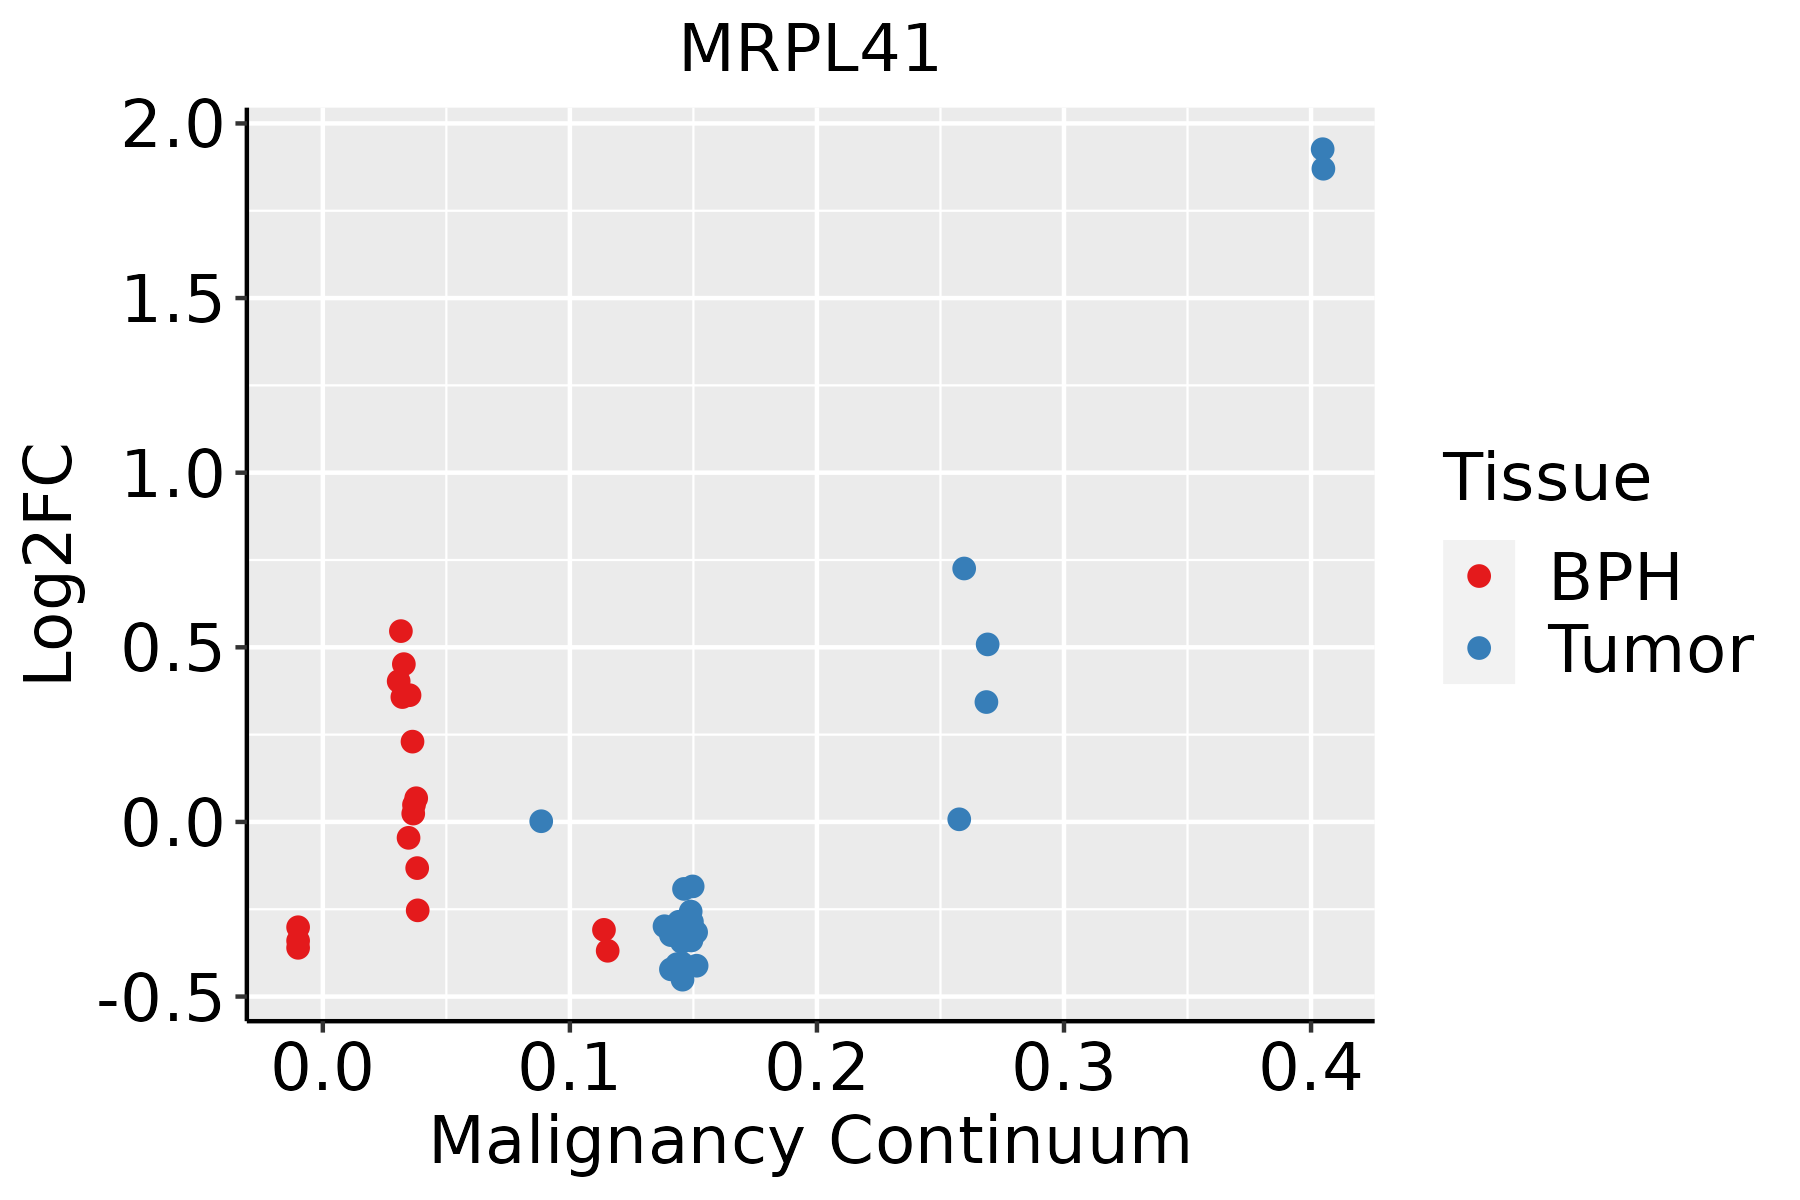 | BPH: Benign Prostatic Hyperplasia |
| Skin |  | AK: Actinic keratosis |
| cSCC: Cutaneous squamous cell carcinoma | ||
| SCCIS:squamous cell carcinoma in situ | ||
| Thyroid |  | ATC: Anaplastic thyroid cancer |
| HT: Hashimoto's thyroiditis | ||
| PTC: Papillary thyroid cancer |
| ∗log2FC in expression of this searched gene in stem-like cells from each diseased tissue sample relative to stem-like cells in normal samples in each tissue plotted against the malignancy continuum. Samples are colored based on if they are from different disease stage. |
Top |
Malignant transformation related pathway analysis |
| Find out the enriched GO biological processes and KEGG pathways involved in transition from healthy to precancer to cancer |
| Tissue | Disease Stage | Enriched GO biological Processes |
| Colorectum | AD |  |
| Colorectum | SER |  |
| Colorectum | MSS |  |
| Colorectum | MSI-H |  |
| Colorectum | FAP |  |
| ∗Top 15 enriched GO BP terms are showed in the bar plot of each disease state in each tissue. Each row represents a significant GO biological process which is colored according to the -log10(p.adjust). |
| Page: 1 2 3 4 5 6 7 8 9 |
| GO ID | Tissue | Disease Stage | Description | Gene Ratio | Bg Ratio | pvalue | p.adjust | Count |
| Page: 1 |
| Pathway ID | Tissue | Disease Stage | Description | Gene Ratio | Bg Ratio | pvalue | p.adjust | qvalue | Count |
| Page: 1 |
Top |
Cell-cell communication analysis |
| Identification of potential cell-cell interactions between two cell types and their ligand-receptor pairs for different disease states |
| Ligand | Receptor | LRpair | Pathway | Tissue | Disease Stage |
| Page: 1 |
Top |
Single-cell gene regulatory network inference analysis |
| Find out the significant the regulons (TFs) and the target genes of each regulon across cell types for different disease states |
| TF | Cell Type | Tissue | Disease Stage | Target Gene | RSS | Regulon Activity |
| ∗The dot plots of a searched regulon are shown for all cell subpopulations in each disease state of each tissue based on the regulon specific score inferred using pySCENIC and by calculating the average expression. |
| Page: 1 |
Top |
Somatic mutation of malignant transformation related genes |
| Annotation of somatic variants for genes involved in malignant transformation |
| Hugo Symbol | Variant Class | Variant Classification | dbSNP RS | HGVSc | HGVSp | HGVSp Short | SWISSPROT | BIOTYPE | SIFT | PolyPhen | Tumor Sample Barcode | Tissue | Histology | Sex | Age | Stage | Therapy Types | Drugs | Outcome |
| MRPL41 | insertion | In_Frame_Ins | novel | c.250_251insGAG | p.Thr84delinsArgAla | p.T84delinsRA | Q8IXM3 | protein_coding | TCGA-DS-A1OD-01 | Cervix | cervical & endocervical cancer | Female | <65 | I/II | Chemotherapy | cisplatin | SD | ||
| MRPL41 | SNV | Missense_Mutation | rs376218719 | c.156G>T | p.Gln52His | p.Q52H | Q8IXM3 | protein_coding | tolerated(0.12) | possibly_damaging(0.67) | TCGA-4T-AA8H-01 | Colorectum | colon adenocarcinoma | Female | <65 | I/II | Unknown | Unknown | SD |
| MRPL41 | SNV | Missense_Mutation | novel | c.352N>T | p.Gly118Cys | p.G118C | Q8IXM3 | protein_coding | deleterious(0.01) | probably_damaging(1) | TCGA-AJ-A3EK-01 | Endometrium | uterine corpus endometrioid carcinoma | Female | <65 | I/II | Chemotherapy | carboplatin | CR |
| MRPL41 | SNV | Missense_Mutation | c.207N>T | p.Lys69Asn | p.K69N | Q8IXM3 | protein_coding | tolerated(0.08) | benign(0.045) | TCGA-BS-A0UF-01 | Endometrium | uterine corpus endometrioid carcinoma | Female | >=65 | I/II | Unknown | Unknown | SD | |
| MRPL41 | SNV | Missense_Mutation | rs773179110 | c.169N>A | p.Val57Ile | p.V57I | Q8IXM3 | protein_coding | tolerated(1) | benign(0.047) | TCGA-EO-A22U-01 | Endometrium | uterine corpus endometrioid carcinoma | Female | >=65 | I/II | Unknown | Unknown | SD |
| MRPL41 | SNV | Missense_Mutation | novel | c.296N>T | p.Ala99Val | p.A99V | Q8IXM3 | protein_coding | deleterious(0.02) | benign(0.412) | TCGA-EY-A215-01 | Endometrium | uterine corpus endometrioid carcinoma | Female | <65 | I/II | Unknown | Unknown | SD |
| MRPL41 | SNV | Missense_Mutation | c.307N>T | p.Asp103Tyr | p.D103Y | Q8IXM3 | protein_coding | deleterious(0) | probably_damaging(1) | TCGA-33-4586-01 | Lung | lung squamous cell carcinoma | Male | <65 | III/IV | Unknown | Unknown | PD | |
| MRPL41 | SNV | Missense_Mutation | novel | c.275N>G | p.Phe92Cys | p.F92C | Q8IXM3 | protein_coding | deleterious(0) | probably_damaging(0.993) | TCGA-BA-6868-01 | Oral cavity | head & neck squamous cell carcinoma | Male | <65 | I/II | Chemotherapy | carboplatin | PD |
| MRPL41 | SNV | Missense_Mutation | novel | c.358N>C | p.Glu120Gln | p.E120Q | Q8IXM3 | protein_coding | tolerated(0.06) | probably_damaging(0.979) | TCGA-CV-7427-01 | Oral cavity | head & neck squamous cell carcinoma | Female | >=65 | I/II | Unknown | Unknown | PD |
| MRPL41 | SNV | Missense_Mutation | rs773179110 | c.169G>A | p.Val57Ile | p.V57I | Q8IXM3 | protein_coding | tolerated(1) | benign(0.047) | TCGA-XK-AAIW-01 | Prostate | prostate adenocarcinoma | Male | >=65 | 9 | Unknown | Unknown | PD |
| Page: 1 2 |
Top |
Related drugs of malignant transformation related genes |
| Identification of chemicals and drugs interact with genes involved in malignant transfromation |
| (DGIdb 4.0) |
| Entrez ID | Symbol | Category | Interaction Types | Drug Claim Name | Drug Name | PMIDs |
| Page: 1 |

Copyright 2023-Present -The University of Texas Health Science Center at Houston |