
|
|||||
|
 | |
| |
| |
| |
| |
| |
|
Gene: MRPL40 |
Gene summary for MRPL40 |
| Gene information | Species | Human | Gene symbol | MRPL40 | Gene ID | 64976 |
| Gene name | mitochondrial ribosomal protein L40 | |
| Gene Alias | L40mt | |
| Cytomap | 22q11.21 | |
| Gene Type | protein-coding | GO ID | GO:0008150 | UniProtAcc | Q9NQ50 |
Top |
Malignant transformation analysis |
| Identification of the aberrant gene expression in precancerous and cancerous lesions by comparing the gene expression of stem-like cells in diseased tissues with normal stem cells |
| Entrez ID | Symbol | Replicates | Species | Organ | Tissue | Adj P-value | Log2FC | Malignancy |
| 64976 | MRPL40 | LZE2T | Human | Esophagus | ESCC | 4.46e-04 | 6.83e-01 | 0.082 |
| 64976 | MRPL40 | LZE4T | Human | Esophagus | ESCC | 1.32e-11 | 4.35e-01 | 0.0811 |
| 64976 | MRPL40 | LZE5T | Human | Esophagus | ESCC | 3.31e-03 | 4.79e-01 | 0.0514 |
| 64976 | MRPL40 | LZE7T | Human | Esophagus | ESCC | 4.86e-05 | 4.05e-01 | 0.0667 |
| 64976 | MRPL40 | LZE8T | Human | Esophagus | ESCC | 2.17e-05 | 2.13e-01 | 0.067 |
| 64976 | MRPL40 | LZE20T | Human | Esophagus | ESCC | 9.86e-04 | 1.78e-01 | 0.0662 |
| 64976 | MRPL40 | LZE22D1 | Human | Esophagus | HGIN | 2.04e-04 | 2.37e-01 | 0.0595 |
| 64976 | MRPL40 | LZE22T | Human | Esophagus | ESCC | 4.75e-05 | 5.01e-01 | 0.068 |
| 64976 | MRPL40 | LZE24T | Human | Esophagus | ESCC | 8.65e-21 | 8.58e-01 | 0.0596 |
| 64976 | MRPL40 | LZE21T | Human | Esophagus | ESCC | 2.96e-05 | 5.69e-01 | 0.0655 |
| 64976 | MRPL40 | LZE6T | Human | Esophagus | ESCC | 3.05e-07 | 5.23e-01 | 0.0845 |
| 64976 | MRPL40 | P1T-E | Human | Esophagus | ESCC | 3.90e-13 | 7.60e-01 | 0.0875 |
| 64976 | MRPL40 | P2T-E | Human | Esophagus | ESCC | 5.26e-29 | 5.07e-01 | 0.1177 |
| 64976 | MRPL40 | P4T-E | Human | Esophagus | ESCC | 1.77e-50 | 1.43e+00 | 0.1323 |
| 64976 | MRPL40 | P5T-E | Human | Esophagus | ESCC | 2.72e-79 | 1.66e+00 | 0.1327 |
| 64976 | MRPL40 | P8T-E | Human | Esophagus | ESCC | 2.82e-28 | 5.72e-01 | 0.0889 |
| 64976 | MRPL40 | P9T-E | Human | Esophagus | ESCC | 2.61e-46 | 1.08e+00 | 0.1131 |
| 64976 | MRPL40 | P10T-E | Human | Esophagus | ESCC | 1.90e-91 | 1.59e+00 | 0.116 |
| 64976 | MRPL40 | P11T-E | Human | Esophagus | ESCC | 9.80e-22 | 9.42e-01 | 0.1426 |
| 64976 | MRPL40 | P12T-E | Human | Esophagus | ESCC | 2.95e-59 | 9.69e-01 | 0.1122 |
| Page: 1 2 3 4 5 6 7 |
| Tissue | Expression Dynamics | Abbreviation |
| Esophagus |  | ESCC: Esophageal squamous cell carcinoma |
| HGIN: High-grade intraepithelial neoplasias | ||
| LGIN: Low-grade intraepithelial neoplasias | ||
| Liver | 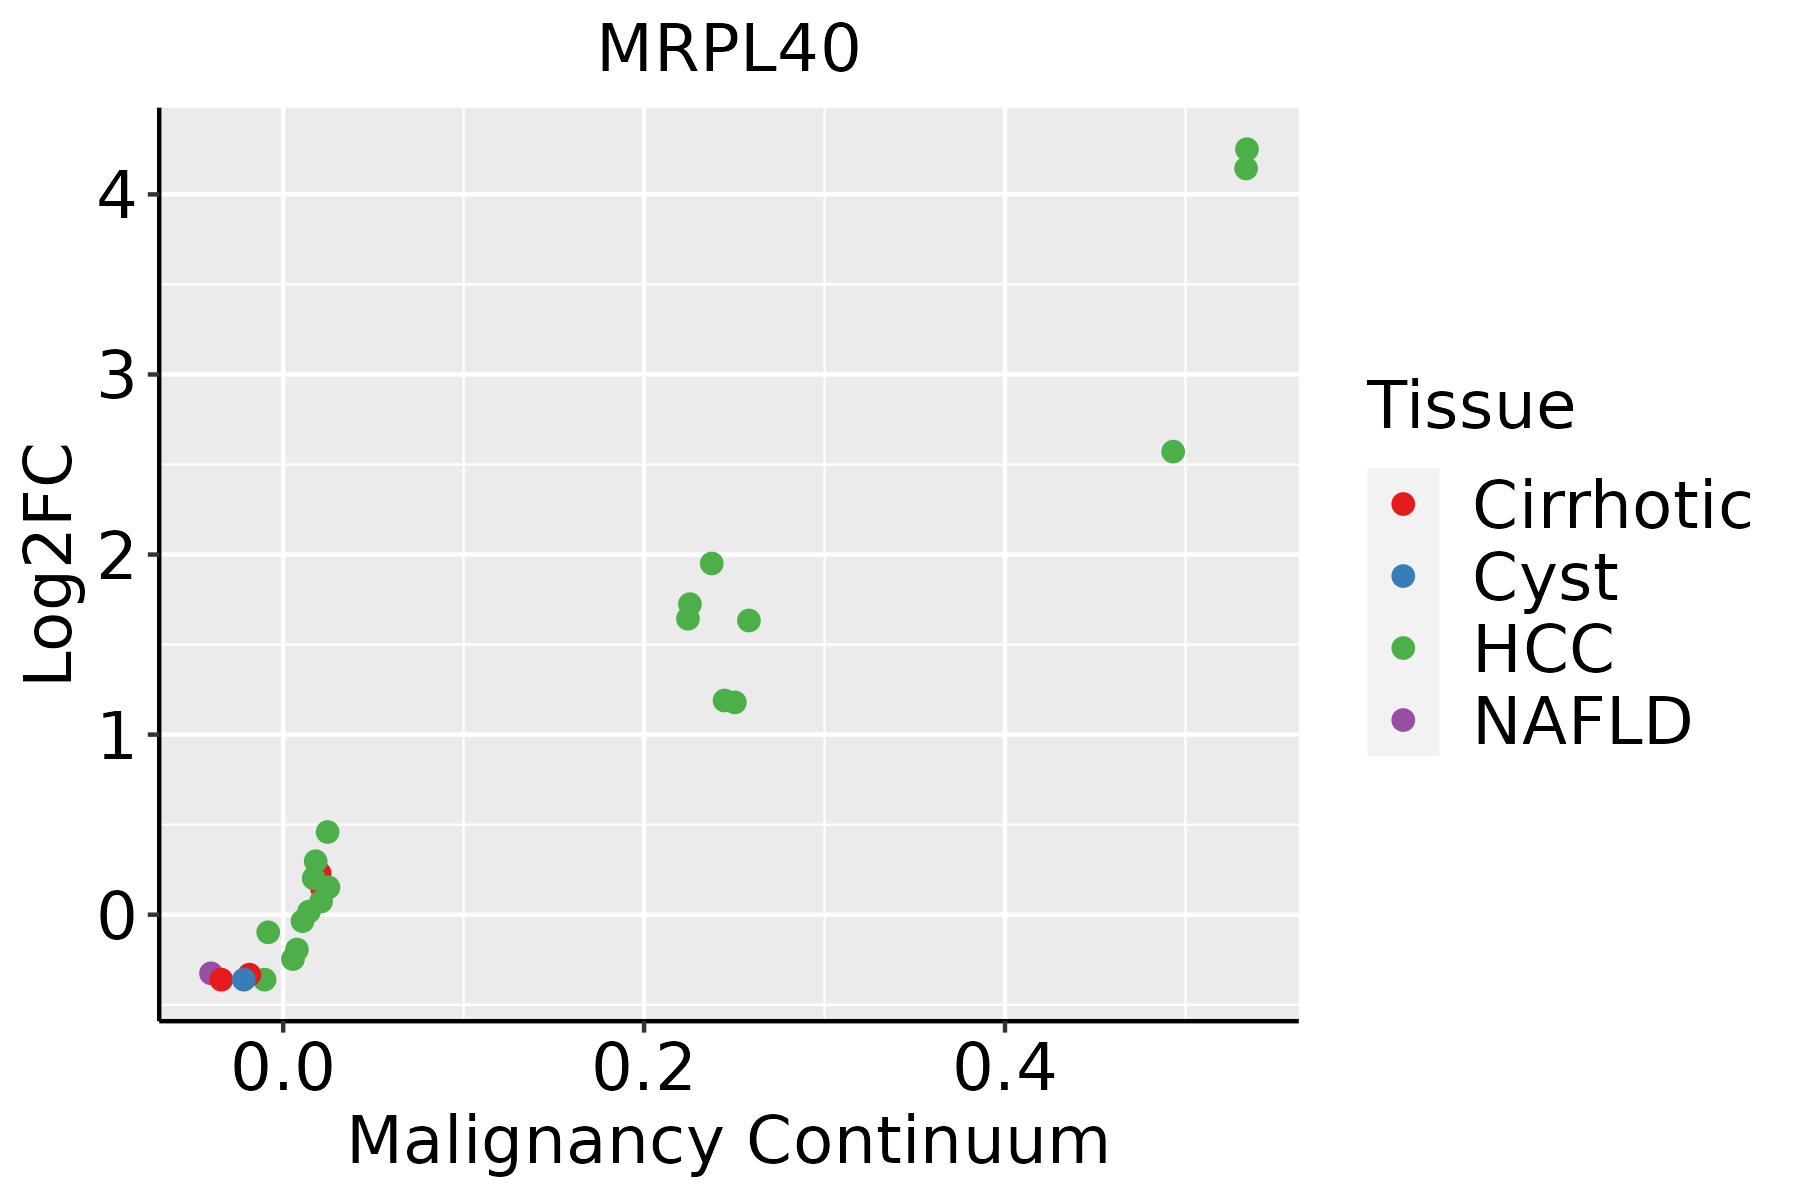 | HCC: Hepatocellular carcinoma |
| NAFLD: Non-alcoholic fatty liver disease | ||
| Oral Cavity | 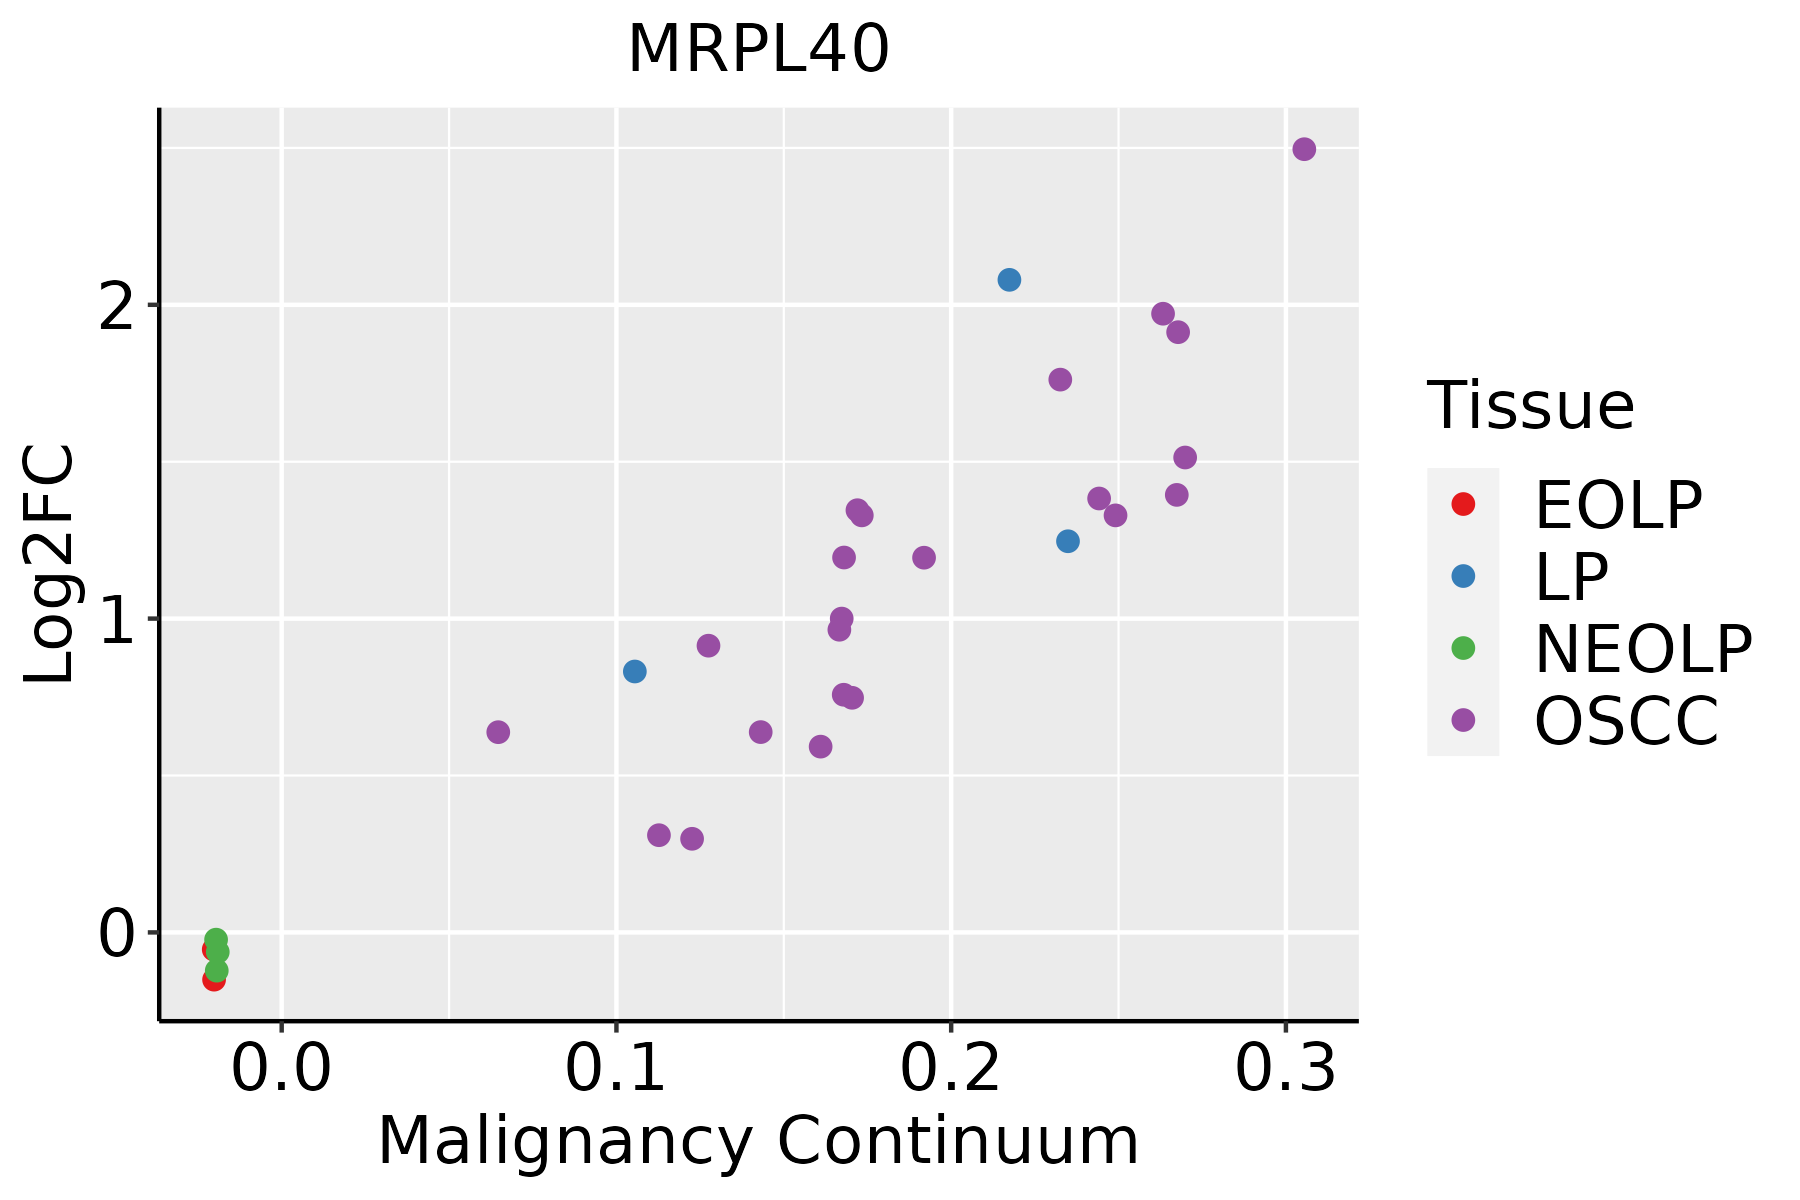 | EOLP: Erosive Oral lichen planus |
| LP: leukoplakia | ||
| NEOLP: Non-erosive oral lichen planus | ||
| OSCC: Oral squamous cell carcinoma | ||
| Prostate |  | BPH: Benign Prostatic Hyperplasia |
| Skin | 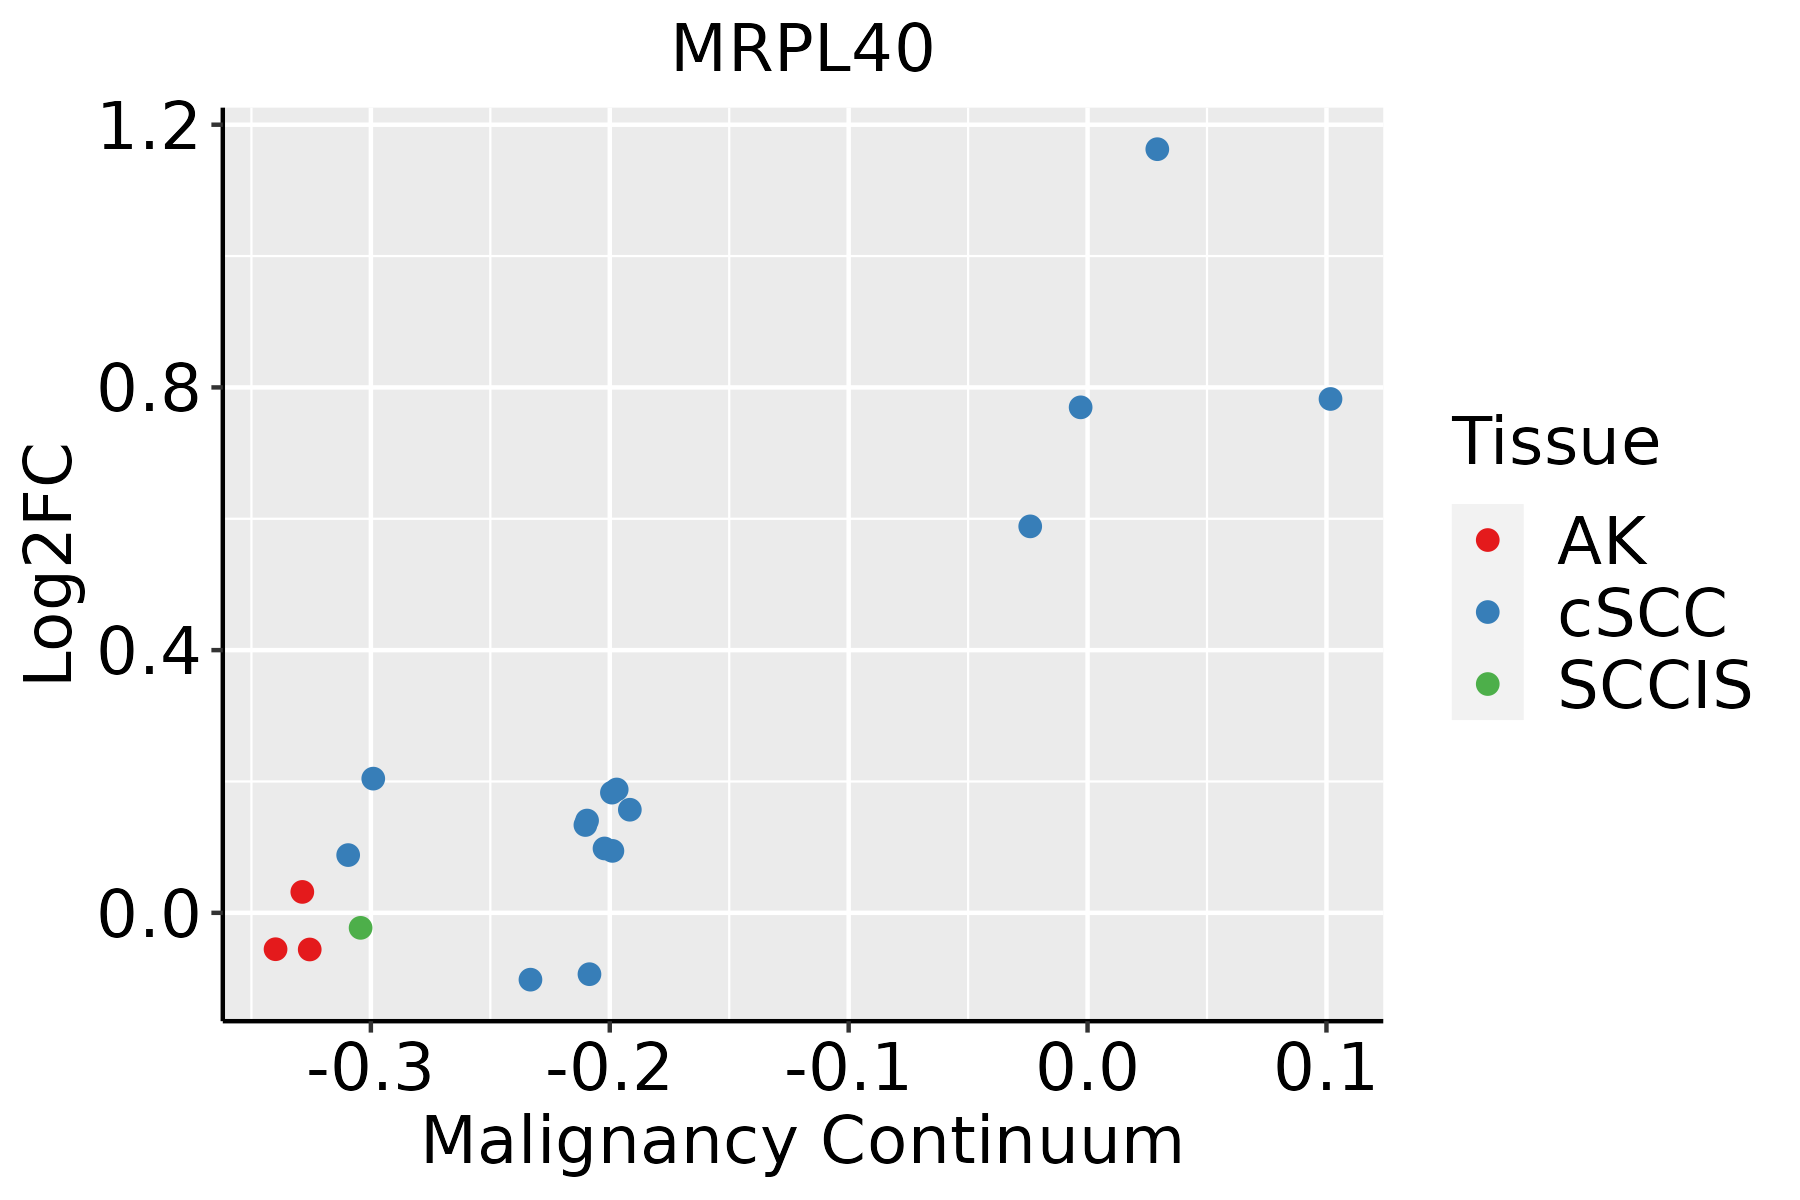 | AK: Actinic keratosis |
| cSCC: Cutaneous squamous cell carcinoma | ||
| SCCIS:squamous cell carcinoma in situ | ||
| Thyroid | 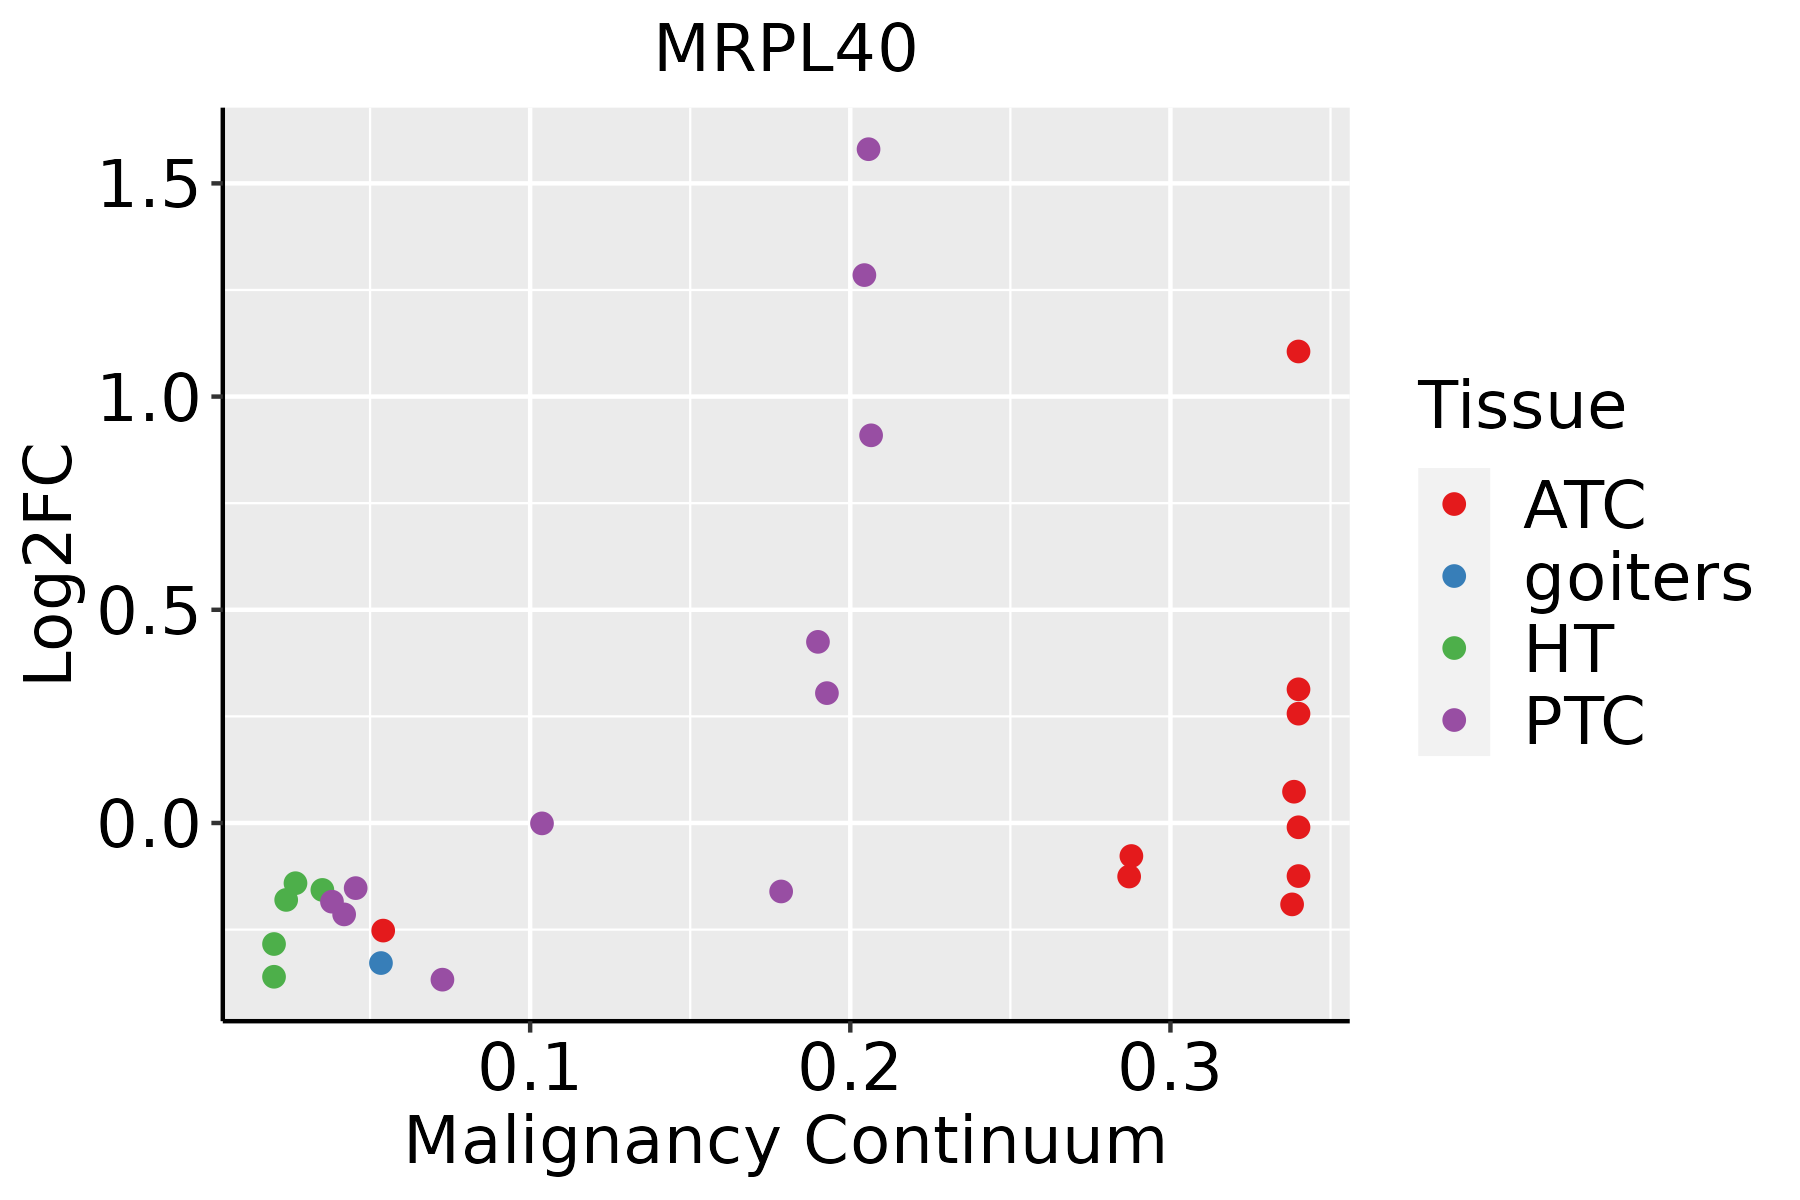 | ATC: Anaplastic thyroid cancer |
| HT: Hashimoto's thyroiditis | ||
| PTC: Papillary thyroid cancer |
| ∗log2FC in expression of this searched gene in stem-like cells from each diseased tissue sample relative to stem-like cells in normal samples in each tissue plotted against the malignancy continuum. Samples are colored based on if they are from different disease stage. |
Top |
Malignant transformation related pathway analysis |
| Find out the enriched GO biological processes and KEGG pathways involved in transition from healthy to precancer to cancer |
| Tissue | Disease Stage | Enriched GO biological Processes |
| Colorectum | AD |  |
| Colorectum | SER |  |
| Colorectum | MSS |  |
| Colorectum | MSI-H |  |
| Colorectum | FAP |  |
| ∗Top 15 enriched GO BP terms are showed in the bar plot of each disease state in each tissue. Each row represents a significant GO biological process which is colored according to the -log10(p.adjust). |
| Page: 1 2 3 4 5 6 7 8 9 |
| GO ID | Tissue | Disease Stage | Description | Gene Ratio | Bg Ratio | pvalue | p.adjust | Count |
| Page: 1 |
| Pathway ID | Tissue | Disease Stage | Description | Gene Ratio | Bg Ratio | pvalue | p.adjust | qvalue | Count |
| Page: 1 |
Top |
Cell-cell communication analysis |
| Identification of potential cell-cell interactions between two cell types and their ligand-receptor pairs for different disease states |
| Ligand | Receptor | LRpair | Pathway | Tissue | Disease Stage |
| Page: 1 |
Top |
Single-cell gene regulatory network inference analysis |
| Find out the significant the regulons (TFs) and the target genes of each regulon across cell types for different disease states |
| TF | Cell Type | Tissue | Disease Stage | Target Gene | RSS | Regulon Activity |
| ∗The dot plots of a searched regulon are shown for all cell subpopulations in each disease state of each tissue based on the regulon specific score inferred using pySCENIC and by calculating the average expression. |
| Page: 1 |
Top |
Somatic mutation of malignant transformation related genes |
| Annotation of somatic variants for genes involved in malignant transformation |
| Hugo Symbol | Variant Class | Variant Classification | dbSNP RS | HGVSc | HGVSp | HGVSp Short | SWISSPROT | BIOTYPE | SIFT | PolyPhen | Tumor Sample Barcode | Tissue | Histology | Sex | Age | Stage | Therapy Types | Drugs | Outcome |
| MRPL40 | SNV | Missense_Mutation | rs141770264 | c.218G>A | p.Arg73Gln | p.R73Q | Q9NQ50 | protein_coding | deleterious(0.01) | possibly_damaging(0.878) | TCGA-AN-A046-01 | Breast | breast invasive carcinoma | Female | >=65 | I/II | Unknown | Unknown | SD |
| MRPL40 | SNV | Missense_Mutation | c.396G>C | p.Glu132Asp | p.E132D | Q9NQ50 | protein_coding | tolerated(0.29) | possibly_damaging(0.807) | TCGA-AN-A0FL-01 | Breast | breast invasive carcinoma | Female | <65 | I/II | Unknown | Unknown | SD | |
| MRPL40 | insertion | In_Frame_Ins | novel | c.131_132insGACTCCGGGCTCGGCCTCCCGCGACCCCTG | p.Pro44_Met45insThrProGlySerAlaSerArgAspProCys | p.P44_M45insTPGSASRDPC | Q9NQ50 | protein_coding | TCGA-AO-A0J5-01 | Breast | breast invasive carcinoma | Female | <65 | III/IV | Other, specify in notesBisphosphonate | zoledronic | PD | ||
| MRPL40 | SNV | Missense_Mutation | novel | c.254N>G | p.Ile85Ser | p.I85S | Q9NQ50 | protein_coding | deleterious(0) | probably_damaging(0.995) | TCGA-CA-6717-01 | Colorectum | colon adenocarcinoma | Male | <65 | I/II | Chemotherapy | oxaliplatin | CR |
| MRPL40 | deletion | Frame_Shift_Del | c.159delN | p.Lys54ArgfsTer3 | p.K54Rfs*3 | Q9NQ50 | protein_coding | TCGA-A6-3809-01 | Colorectum | colon adenocarcinoma | Female | >=65 | I/II | Unknown | Unknown | SD | |||
| MRPL40 | deletion | Frame_Shift_Del | c.175delN | p.Asp61ThrfsTer8 | p.D61Tfs*8 | Q9NQ50 | protein_coding | TCGA-CK-4951-01 | Colorectum | colon adenocarcinoma | Female | >=65 | I/II | Unknown | Unknown | PD | |||
| MRPL40 | SNV | Missense_Mutation | c.272N>A | p.Pro91His | p.P91H | Q9NQ50 | protein_coding | deleterious(0) | probably_damaging(0.992) | TCGA-AP-A051-01 | Endometrium | uterine corpus endometrioid carcinoma | Female | >=65 | I/II | Unknown | Unknown | SD | |
| MRPL40 | SNV | Missense_Mutation | novel | c.146C>A | p.Pro49His | p.P49H | Q9NQ50 | protein_coding | deleterious(0) | possibly_damaging(0.873) | TCGA-AX-A2HD-01 | Endometrium | uterine corpus endometrioid carcinoma | Female | >=65 | III/IV | Unknown | Unknown | SD |
| MRPL40 | SNV | Missense_Mutation | c.199N>T | p.Arg67Cys | p.R67C | Q9NQ50 | protein_coding | deleterious(0.05) | probably_damaging(0.989) | TCGA-D1-A167-01 | Endometrium | uterine corpus endometrioid carcinoma | Female | >=65 | I/II | Unknown | Unknown | SD | |
| MRPL40 | SNV | Missense_Mutation | rs749850298 | c.259N>T | p.Asp87Tyr | p.D87Y | Q9NQ50 | protein_coding | deleterious(0) | probably_damaging(0.999) | TCGA-E6-A1LX-01 | Endometrium | uterine corpus endometrioid carcinoma | Female | <65 | I/II | Unknown | Unknown | SD |
| Page: 1 2 |
Top |
Related drugs of malignant transformation related genes |
| Identification of chemicals and drugs interact with genes involved in malignant transfromation |
| (DGIdb 4.0) |
| Entrez ID | Symbol | Category | Interaction Types | Drug Claim Name | Drug Name | PMIDs |
| Page: 1 |

Copyright 2023-Present -The University of Texas Health Science Center at Houston |