
|
|||||
|
 | |
| |
| |
| |
| |
| |
|
Gene: MRPL39 |
Gene summary for MRPL39 |
| Gene information | Species | Human | Gene symbol | MRPL39 | Gene ID | 54148 |
| Gene name | mitochondrial ribosomal protein L39 | |
| Gene Alias | C21orf92 | |
| Cytomap | 21q21.3 | |
| Gene Type | protein-coding | GO ID | GO:0000313 | UniProtAcc | Q9NYK5 |
Top |
Malignant transformation analysis |
| Identification of the aberrant gene expression in precancerous and cancerous lesions by comparing the gene expression of stem-like cells in diseased tissues with normal stem cells |
| Entrez ID | Symbol | Replicates | Species | Organ | Tissue | Adj P-value | Log2FC | Malignancy |
| 54148 | MRPL39 | LZE4T | Human | Esophagus | ESCC | 4.62e-08 | 1.38e-01 | 0.0811 |
| 54148 | MRPL39 | LZE7T | Human | Esophagus | ESCC | 2.43e-04 | 1.92e-01 | 0.0667 |
| 54148 | MRPL39 | LZE24T | Human | Esophagus | ESCC | 2.23e-13 | 3.47e-01 | 0.0596 |
| 54148 | MRPL39 | P1T-E | Human | Esophagus | ESCC | 2.39e-06 | 1.67e-01 | 0.0875 |
| 54148 | MRPL39 | P2T-E | Human | Esophagus | ESCC | 9.29e-24 | 3.54e-01 | 0.1177 |
| 54148 | MRPL39 | P4T-E | Human | Esophagus | ESCC | 5.20e-34 | 8.64e-01 | 0.1323 |
| 54148 | MRPL39 | P5T-E | Human | Esophagus | ESCC | 2.81e-28 | 5.02e-01 | 0.1327 |
| 54148 | MRPL39 | P8T-E | Human | Esophagus | ESCC | 1.03e-16 | 2.43e-01 | 0.0889 |
| 54148 | MRPL39 | P9T-E | Human | Esophagus | ESCC | 1.04e-09 | 2.22e-01 | 0.1131 |
| 54148 | MRPL39 | P10T-E | Human | Esophagus | ESCC | 2.13e-24 | 3.81e-01 | 0.116 |
| 54148 | MRPL39 | P11T-E | Human | Esophagus | ESCC | 5.28e-10 | 2.75e-01 | 0.1426 |
| 54148 | MRPL39 | P12T-E | Human | Esophagus | ESCC | 1.96e-27 | 4.40e-01 | 0.1122 |
| 54148 | MRPL39 | P15T-E | Human | Esophagus | ESCC | 8.09e-12 | 1.89e-01 | 0.1149 |
| 54148 | MRPL39 | P16T-E | Human | Esophagus | ESCC | 3.66e-33 | 4.47e-01 | 0.1153 |
| 54148 | MRPL39 | P17T-E | Human | Esophagus | ESCC | 1.07e-05 | 2.55e-01 | 0.1278 |
| 54148 | MRPL39 | P19T-E | Human | Esophagus | ESCC | 1.72e-07 | 4.44e-01 | 0.1662 |
| 54148 | MRPL39 | P20T-E | Human | Esophagus | ESCC | 4.24e-14 | 1.70e-01 | 0.1124 |
| 54148 | MRPL39 | P21T-E | Human | Esophagus | ESCC | 6.06e-29 | 4.86e-01 | 0.1617 |
| 54148 | MRPL39 | P22T-E | Human | Esophagus | ESCC | 1.99e-28 | 3.80e-01 | 0.1236 |
| 54148 | MRPL39 | P23T-E | Human | Esophagus | ESCC | 1.62e-21 | 2.82e-01 | 0.108 |
| Page: 1 2 3 4 5 |
| Tissue | Expression Dynamics | Abbreviation |
| Esophagus | 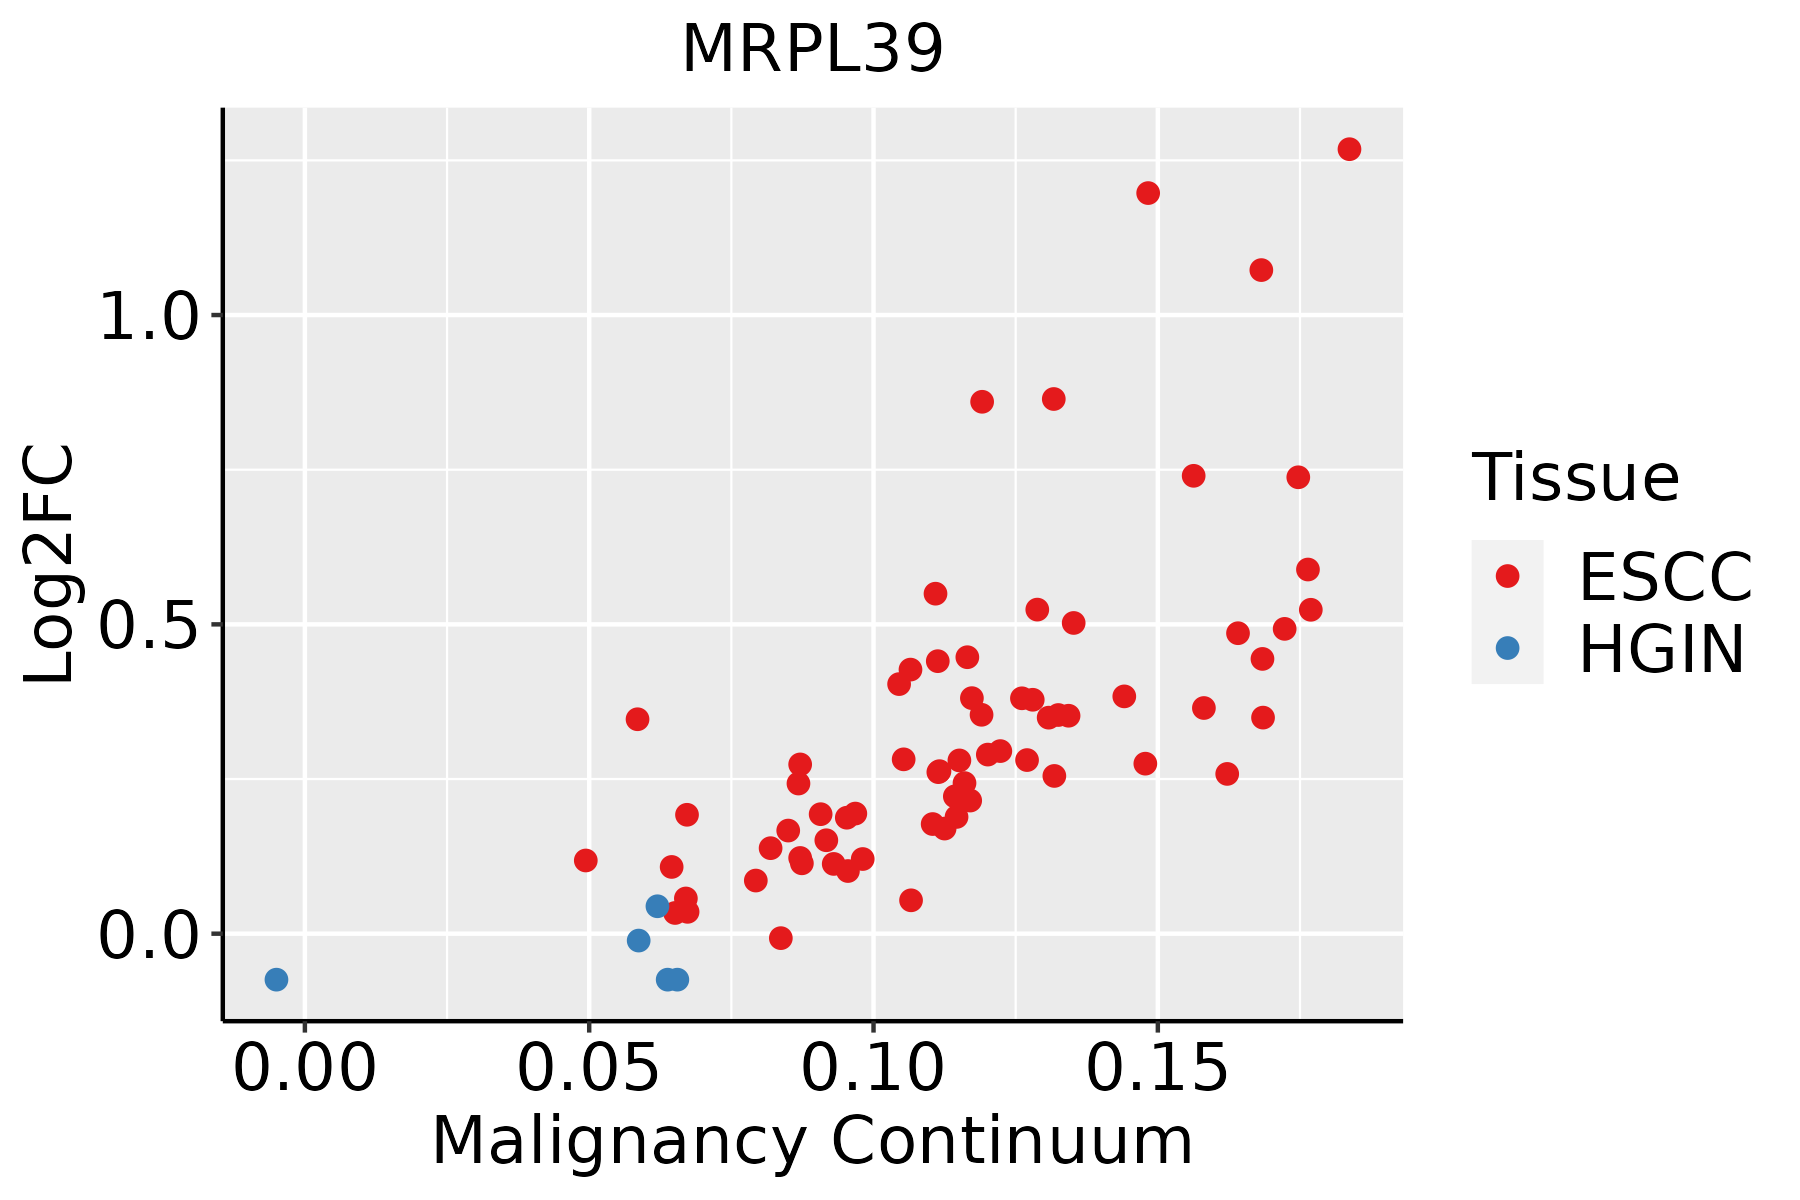 | ESCC: Esophageal squamous cell carcinoma |
| HGIN: High-grade intraepithelial neoplasias | ||
| LGIN: Low-grade intraepithelial neoplasias | ||
| Liver | 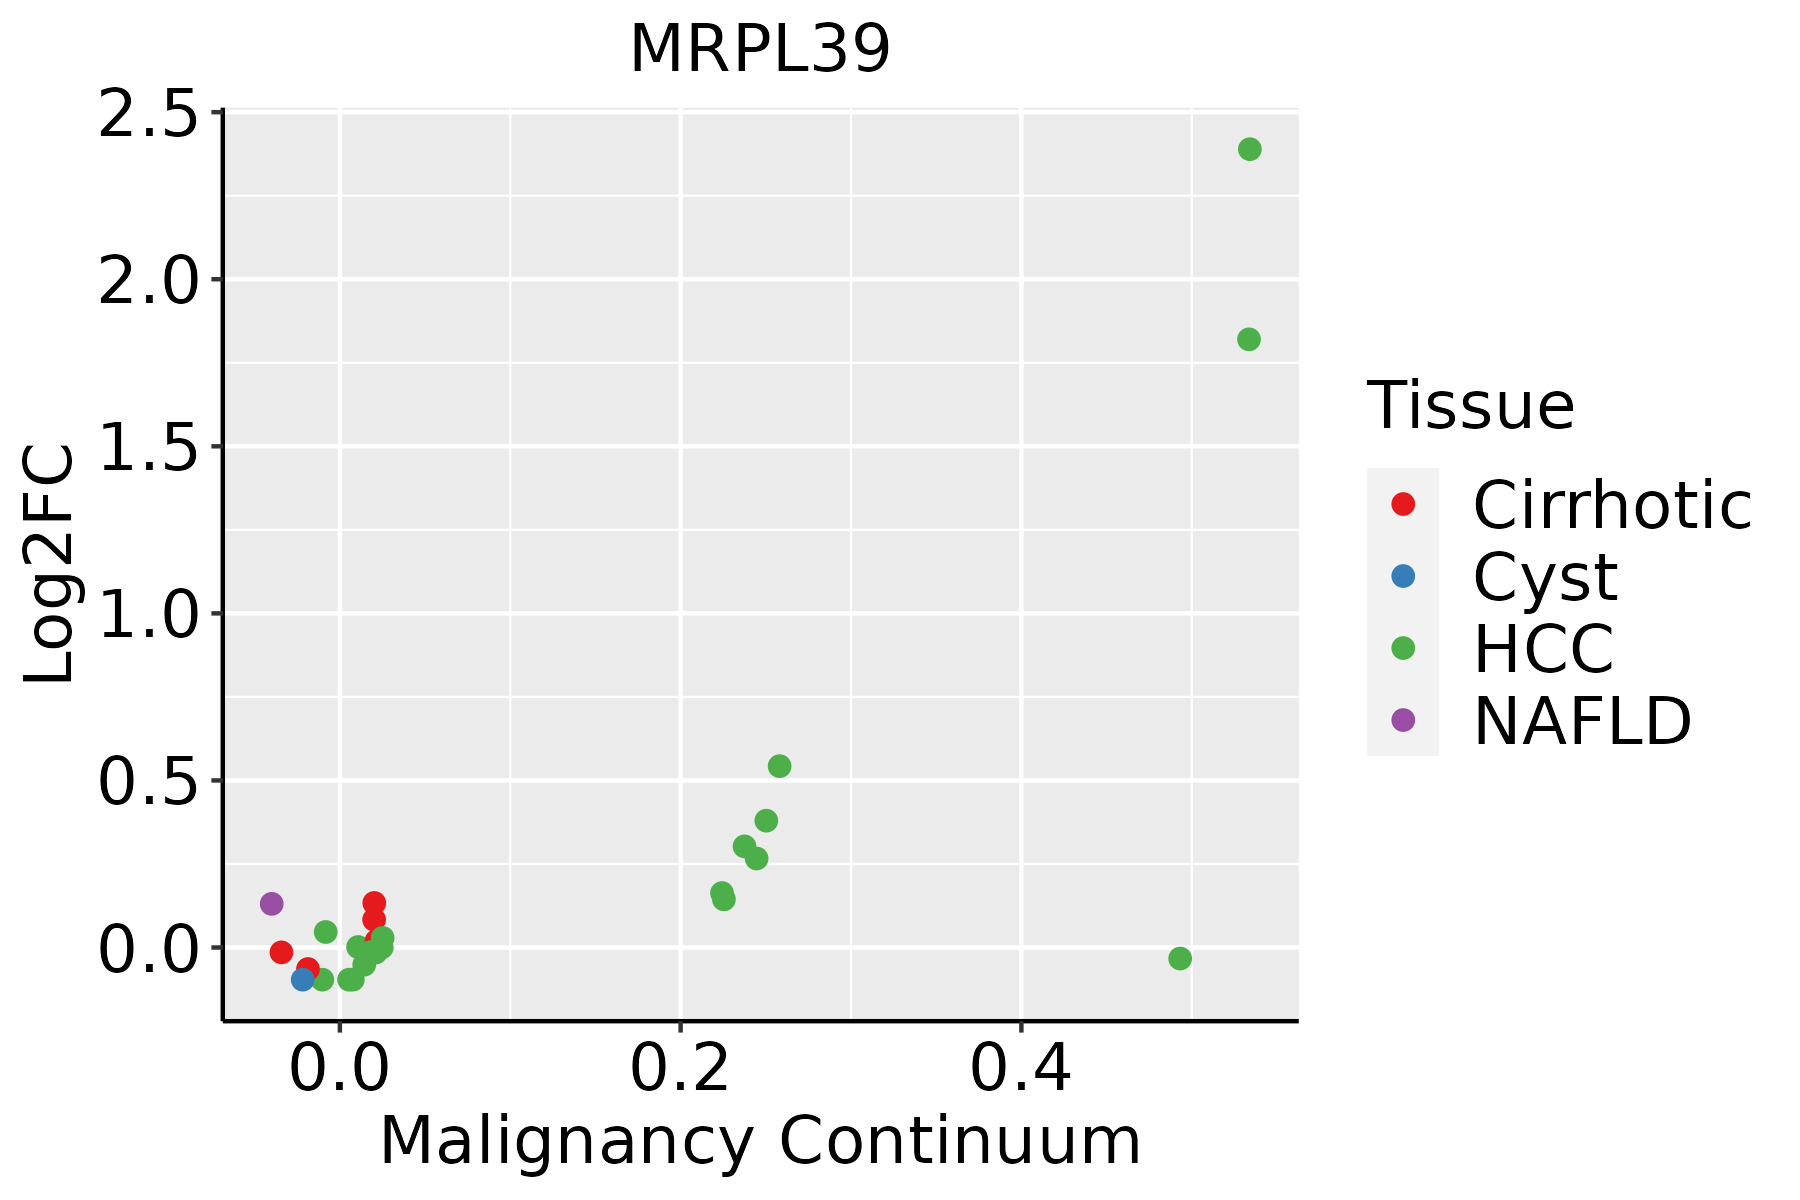 | HCC: Hepatocellular carcinoma |
| NAFLD: Non-alcoholic fatty liver disease | ||
| Oral Cavity | 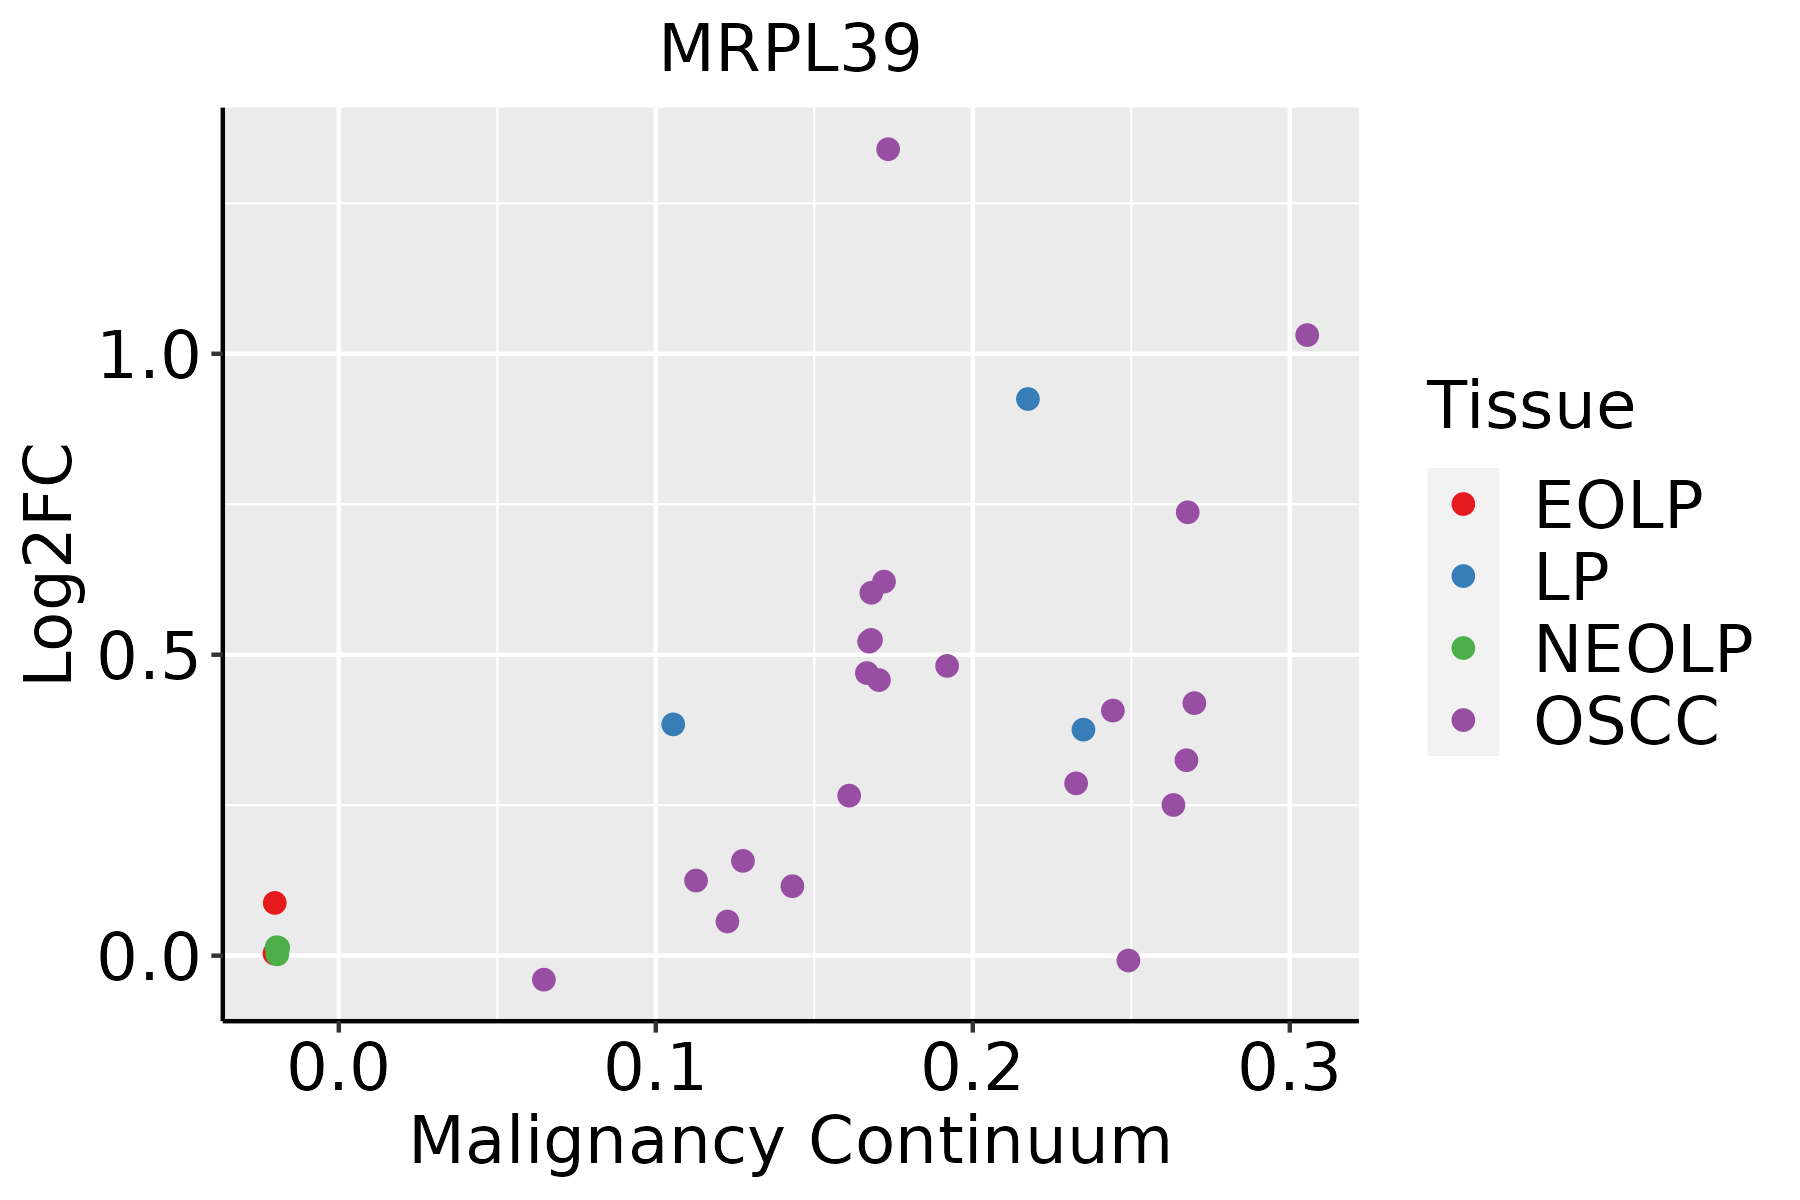 | EOLP: Erosive Oral lichen planus |
| LP: leukoplakia | ||
| NEOLP: Non-erosive oral lichen planus | ||
| OSCC: Oral squamous cell carcinoma | ||
| Skin |  | AK: Actinic keratosis |
| cSCC: Cutaneous squamous cell carcinoma | ||
| SCCIS:squamous cell carcinoma in situ |
| ∗log2FC in expression of this searched gene in stem-like cells from each diseased tissue sample relative to stem-like cells in normal samples in each tissue plotted against the malignancy continuum. Samples are colored based on if they are from different disease stage. |
Top |
Malignant transformation related pathway analysis |
| Find out the enriched GO biological processes and KEGG pathways involved in transition from healthy to precancer to cancer |
| Tissue | Disease Stage | Enriched GO biological Processes |
| Colorectum | AD |  |
| Colorectum | SER |  |
| Colorectum | MSS |  |
| Colorectum | MSI-H |  |
| Colorectum | FAP |  |
| ∗Top 15 enriched GO BP terms are showed in the bar plot of each disease state in each tissue. Each row represents a significant GO biological process which is colored according to the -log10(p.adjust). |
| Page: 1 2 3 4 5 6 7 8 9 |
| GO ID | Tissue | Disease Stage | Description | Gene Ratio | Bg Ratio | pvalue | p.adjust | Count |
| Page: 1 |
| Pathway ID | Tissue | Disease Stage | Description | Gene Ratio | Bg Ratio | pvalue | p.adjust | qvalue | Count |
| Page: 1 |
Top |
Cell-cell communication analysis |
| Identification of potential cell-cell interactions between two cell types and their ligand-receptor pairs for different disease states |
| Ligand | Receptor | LRpair | Pathway | Tissue | Disease Stage |
| Page: 1 |
Top |
Single-cell gene regulatory network inference analysis |
| Find out the significant the regulons (TFs) and the target genes of each regulon across cell types for different disease states |
| TF | Cell Type | Tissue | Disease Stage | Target Gene | RSS | Regulon Activity |
| ∗The dot plots of a searched regulon are shown for all cell subpopulations in each disease state of each tissue based on the regulon specific score inferred using pySCENIC and by calculating the average expression. |
| Page: 1 |
Top |
Somatic mutation of malignant transformation related genes |
| Annotation of somatic variants for genes involved in malignant transformation |
| Hugo Symbol | Variant Class | Variant Classification | dbSNP RS | HGVSc | HGVSp | HGVSp Short | SWISSPROT | BIOTYPE | SIFT | PolyPhen | Tumor Sample Barcode | Tissue | Histology | Sex | Age | Stage | Therapy Types | Drugs | Outcome |
| MRPL39 | SNV | Missense_Mutation | novel | c.985N>G | p.Leu329Val | p.L329V | Q9NYK5 | protein_coding | tolerated_low_confidence(1) | benign(0) | TCGA-3C-AALI-01 | Breast | breast invasive carcinoma | Female | <65 | I/II | Unspecific | Poly E | Complete Response |
| MRPL39 | SNV | Missense_Mutation | rs778553343 | c.991C>G | p.Leu331Val | p.L331V | Q9NYK5 | protein_coding | tolerated_low_confidence(0.4) | benign(0.007) | TCGA-MA-AA41-01 | Cervix | cervical & endocervical cancer | Female | <65 | I/II | Unknown | Unknown | SD |
| MRPL39 | SNV | Missense_Mutation | c.25N>T | p.Arg9Trp | p.R9W | Q9NYK5 | protein_coding | tolerated_low_confidence(0.13) | benign(0) | TCGA-AA-3815-01 | Colorectum | colon adenocarcinoma | Female | >=65 | I/II | Unknown | Unknown | SD | |
| MRPL39 | SNV | Missense_Mutation | rs572415920 | c.547G>A | p.Val183Ile | p.V183I | Q9NYK5 | protein_coding | tolerated(0.21) | benign(0.08) | TCGA-AA-3977-01 | Colorectum | colon adenocarcinoma | Male | >=65 | I/II | Unknown | Unknown | SD |
| MRPL39 | SNV | Missense_Mutation | rs756456682 | c.131N>A | p.Arg44Gln | p.R44Q | Q9NYK5 | protein_coding | tolerated(0.13) | benign(0.261) | TCGA-AA-A00N-01 | Colorectum | colon adenocarcinoma | Male | >=65 | I/II | Unknown | Unknown | PD |
| MRPL39 | SNV | Missense_Mutation | c.467N>T | p.Arg156Met | p.R156M | Q9NYK5 | protein_coding | deleterious(0.05) | benign(0.089) | TCGA-AA-A02R-01 | Colorectum | colon adenocarcinoma | Female | >=65 | I/II | Unknown | Unknown | PD | |
| MRPL39 | SNV | Missense_Mutation | rs762645233 | c.599G>A | p.Arg200His | p.R200H | Q9NYK5 | protein_coding | tolerated(0.14) | benign(0.014) | TCGA-CK-6746-01 | Colorectum | colon adenocarcinoma | Female | >=65 | I/II | Unknown | Unknown | SD |
| MRPL39 | SNV | Missense_Mutation | c.342N>A | p.Asp114Glu | p.D114E | Q9NYK5 | protein_coding | tolerated(0.06) | possibly_damaging(0.891) | TCGA-CM-6169-01 | Colorectum | colon adenocarcinoma | Male | >=65 | I/II | Ancillary | leucovorin | SD | |
| MRPL39 | SNV | Missense_Mutation | c.760N>A | p.Leu254Ile | p.L254I | Q9NYK5 | protein_coding | deleterious(0) | possibly_damaging(0.612) | TCGA-D5-6927-01 | Colorectum | colon adenocarcinoma | Male | <65 | I/II | Unknown | Unknown | SD | |
| MRPL39 | SNV | Missense_Mutation | c.811N>G | p.Arg271Gly | p.R271G | Q9NYK5 | protein_coding | deleterious(0.02) | benign(0.159) | TCGA-DM-A28G-01 | Colorectum | colon adenocarcinoma | Male | >=65 | I/II | Unknown | Unknown | SD |
| Page: 1 2 3 4 5 |
Top |
Related drugs of malignant transformation related genes |
| Identification of chemicals and drugs interact with genes involved in malignant transfromation |
| (DGIdb 4.0) |
| Entrez ID | Symbol | Category | Interaction Types | Drug Claim Name | Drug Name | PMIDs |
| Page: 1 |

Copyright 2023-Present -The University of Texas Health Science Center at Houston |