
|
|||||
|
 | |
| |
| |
| |
| |
| |
|
Gene: MRPL38 |
Gene summary for MRPL38 |
| Gene information | Species | Human | Gene symbol | MRPL38 | Gene ID | 64978 |
| Gene name | mitochondrial ribosomal protein L38 | |
| Gene Alias | HSPC262 | |
| Cytomap | 17q25.1 | |
| Gene Type | protein-coding | GO ID | GO:0000313 | UniProtAcc | Q96DV4 |
Top |
Malignant transformation analysis |
| Identification of the aberrant gene expression in precancerous and cancerous lesions by comparing the gene expression of stem-like cells in diseased tissues with normal stem cells |
| Entrez ID | Symbol | Replicates | Species | Organ | Tissue | Adj P-value | Log2FC | Malignancy |
| 64978 | MRPL38 | LZE2T | Human | Esophagus | ESCC | 3.94e-07 | 5.60e-01 | 0.082 |
| 64978 | MRPL38 | LZE4T | Human | Esophagus | ESCC | 1.25e-18 | 5.45e-01 | 0.0811 |
| 64978 | MRPL38 | LZE5T | Human | Esophagus | ESCC | 1.54e-04 | 3.87e-01 | 0.0514 |
| 64978 | MRPL38 | LZE7T | Human | Esophagus | ESCC | 1.21e-26 | 8.67e-01 | 0.0667 |
| 64978 | MRPL38 | LZE8T | Human | Esophagus | ESCC | 3.51e-22 | 5.83e-01 | 0.067 |
| 64978 | MRPL38 | LZE20T | Human | Esophagus | ESCC | 1.20e-05 | 2.17e-01 | 0.0662 |
| 64978 | MRPL38 | LZE21D1 | Human | Esophagus | HGIN | 5.38e-03 | 5.41e-01 | 0.0632 |
| 64978 | MRPL38 | LZE22D1 | Human | Esophagus | HGIN | 9.21e-09 | 3.42e-01 | 0.0595 |
| 64978 | MRPL38 | LZE22T | Human | Esophagus | ESCC | 3.15e-15 | 7.96e-01 | 0.068 |
| 64978 | MRPL38 | LZE24T | Human | Esophagus | ESCC | 3.44e-48 | 1.19e+00 | 0.0596 |
| 64978 | MRPL38 | LZE21T | Human | Esophagus | ESCC | 2.11e-16 | 7.74e-01 | 0.0655 |
| 64978 | MRPL38 | LZE6T | Human | Esophagus | ESCC | 1.16e-11 | 3.67e-01 | 0.0845 |
| 64978 | MRPL38 | P1T-E | Human | Esophagus | ESCC | 1.59e-20 | 6.95e-01 | 0.0875 |
| 64978 | MRPL38 | P2T-E | Human | Esophagus | ESCC | 5.94e-62 | 9.76e-01 | 0.1177 |
| 64978 | MRPL38 | P4T-E | Human | Esophagus | ESCC | 6.17e-52 | 9.72e-01 | 0.1323 |
| 64978 | MRPL38 | P5T-E | Human | Esophagus | ESCC | 5.88e-35 | 5.94e-01 | 0.1327 |
| 64978 | MRPL38 | P8T-E | Human | Esophagus | ESCC | 5.65e-55 | 9.10e-01 | 0.0889 |
| 64978 | MRPL38 | P9T-E | Human | Esophagus | ESCC | 7.05e-36 | 7.32e-01 | 0.1131 |
| 64978 | MRPL38 | P10T-E | Human | Esophagus | ESCC | 1.07e-50 | 7.60e-01 | 0.116 |
| 64978 | MRPL38 | P11T-E | Human | Esophagus | ESCC | 1.95e-45 | 1.65e+00 | 0.1426 |
| Page: 1 2 3 4 |
| Tissue | Expression Dynamics | Abbreviation |
| Esophagus | 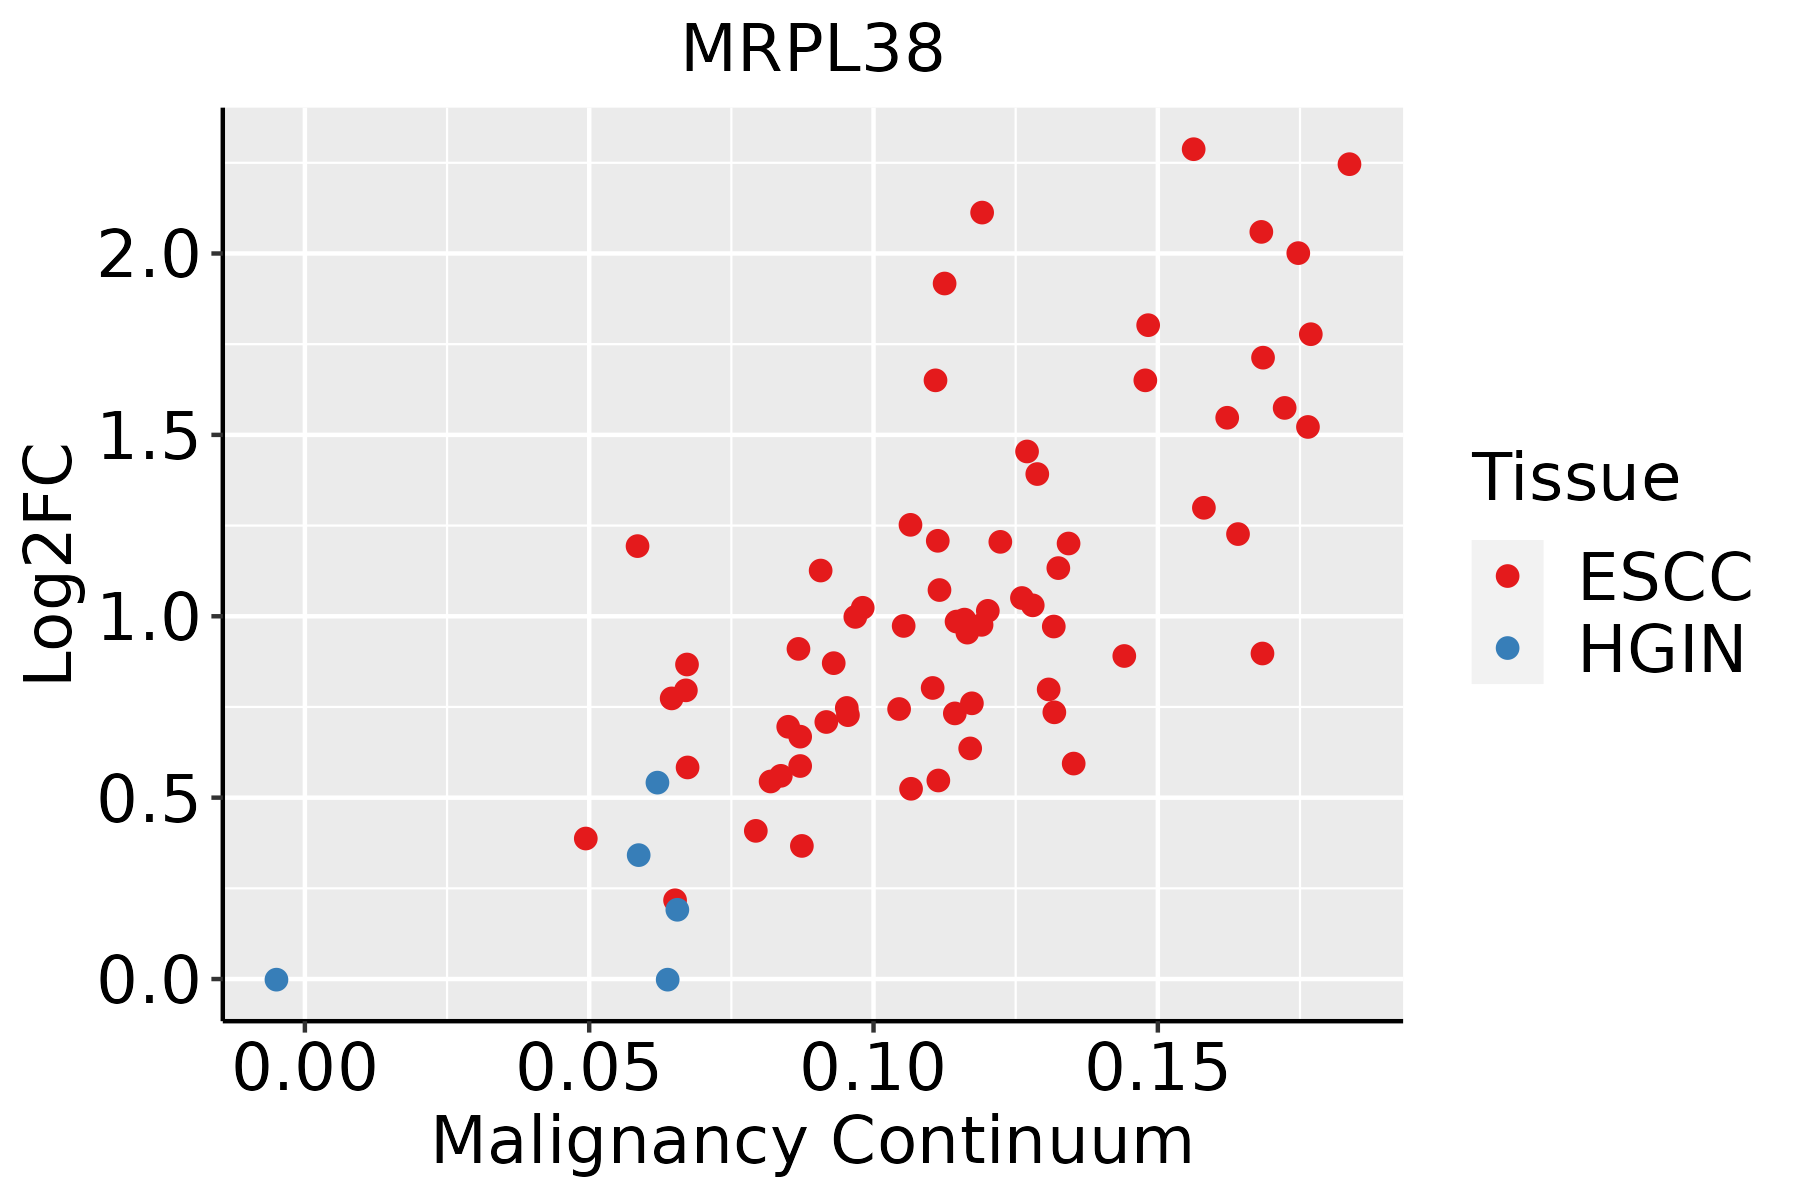 | ESCC: Esophageal squamous cell carcinoma |
| HGIN: High-grade intraepithelial neoplasias | ||
| LGIN: Low-grade intraepithelial neoplasias | ||
| Liver | 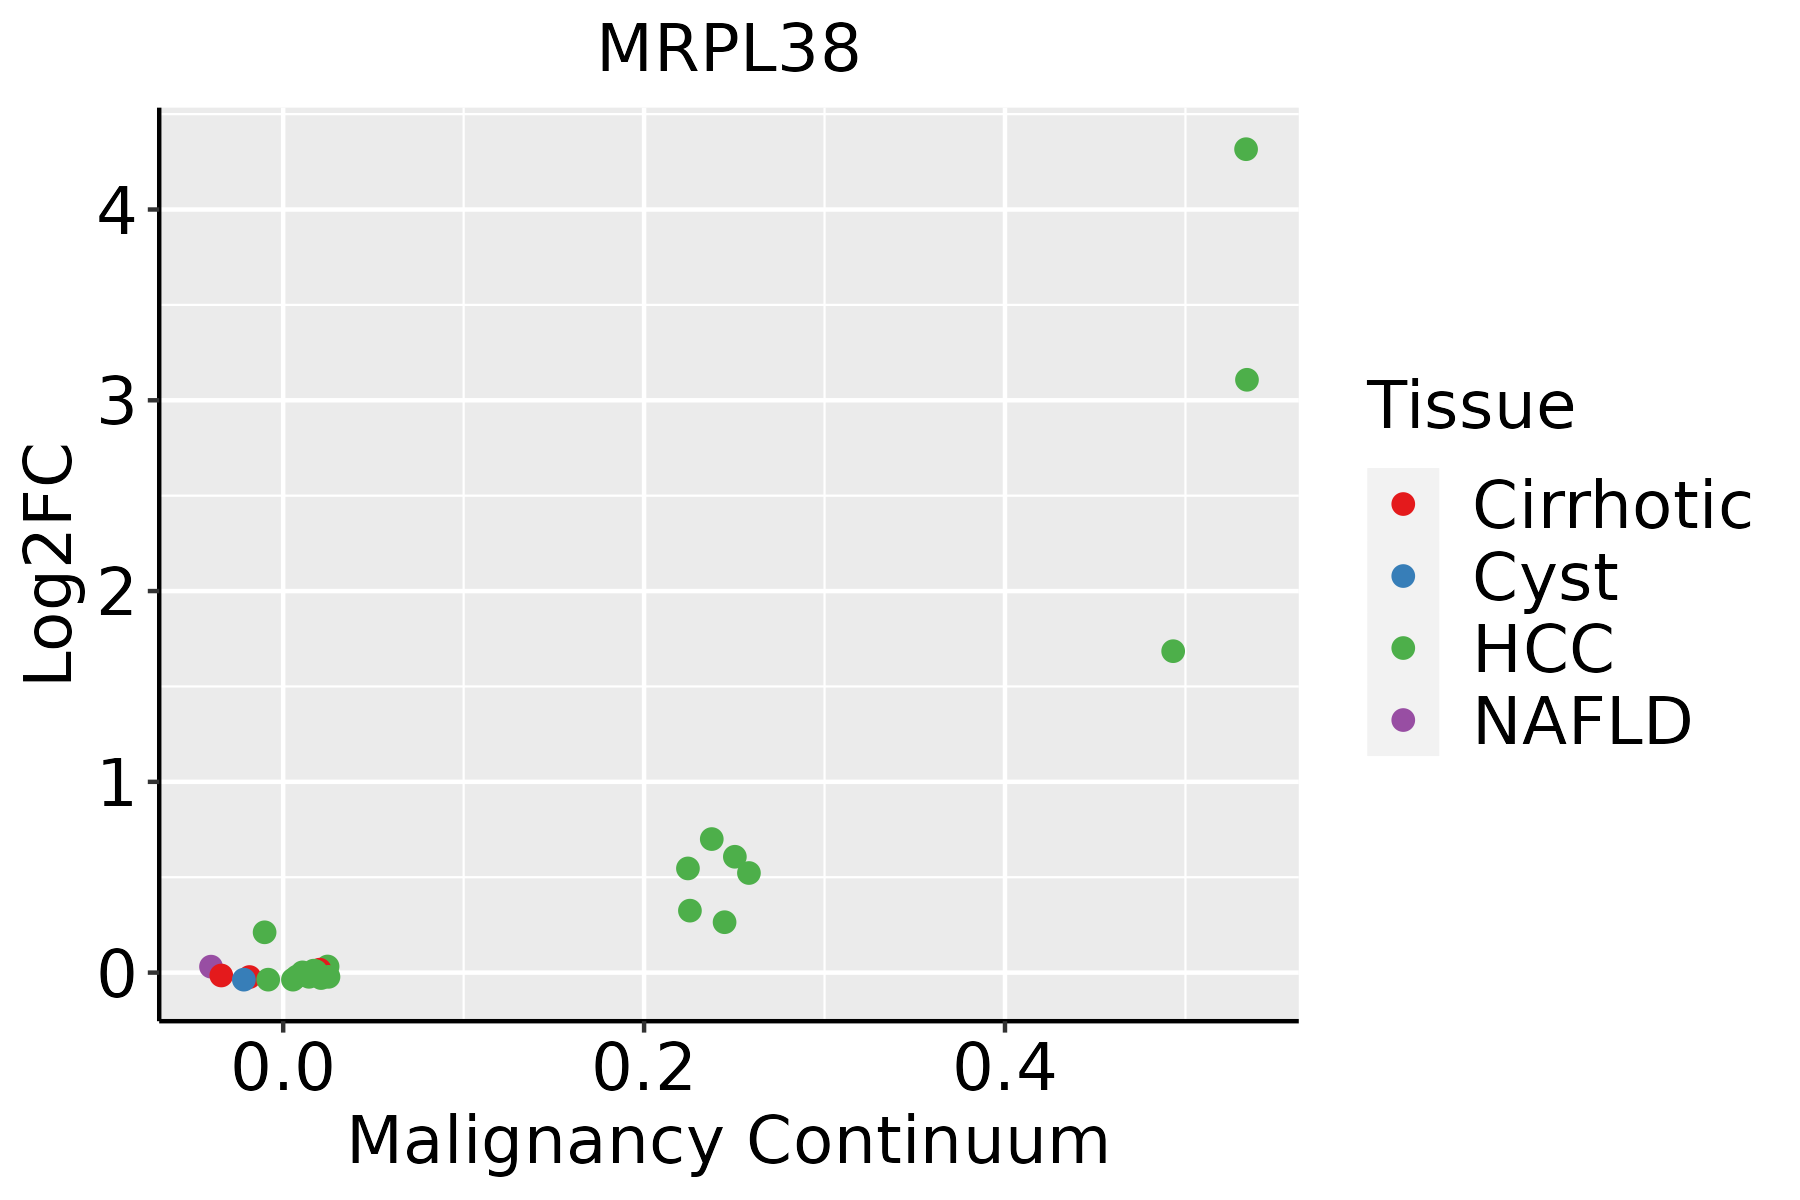 | HCC: Hepatocellular carcinoma |
| NAFLD: Non-alcoholic fatty liver disease |
| ∗log2FC in expression of this searched gene in stem-like cells from each diseased tissue sample relative to stem-like cells in normal samples in each tissue plotted against the malignancy continuum. Samples are colored based on if they are from different disease stage. |
Top |
Malignant transformation related pathway analysis |
| Find out the enriched GO biological processes and KEGG pathways involved in transition from healthy to precancer to cancer |
| Tissue | Disease Stage | Enriched GO biological Processes |
| Colorectum | AD |  |
| Colorectum | SER |  |
| Colorectum | MSS |  |
| Colorectum | MSI-H |  |
| Colorectum | FAP |  |
| ∗Top 15 enriched GO BP terms are showed in the bar plot of each disease state in each tissue. Each row represents a significant GO biological process which is colored according to the -log10(p.adjust). |
| Page: 1 2 3 4 5 6 7 8 9 |
| GO ID | Tissue | Disease Stage | Description | Gene Ratio | Bg Ratio | pvalue | p.adjust | Count |
| Page: 1 |
| Pathway ID | Tissue | Disease Stage | Description | Gene Ratio | Bg Ratio | pvalue | p.adjust | qvalue | Count |
| Page: 1 |
Top |
Cell-cell communication analysis |
| Identification of potential cell-cell interactions between two cell types and their ligand-receptor pairs for different disease states |
| Ligand | Receptor | LRpair | Pathway | Tissue | Disease Stage |
| Page: 1 |
Top |
Single-cell gene regulatory network inference analysis |
| Find out the significant the regulons (TFs) and the target genes of each regulon across cell types for different disease states |
| TF | Cell Type | Tissue | Disease Stage | Target Gene | RSS | Regulon Activity |
| ∗The dot plots of a searched regulon are shown for all cell subpopulations in each disease state of each tissue based on the regulon specific score inferred using pySCENIC and by calculating the average expression. |
| Page: 1 |
Top |
Somatic mutation of malignant transformation related genes |
| Annotation of somatic variants for genes involved in malignant transformation |
| Hugo Symbol | Variant Class | Variant Classification | dbSNP RS | HGVSc | HGVSp | HGVSp Short | SWISSPROT | BIOTYPE | SIFT | PolyPhen | Tumor Sample Barcode | Tissue | Histology | Sex | Age | Stage | Therapy Types | Drugs | Outcome |
| MRPL38 | SNV | Missense_Mutation | rs555101571 | c.943G>A | p.Gly315Ser | p.G315S | Q96DV4 | protein_coding | deleterious(0.02) | probably_damaging(1) | TCGA-AR-A24Q-01 | Breast | breast invasive carcinoma | Female | <65 | I/II | Chemotherapy | doxorubicin | SD |
| MRPL38 | SNV | Missense_Mutation | rs368016617 | c.263T>C | p.Ile88Thr | p.I88T | Q96DV4 | protein_coding | tolerated(0.28) | benign(0.003) | TCGA-C8-A12Q-01 | Breast | breast invasive carcinoma | Female | >=65 | III/IV | Unknown | Unknown | PD |
| MRPL38 | SNV | Missense_Mutation | c.322C>G | p.Gln108Glu | p.Q108E | Q96DV4 | protein_coding | tolerated(0.5) | benign(0) | TCGA-C8-A1HI-01 | Breast | breast invasive carcinoma | Female | <65 | III/IV | Unknown | Unknown | SD | |
| MRPL38 | SNV | Missense_Mutation | novel | c.523N>A | p.Val175Met | p.V175M | Q96DV4 | protein_coding | deleterious(0) | probably_damaging(0.99) | TCGA-E2-A9RU-01 | Breast | breast invasive carcinoma | Female | >=65 | III/IV | Hormone Therapy | arimidex | SD |
| MRPL38 | SNV | Missense_Mutation | rs145518548 | c.731N>A | p.Arg244Gln | p.R244Q | Q96DV4 | protein_coding | tolerated(0.61) | benign(0.009) | TCGA-AA-3713-01 | Colorectum | colon adenocarcinoma | Male | >=65 | III/IV | Chemotherapy | 5-fluorouracil | PR |
| MRPL38 | SNV | Missense_Mutation | rs368760194 | c.361N>T | p.Arg121Trp | p.R121W | Q96DV4 | protein_coding | deleterious(0) | possibly_damaging(0.874) | TCGA-CA-6717-01 | Colorectum | colon adenocarcinoma | Male | <65 | I/II | Chemotherapy | oxaliplatin | CR |
| MRPL38 | SNV | Missense_Mutation | c.344N>T | p.Ala115Val | p.A115V | Q96DV4 | protein_coding | tolerated(0.15) | benign(0.014) | TCGA-G4-6309-01 | Colorectum | colon adenocarcinoma | Female | <65 | III/IV | Chemotherapy | xeloda | PD | |
| MRPL38 | SNV | Missense_Mutation | rs539600238 | c.563N>G | p.Tyr188Cys | p.Y188C | Q96DV4 | protein_coding | deleterious(0.02) | probably_damaging(0.939) | TCGA-QG-A5Z2-01 | Colorectum | colon adenocarcinoma | Male | <65 | I/II | Unknown | Unknown | SD |
| MRPL38 | SNV | Missense_Mutation | c.964N>T | p.Arg322Cys | p.R322C | Q96DV4 | protein_coding | tolerated(0.07) | benign(0.007) | TCGA-EI-6882-01 | Colorectum | rectum adenocarcinoma | Male | <65 | I/II | Unknown | Unknown | SD | |
| MRPL38 | insertion | Frame_Shift_Ins | rs780016287 | c.771_772insC | p.Phe258LeufsTer23 | p.F258Lfs*23 | Q96DV4 | protein_coding | TCGA-AA-3492-01 | Colorectum | colon adenocarcinoma | Female | >=65 | I/II | Unknown | Unknown | SD |
| Page: 1 2 3 |
Top |
Related drugs of malignant transformation related genes |
| Identification of chemicals and drugs interact with genes involved in malignant transfromation |
| (DGIdb 4.0) |
| Entrez ID | Symbol | Category | Interaction Types | Drug Claim Name | Drug Name | PMIDs |
| Page: 1 |

Copyright 2023-Present -The University of Texas Health Science Center at Houston |