
|
|||||
|
 | |
| |
| |
| |
| |
| |
|
Gene: MRPL36 |
Gene summary for MRPL36 |
| Gene information | Species | Human | Gene symbol | MRPL36 | Gene ID | 64979 |
| Gene name | mitochondrial ribosomal protein L36 | |
| Gene Alias | BRIP1 | |
| Cytomap | 5p15.33 | |
| Gene Type | protein-coding | GO ID | GO:0006412 | UniProtAcc | Q9P0J6 |
Top |
Malignant transformation analysis |
| Identification of the aberrant gene expression in precancerous and cancerous lesions by comparing the gene expression of stem-like cells in diseased tissues with normal stem cells |
| Entrez ID | Symbol | Replicates | Species | Organ | Tissue | Adj P-value | Log2FC | Malignancy |
| 64979 | MRPL36 | GSM4909281 | Human | Breast | IDC | 1.82e-02 | 2.41e-01 | 0.21 |
| 64979 | MRPL36 | GSM4909282 | Human | Breast | IDC | 6.18e-14 | 4.91e-01 | -0.0288 |
| 64979 | MRPL36 | GSM4909285 | Human | Breast | IDC | 2.93e-23 | 5.62e-01 | 0.21 |
| 64979 | MRPL36 | GSM4909291 | Human | Breast | IDC | 5.13e-11 | 5.48e-01 | 0.1753 |
| 64979 | MRPL36 | GSM4909293 | Human | Breast | IDC | 1.47e-32 | 6.77e-01 | 0.1581 |
| 64979 | MRPL36 | GSM4909296 | Human | Breast | IDC | 4.71e-04 | 1.31e-01 | 0.1524 |
| 64979 | MRPL36 | GSM4909297 | Human | Breast | IDC | 1.59e-02 | -7.12e-02 | 0.1517 |
| 64979 | MRPL36 | GSM4909308 | Human | Breast | IDC | 1.80e-02 | 2.49e-01 | 0.158 |
| 64979 | MRPL36 | GSM4909311 | Human | Breast | IDC | 1.19e-15 | -8.91e-02 | 0.1534 |
| 64979 | MRPL36 | GSM4909312 | Human | Breast | IDC | 2.74e-05 | -8.35e-03 | 0.1552 |
| 64979 | MRPL36 | GSM4909317 | Human | Breast | IDC | 2.68e-06 | 3.74e-01 | 0.1355 |
| 64979 | MRPL36 | GSM4909318 | Human | Breast | IDC | 5.39e-03 | 4.34e-01 | 0.2031 |
| 64979 | MRPL36 | GSM4909319 | Human | Breast | IDC | 2.35e-18 | -1.12e-01 | 0.1563 |
| 64979 | MRPL36 | GSM4909321 | Human | Breast | IDC | 1.12e-05 | 5.05e-03 | 0.1559 |
| 64979 | MRPL36 | brca1 | Human | Breast | Precancer | 4.60e-05 | 3.29e-01 | -0.0338 |
| 64979 | MRPL36 | brca2 | Human | Breast | Precancer | 3.65e-05 | 1.47e-01 | -0.024 |
| 64979 | MRPL36 | M2 | Human | Breast | IDC | 2.96e-03 | 3.47e-01 | 0.21 |
| 64979 | MRPL36 | NCCBC14 | Human | Breast | DCIS | 5.51e-06 | 2.07e-01 | 0.2021 |
| 64979 | MRPL36 | NCCBC5 | Human | Breast | DCIS | 2.29e-08 | 1.80e-01 | 0.2046 |
| 64979 | MRPL36 | P1 | Human | Breast | IDC | 8.61e-11 | -1.53e-01 | 0.1527 |
| Page: 1 2 3 4 5 6 7 8 |
| Tissue | Expression Dynamics | Abbreviation |
| Breast | 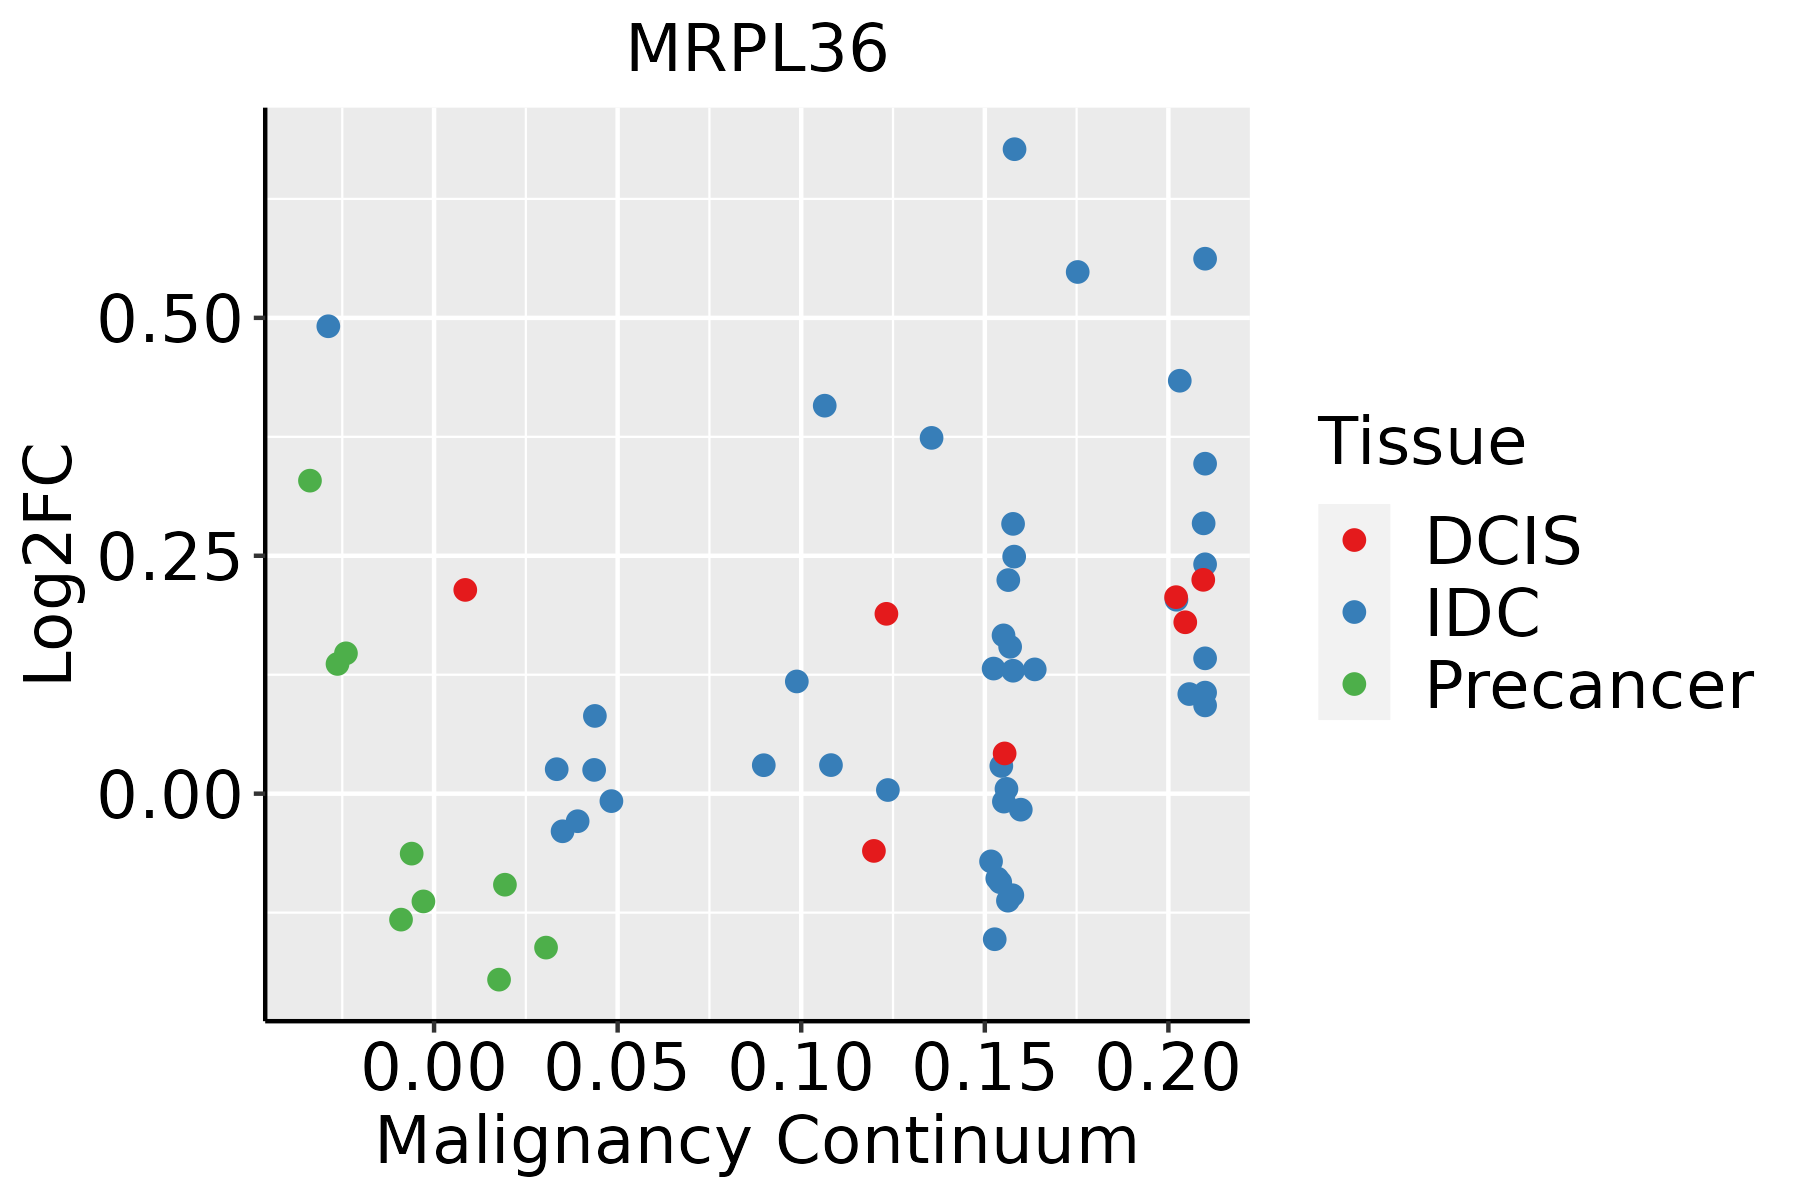 | IDC: Invasive ductal carcinoma |
| DCIS: Ductal carcinoma in situ | ||
| Precancer(BRCA1-mut): Precancerous lesion from BRCA1 mutation carriers | ||
| Esophagus | 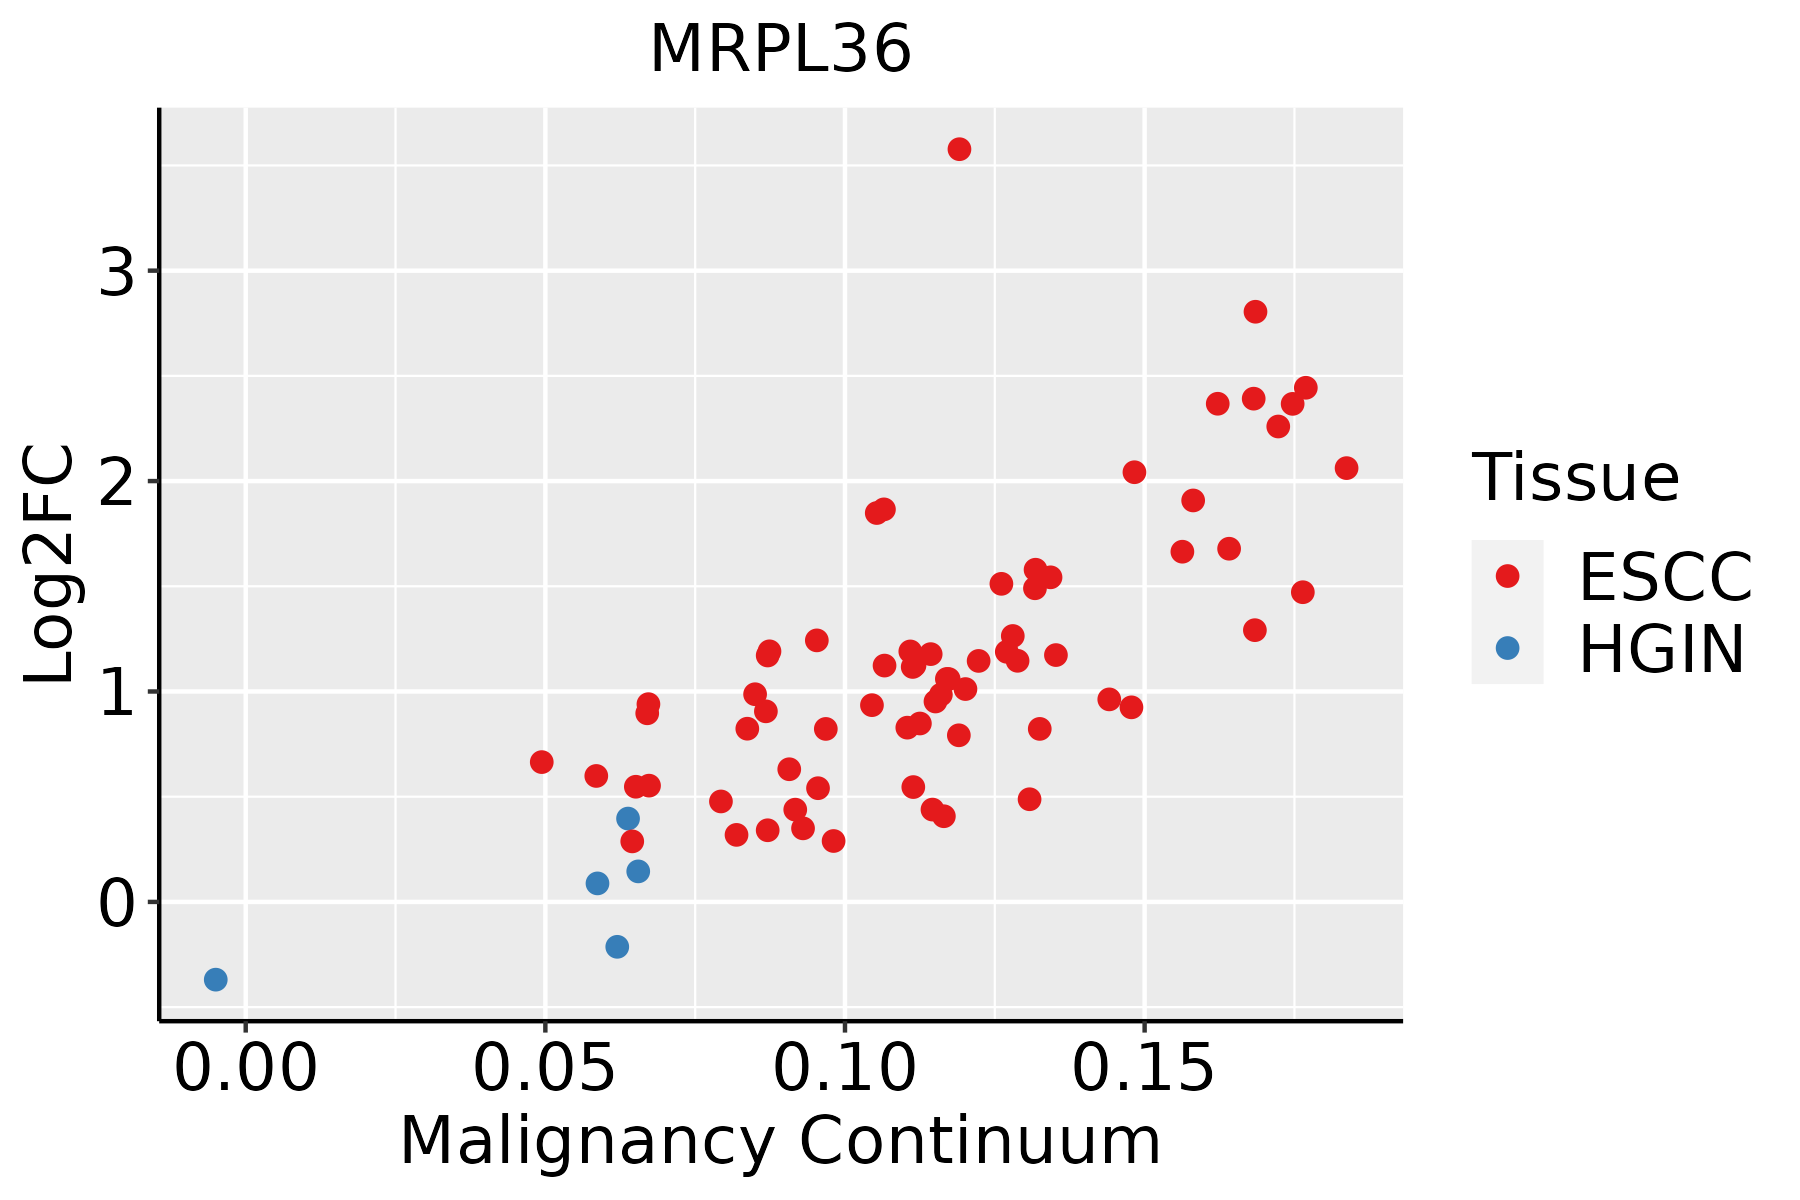 | ESCC: Esophageal squamous cell carcinoma |
| HGIN: High-grade intraepithelial neoplasias | ||
| LGIN: Low-grade intraepithelial neoplasias | ||
| Liver | 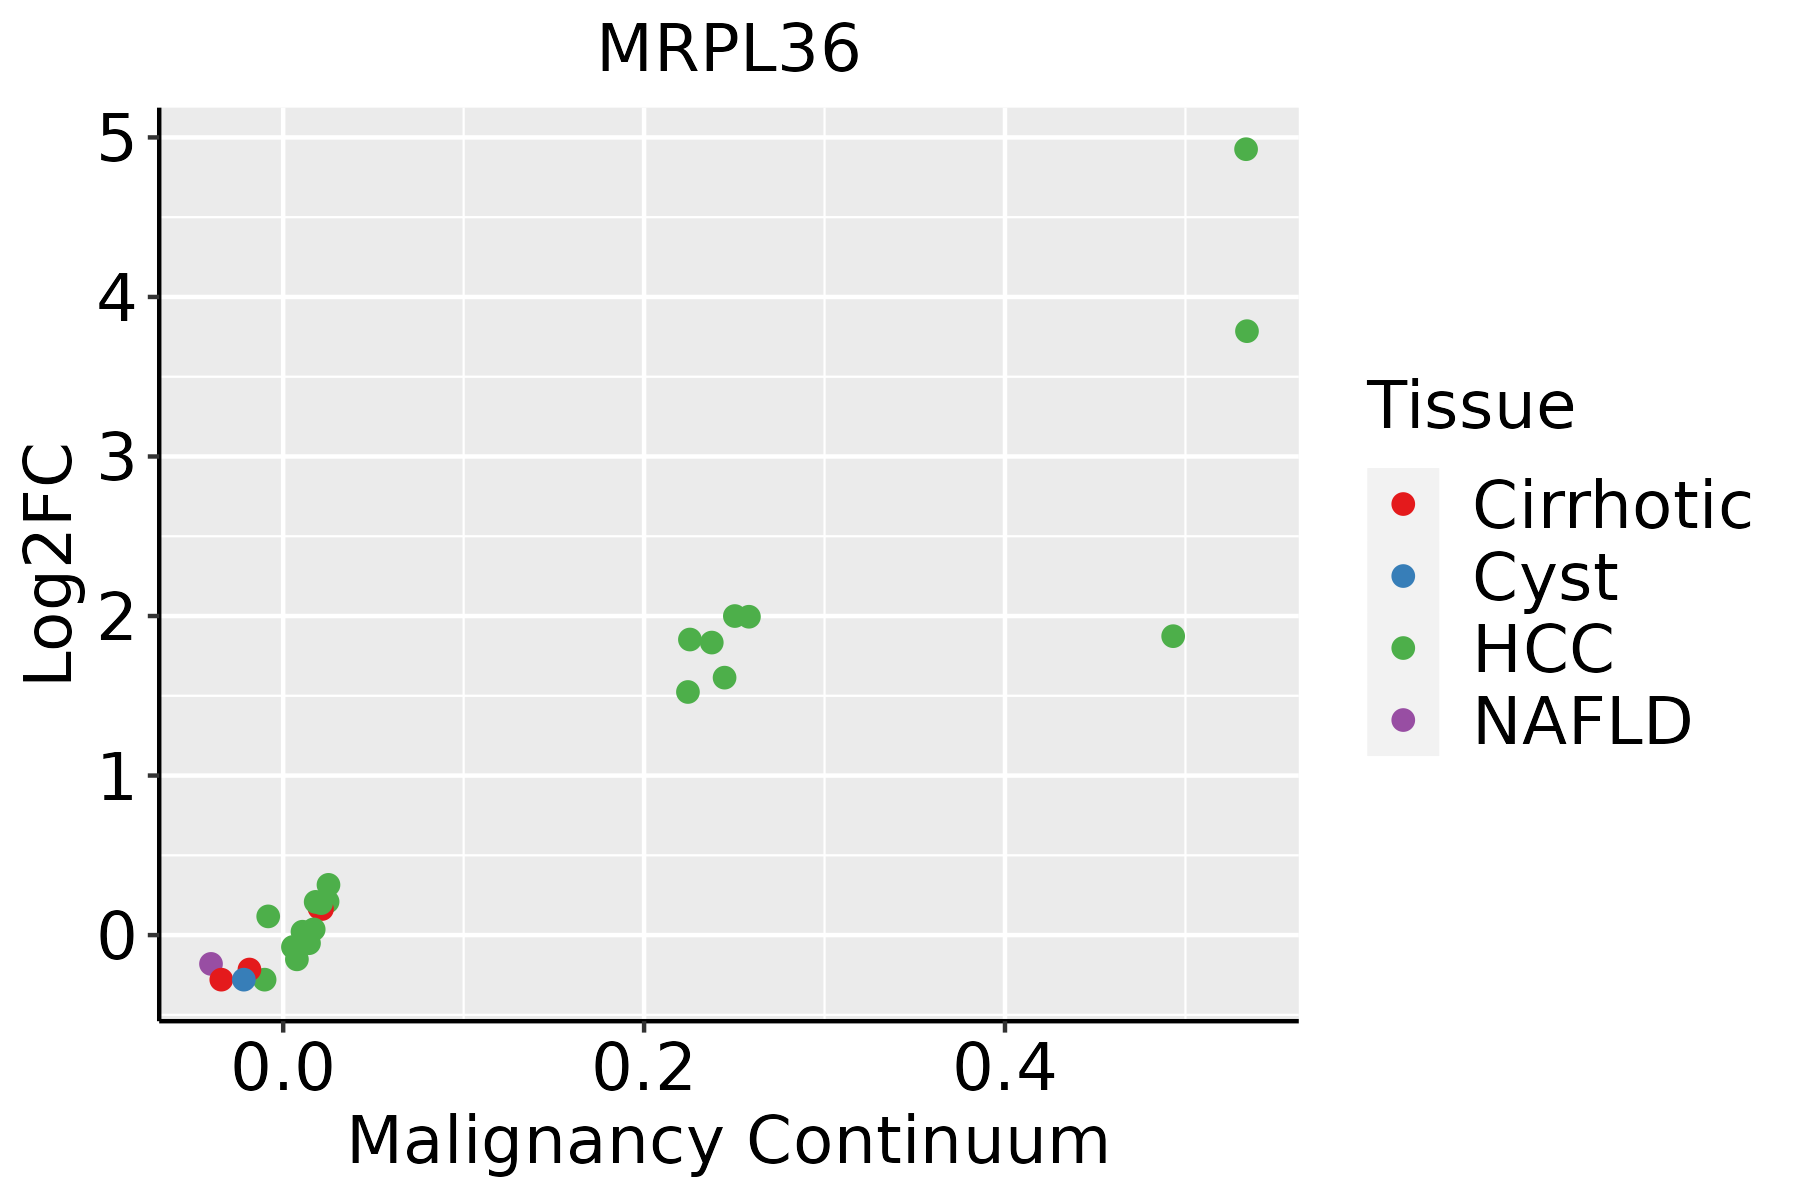 | HCC: Hepatocellular carcinoma |
| NAFLD: Non-alcoholic fatty liver disease | ||
| Oral Cavity | 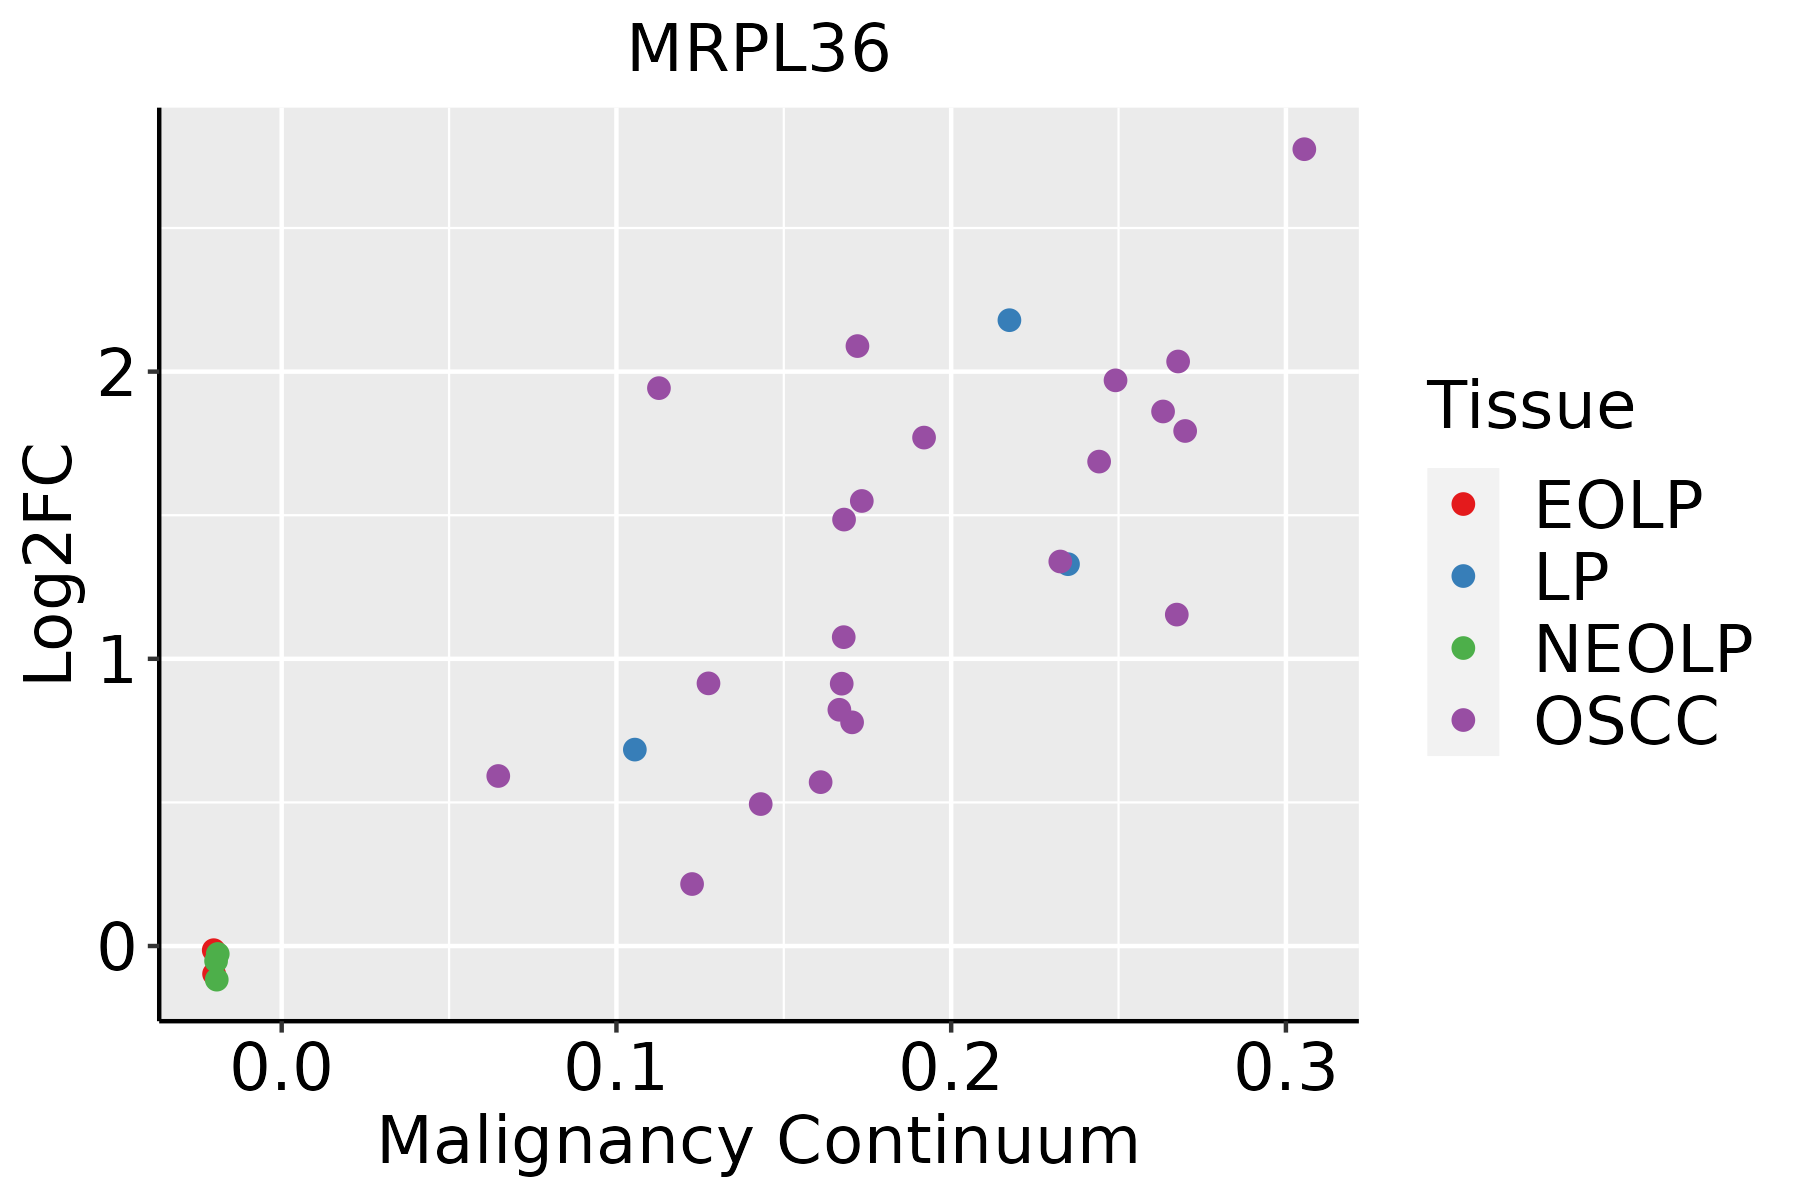 | EOLP: Erosive Oral lichen planus |
| LP: leukoplakia | ||
| NEOLP: Non-erosive oral lichen planus | ||
| OSCC: Oral squamous cell carcinoma | ||
| Prostate | 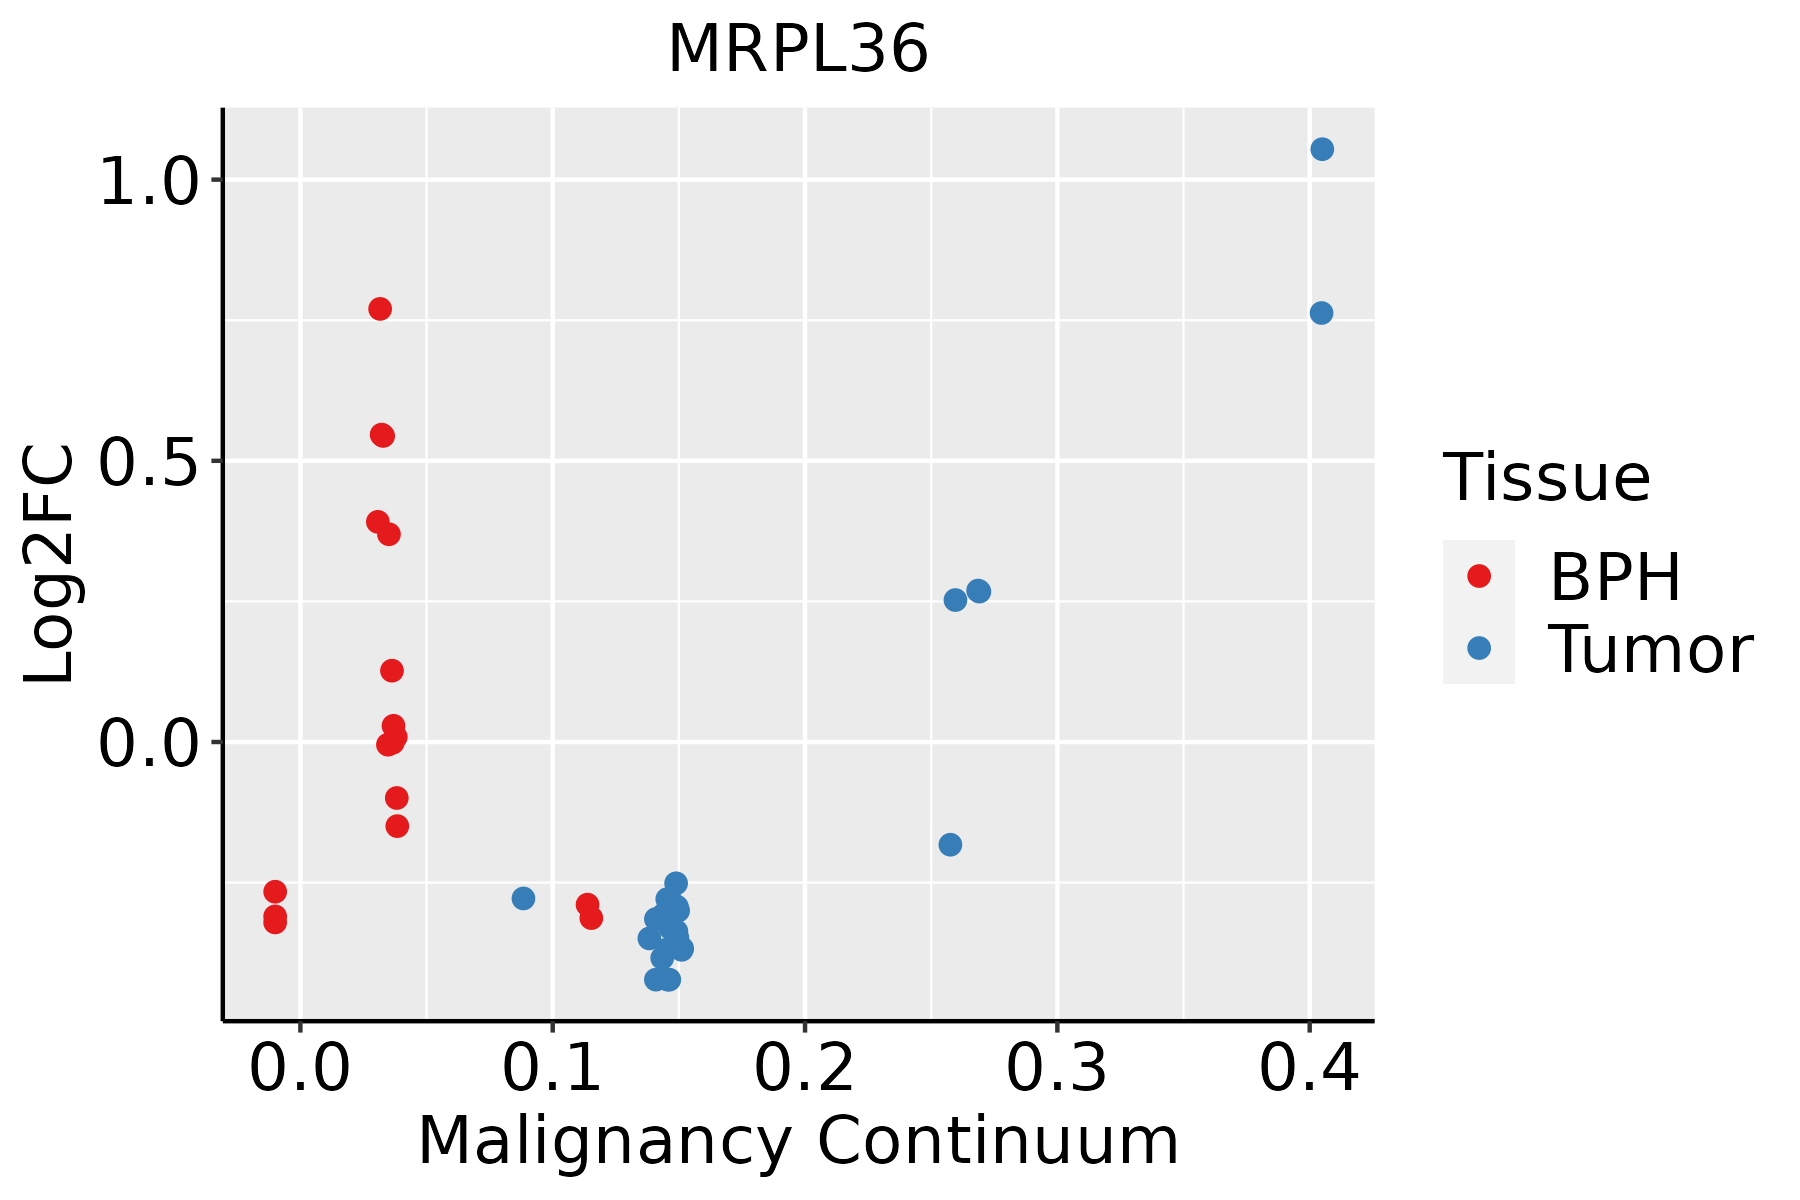 | BPH: Benign Prostatic Hyperplasia |
| Skin | 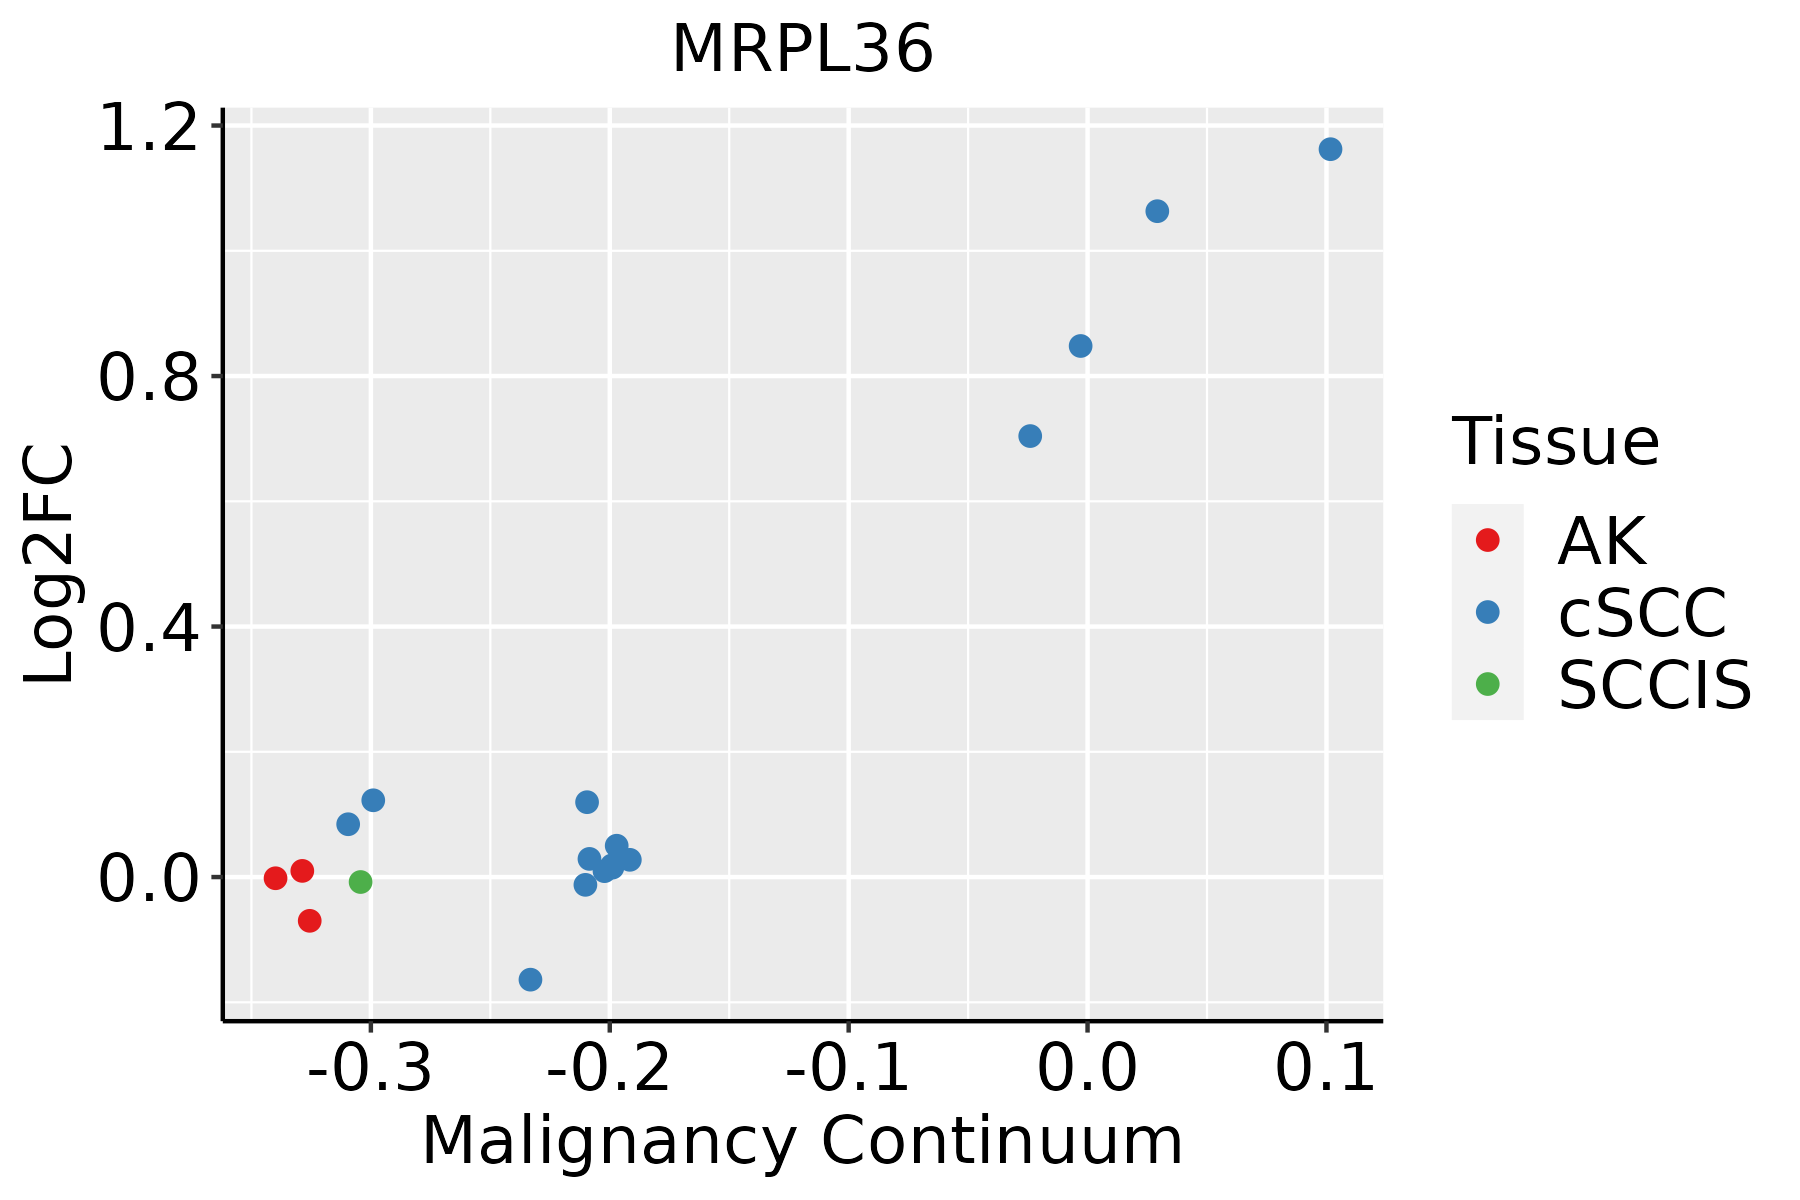 | AK: Actinic keratosis |
| cSCC: Cutaneous squamous cell carcinoma | ||
| SCCIS:squamous cell carcinoma in situ | ||
| Thyroid | 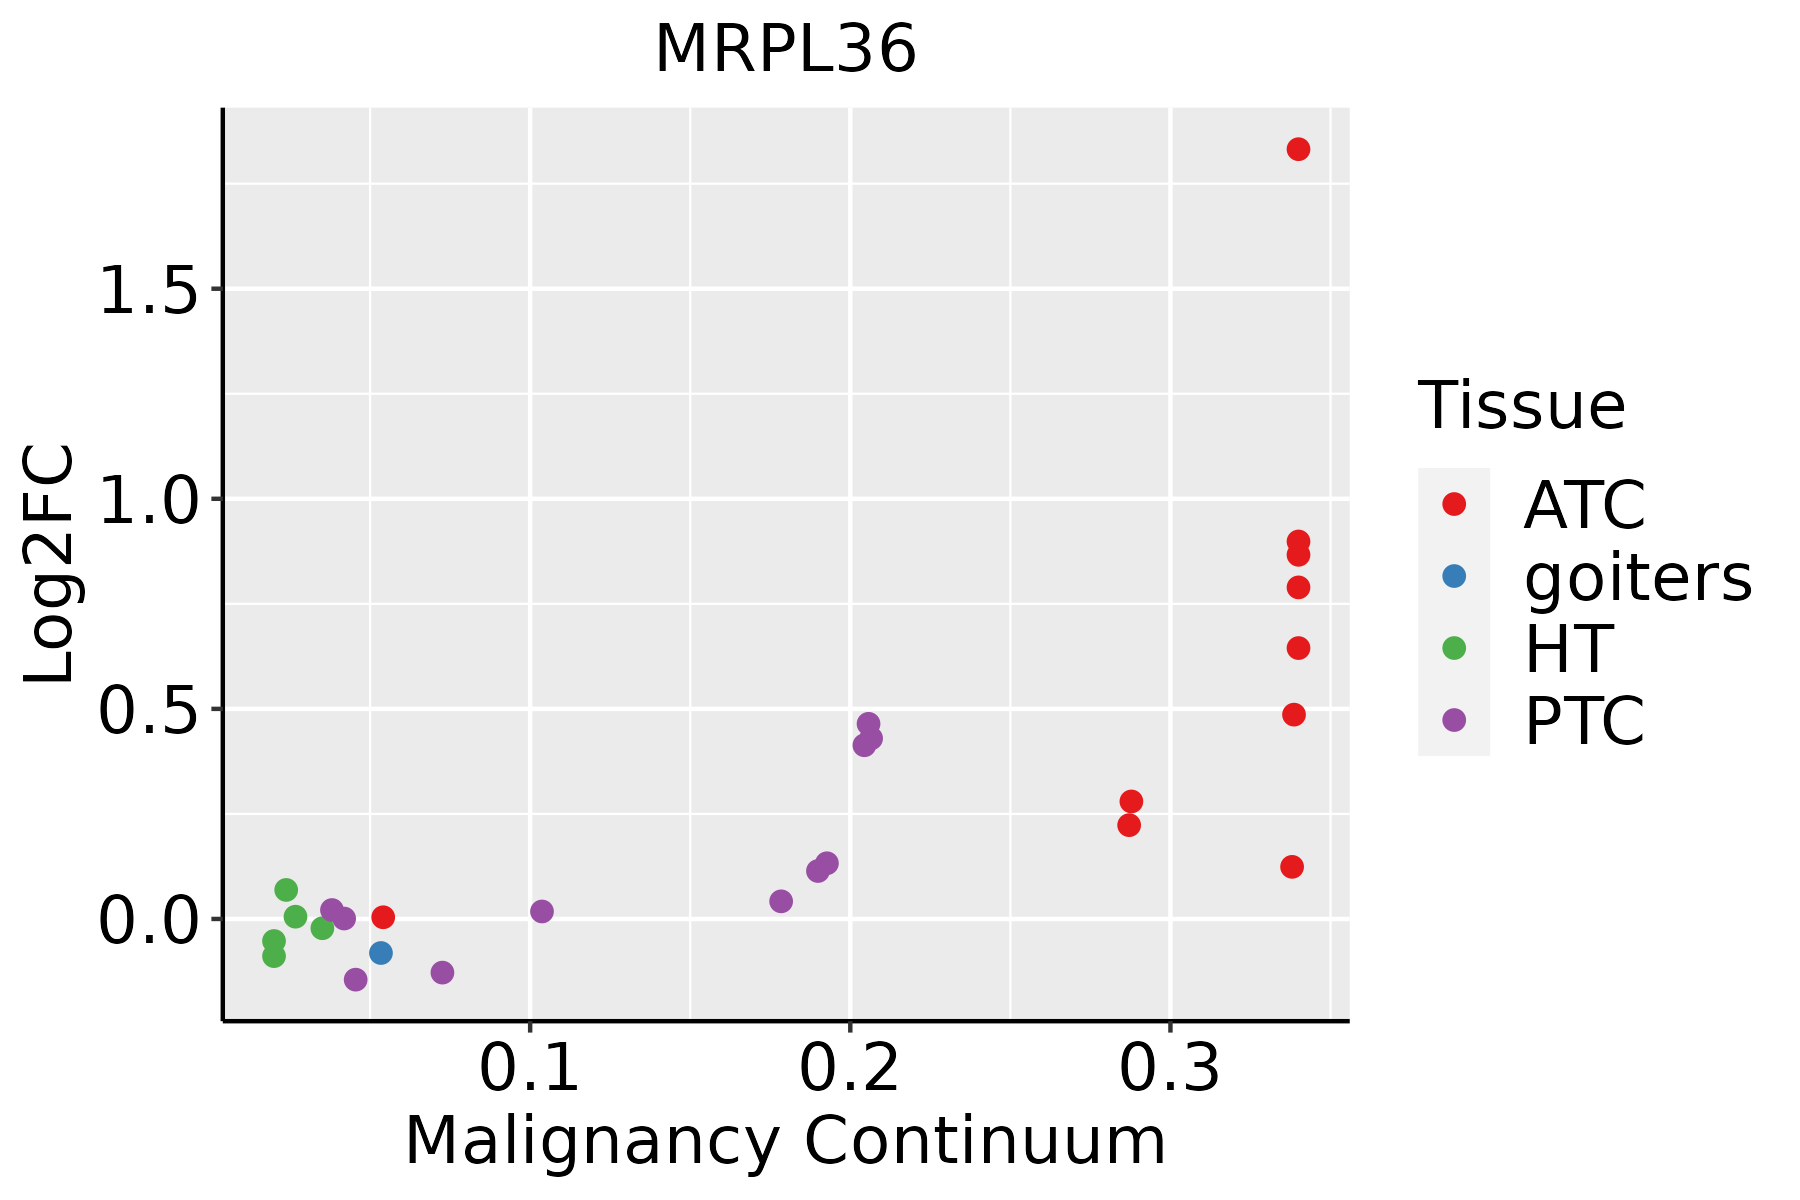 | ATC: Anaplastic thyroid cancer |
| HT: Hashimoto's thyroiditis | ||
| PTC: Papillary thyroid cancer |
| ∗log2FC in expression of this searched gene in stem-like cells from each diseased tissue sample relative to stem-like cells in normal samples in each tissue plotted against the malignancy continuum. Samples are colored based on if they are from different disease stage. |
Top |
Malignant transformation related pathway analysis |
| Find out the enriched GO biological processes and KEGG pathways involved in transition from healthy to precancer to cancer |
| Tissue | Disease Stage | Enriched GO biological Processes |
| Colorectum | AD |  |
| Colorectum | SER |  |
| Colorectum | MSS |  |
| Colorectum | MSI-H |  |
| Colorectum | FAP |  |
| ∗Top 15 enriched GO BP terms are showed in the bar plot of each disease state in each tissue. Each row represents a significant GO biological process which is colored according to the -log10(p.adjust). |
| Page: 1 2 3 4 5 6 7 8 9 |
| GO ID | Tissue | Disease Stage | Description | Gene Ratio | Bg Ratio | pvalue | p.adjust | Count |
| GO:00226139 | Breast | Precancer | ribonucleoprotein complex biogenesis | 79/1080 | 463/18723 | 2.11e-18 | 1.03e-15 | 79 |
| GO:00422549 | Breast | Precancer | ribosome biogenesis | 52/1080 | 299/18723 | 7.35e-13 | 1.51e-10 | 52 |
| GO:002261314 | Breast | IDC | ribonucleoprotein complex biogenesis | 83/1434 | 463/18723 | 2.01e-13 | 5.20e-11 | 83 |
| GO:004225414 | Breast | IDC | ribosome biogenesis | 52/1434 | 299/18723 | 1.90e-08 | 1.32e-06 | 52 |
| GO:002261324 | Breast | DCIS | ribonucleoprotein complex biogenesis | 83/1390 | 463/18723 | 3.65e-14 | 1.09e-11 | 83 |
| GO:004225423 | Breast | DCIS | ribosome biogenesis | 52/1390 | 299/18723 | 6.73e-09 | 5.44e-07 | 52 |
| GO:002261327 | Esophagus | HGIN | ribonucleoprotein complex biogenesis | 158/2587 | 463/18723 | 2.61e-29 | 5.23e-26 | 158 |
| GO:004225426 | Esophagus | HGIN | ribosome biogenesis | 101/2587 | 299/18723 | 8.74e-19 | 4.03e-16 | 101 |
| GO:0022613111 | Esophagus | ESCC | ribonucleoprotein complex biogenesis | 365/8552 | 463/18723 | 1.74e-49 | 1.11e-45 | 365 |
| GO:0042254111 | Esophagus | ESCC | ribosome biogenesis | 252/8552 | 299/18723 | 3.27e-44 | 1.04e-40 | 252 |
| GO:002261312 | Liver | Cirrhotic | ribonucleoprotein complex biogenesis | 231/4634 | 463/18723 | 3.28e-32 | 6.86e-29 | 231 |
| GO:004225412 | Liver | Cirrhotic | ribosome biogenesis | 154/4634 | 299/18723 | 1.18e-23 | 6.72e-21 | 154 |
| GO:002261322 | Liver | HCC | ribonucleoprotein complex biogenesis | 355/7958 | 463/18723 | 7.76e-52 | 4.92e-48 | 355 |
| GO:004225422 | Liver | HCC | ribosome biogenesis | 246/7958 | 299/18723 | 4.99e-46 | 1.58e-42 | 246 |
| GO:002261320 | Oral cavity | OSCC | ribonucleoprotein complex biogenesis | 333/7305 | 463/18723 | 8.28e-48 | 5.24e-44 | 333 |
| GO:004225420 | Oral cavity | OSCC | ribosome biogenesis | 230/7305 | 299/18723 | 3.22e-41 | 6.80e-38 | 230 |
| GO:0022613110 | Oral cavity | LP | ribonucleoprotein complex biogenesis | 259/4623 | 463/18723 | 7.20e-48 | 2.25e-44 | 259 |
| GO:0042254110 | Oral cavity | LP | ribosome biogenesis | 173/4623 | 299/18723 | 8.97e-35 | 1.41e-31 | 173 |
| GO:002261318 | Prostate | BPH | ribonucleoprotein complex biogenesis | 150/3107 | 463/18723 | 2.18e-17 | 5.62e-15 | 150 |
| GO:004225418 | Prostate | BPH | ribosome biogenesis | 90/3107 | 299/18723 | 3.82e-09 | 1.44e-07 | 90 |
| Page: 1 2 |
| Pathway ID | Tissue | Disease Stage | Description | Gene Ratio | Bg Ratio | pvalue | p.adjust | qvalue | Count |
| hsa0301018 | Breast | Precancer | Ribosome | 80/684 | 167/8465 | 7.33e-44 | 2.32e-41 | 1.77e-41 | 80 |
| hsa0301019 | Breast | Precancer | Ribosome | 80/684 | 167/8465 | 7.33e-44 | 2.32e-41 | 1.77e-41 | 80 |
| hsa0301024 | Breast | IDC | Ribosome | 83/867 | 167/8465 | 6.07e-39 | 9.87e-37 | 7.38e-37 | 83 |
| hsa0301034 | Breast | IDC | Ribosome | 83/867 | 167/8465 | 6.07e-39 | 9.87e-37 | 7.38e-37 | 83 |
| hsa0301044 | Breast | DCIS | Ribosome | 82/846 | 167/8465 | 8.69e-39 | 1.40e-36 | 1.03e-36 | 82 |
| hsa0301054 | Breast | DCIS | Ribosome | 82/846 | 167/8465 | 8.69e-39 | 1.40e-36 | 1.03e-36 | 82 |
| hsa0301039 | Esophagus | HGIN | Ribosome | 108/1383 | 167/8465 | 1.44e-45 | 4.71e-43 | 3.74e-43 | 108 |
| hsa03010115 | Esophagus | HGIN | Ribosome | 108/1383 | 167/8465 | 1.44e-45 | 4.71e-43 | 3.74e-43 | 108 |
| hsa03010211 | Esophagus | ESCC | Ribosome | 129/4205 | 167/8465 | 1.43e-13 | 3.43e-12 | 1.75e-12 | 129 |
| hsa03010310 | Esophagus | ESCC | Ribosome | 129/4205 | 167/8465 | 1.43e-13 | 3.43e-12 | 1.75e-12 | 129 |
| hsa0301022 | Liver | Cirrhotic | Ribosome | 127/2530 | 167/8465 | 2.12e-35 | 7.06e-33 | 4.35e-33 | 127 |
| hsa0301032 | Liver | Cirrhotic | Ribosome | 127/2530 | 167/8465 | 2.12e-35 | 7.06e-33 | 4.35e-33 | 127 |
| hsa0301042 | Liver | HCC | Ribosome | 128/4020 | 167/8465 | 7.32e-15 | 2.23e-13 | 1.24e-13 | 128 |
| hsa0301052 | Liver | HCC | Ribosome | 128/4020 | 167/8465 | 7.32e-15 | 2.23e-13 | 1.24e-13 | 128 |
| hsa0301030 | Oral cavity | OSCC | Ribosome | 128/3704 | 167/8465 | 2.42e-18 | 1.62e-16 | 8.25e-17 | 128 |
| hsa03010114 | Oral cavity | OSCC | Ribosome | 128/3704 | 167/8465 | 2.42e-18 | 1.62e-16 | 8.25e-17 | 128 |
| hsa03010210 | Oral cavity | LP | Ribosome | 127/2418 | 167/8465 | 1.22e-37 | 4.05e-35 | 2.61e-35 | 127 |
| hsa0301038 | Oral cavity | LP | Ribosome | 127/2418 | 167/8465 | 1.22e-37 | 4.05e-35 | 2.61e-35 | 127 |
| hsa0301028 | Prostate | BPH | Ribosome | 104/1718 | 167/8465 | 8.04e-33 | 1.33e-30 | 8.21e-31 | 104 |
| hsa03010113 | Prostate | BPH | Ribosome | 104/1718 | 167/8465 | 8.04e-33 | 1.33e-30 | 8.21e-31 | 104 |
| Page: 1 2 |
Top |
Cell-cell communication analysis |
| Identification of potential cell-cell interactions between two cell types and their ligand-receptor pairs for different disease states |
| Ligand | Receptor | LRpair | Pathway | Tissue | Disease Stage |
| Page: 1 |
Top |
Single-cell gene regulatory network inference analysis |
| Find out the significant the regulons (TFs) and the target genes of each regulon across cell types for different disease states |
| TF | Cell Type | Tissue | Disease Stage | Target Gene | RSS | Regulon Activity |
| ∗The dot plots of a searched regulon are shown for all cell subpopulations in each disease state of each tissue based on the regulon specific score inferred using pySCENIC and by calculating the average expression. |
| Page: 1 |
Top |
Somatic mutation of malignant transformation related genes |
| Annotation of somatic variants for genes involved in malignant transformation |
| Hugo Symbol | Variant Class | Variant Classification | dbSNP RS | HGVSc | HGVSp | HGVSp Short | SWISSPROT | BIOTYPE | SIFT | PolyPhen | Tumor Sample Barcode | Tissue | Histology | Sex | Age | Stage | Therapy Types | Drugs | Outcome |
| MRPL36 | SNV | Missense_Mutation | novel | c.281C>A | p.Thr94Asn | p.T94N | Q9P0J6 | protein_coding | deleterious(0) | probably_damaging(0.969) | TCGA-AR-A1AP-01 | Breast | breast invasive carcinoma | Female | >=65 | I/II | Hormone Therapy | anastrozole | SD |
| MRPL36 | SNV | Missense_Mutation | c.145C>T | p.Arg49Cys | p.R49C | Q9P0J6 | protein_coding | deleterious(0.05) | benign(0.248) | TCGA-2W-A8YY-01 | Cervix | cervical & endocervical cancer | Female | <65 | I/II | Chemotherapy | cisplatin | CR | |
| MRPL36 | SNV | Missense_Mutation | novel | c.122N>T | p.Ala41Val | p.A41V | Q9P0J6 | protein_coding | tolerated(0.1) | benign(0.099) | TCGA-AJ-A3EL-01 | Endometrium | uterine corpus endometrioid carcinoma | Female | <65 | I/II | Unknown | Unknown | SD |
| MRPL36 | SNV | Missense_Mutation | rs200540489 | c.268N>A | p.Val90Ile | p.V90I | Q9P0J6 | protein_coding | tolerated(0.67) | benign(0.001) | TCGA-AP-A059-01 | Endometrium | uterine corpus endometrioid carcinoma | Female | >=65 | I/II | Unknown | Unknown | SD |
| MRPL36 | SNV | Missense_Mutation | rs367987549 | c.253C>T | p.Arg85Trp | p.R85W | Q9P0J6 | protein_coding | deleterious(0) | probably_damaging(0.998) | TCGA-B5-A3FA-01 | Endometrium | uterine corpus endometrioid carcinoma | Female | >=65 | I/II | Unknown | Unknown | SD |
| MRPL36 | SNV | Missense_Mutation | rs777500156 | c.188N>T | p.Ala63Val | p.A63V | Q9P0J6 | protein_coding | tolerated(0.1) | benign(0.039) | TCGA-B5-A3FC-01 | Endometrium | uterine corpus endometrioid carcinoma | Female | <65 | I/II | Unknown | Unknown | SD |
| MRPL36 | SNV | Missense_Mutation | c.145N>T | p.Arg49Cys | p.R49C | Q9P0J6 | protein_coding | deleterious(0.05) | benign(0.248) | TCGA-BS-A0UV-01 | Endometrium | uterine corpus endometrioid carcinoma | Female | <65 | III/IV | Unknown | Unknown | SD | |
| MRPL36 | SNV | Missense_Mutation | rs367987549 | c.253N>T | p.Arg85Trp | p.R85W | Q9P0J6 | protein_coding | deleterious(0) | probably_damaging(0.998) | TCGA-EO-A22R-01 | Endometrium | uterine corpus endometrioid carcinoma | Female | <65 | I/II | Unknown | Unknown | SD |
| MRPL36 | SNV | Missense_Mutation | novel | c.134N>T | p.Gly45Val | p.G45V | Q9P0J6 | protein_coding | tolerated(0.29) | benign(0.003) | TCGA-53-7626-01 | Lung | lung adenocarcinoma | Female | >=65 | I/II | Unspecific | Cisplatin | PD |
| MRPL36 | SNV | Missense_Mutation | novel | c.128N>G | p.Glu43Gly | p.E43G | Q9P0J6 | protein_coding | tolerated(0.13) | benign(0) | TCGA-66-2758-01 | Lung | lung squamous cell carcinoma | Male | >=65 | I/II | Chemotherapy | cisplatin | CR |
| Page: 1 |
Top |
Related drugs of malignant transformation related genes |
| Identification of chemicals and drugs interact with genes involved in malignant transfromation |
| (DGIdb 4.0) |
| Entrez ID | Symbol | Category | Interaction Types | Drug Claim Name | Drug Name | PMIDs |
| Page: 1 |

Copyright 2023-Present -The University of Texas Health Science Center at Houston |