
|
|||||
|
 | |
| |
| |
| |
| |
| |
|
Gene: MRPL33 |
Gene summary for MRPL33 |
| Gene information | Species | Human | Gene symbol | MRPL33 | Gene ID | 9553 |
| Gene name | mitochondrial ribosomal protein L33 | |
| Gene Alias | C2orf1 | |
| Cytomap | 2p23.2 | |
| Gene Type | protein-coding | GO ID | GO:0006412 | UniProtAcc | O75394 |
Top |
Malignant transformation analysis |
| Identification of the aberrant gene expression in precancerous and cancerous lesions by comparing the gene expression of stem-like cells in diseased tissues with normal stem cells |
| Entrez ID | Symbol | Replicates | Species | Organ | Tissue | Adj P-value | Log2FC | Malignancy |
| 9553 | MRPL33 | CA_HPV_1 | Human | Cervix | CC | 9.02e-15 | -3.01e-01 | 0.0264 |
| 9553 | MRPL33 | CA_HPV_3 | Human | Cervix | CC | 2.76e-02 | -2.42e-01 | 0.0414 |
| 9553 | MRPL33 | N_HPV_1 | Human | Cervix | N_HPV | 1.49e-03 | -1.57e-01 | 0.0079 |
| 9553 | MRPL33 | CCI_1 | Human | Cervix | CC | 3.20e-06 | -6.23e-01 | 0.528 |
| 9553 | MRPL33 | CCI_3 | Human | Cervix | CC | 8.17e-10 | -6.29e-01 | 0.516 |
| 9553 | MRPL33 | CCII_1 | Human | Cervix | CC | 3.69e-24 | -7.68e-01 | 0.3249 |
| 9553 | MRPL33 | sample3 | Human | Cervix | CC | 8.77e-10 | -3.10e-01 | 0.1387 |
| 9553 | MRPL33 | L1 | Human | Cervix | CC | 4.30e-10 | -4.71e-01 | 0.0802 |
| 9553 | MRPL33 | T1 | Human | Cervix | CC | 3.01e-05 | -3.50e-01 | 0.0918 |
| 9553 | MRPL33 | T3 | Human | Cervix | CC | 3.15e-07 | -3.26e-01 | 0.1389 |
| 9553 | MRPL33 | AEH-subject1 | Human | Endometrium | AEH | 1.05e-13 | -3.40e-01 | -0.3059 |
| 9553 | MRPL33 | AEH-subject2 | Human | Endometrium | AEH | 1.94e-10 | -2.98e-01 | -0.2525 |
| 9553 | MRPL33 | AEH-subject3 | Human | Endometrium | AEH | 5.45e-15 | -3.28e-01 | -0.2576 |
| 9553 | MRPL33 | AEH-subject4 | Human | Endometrium | AEH | 4.81e-05 | -2.34e-01 | -0.2657 |
| 9553 | MRPL33 | AEH-subject5 | Human | Endometrium | AEH | 1.18e-11 | -3.72e-01 | -0.2953 |
| 9553 | MRPL33 | EEC-subject1 | Human | Endometrium | EEC | 1.09e-20 | -3.84e-01 | -0.2682 |
| 9553 | MRPL33 | EEC-subject2 | Human | Endometrium | EEC | 5.05e-12 | -3.51e-01 | -0.2607 |
| 9553 | MRPL33 | EEC-subject3 | Human | Endometrium | EEC | 2.93e-48 | -4.43e-01 | -0.2525 |
| 9553 | MRPL33 | EEC-subject4 | Human | Endometrium | EEC | 4.59e-06 | -2.48e-01 | -0.2571 |
| 9553 | MRPL33 | EEC-subject5 | Human | Endometrium | EEC | 1.74e-09 | -1.85e-01 | -0.249 |
| Page: 1 2 3 4 5 6 7 8 9 |
| Tissue | Expression Dynamics | Abbreviation |
| Cervix | 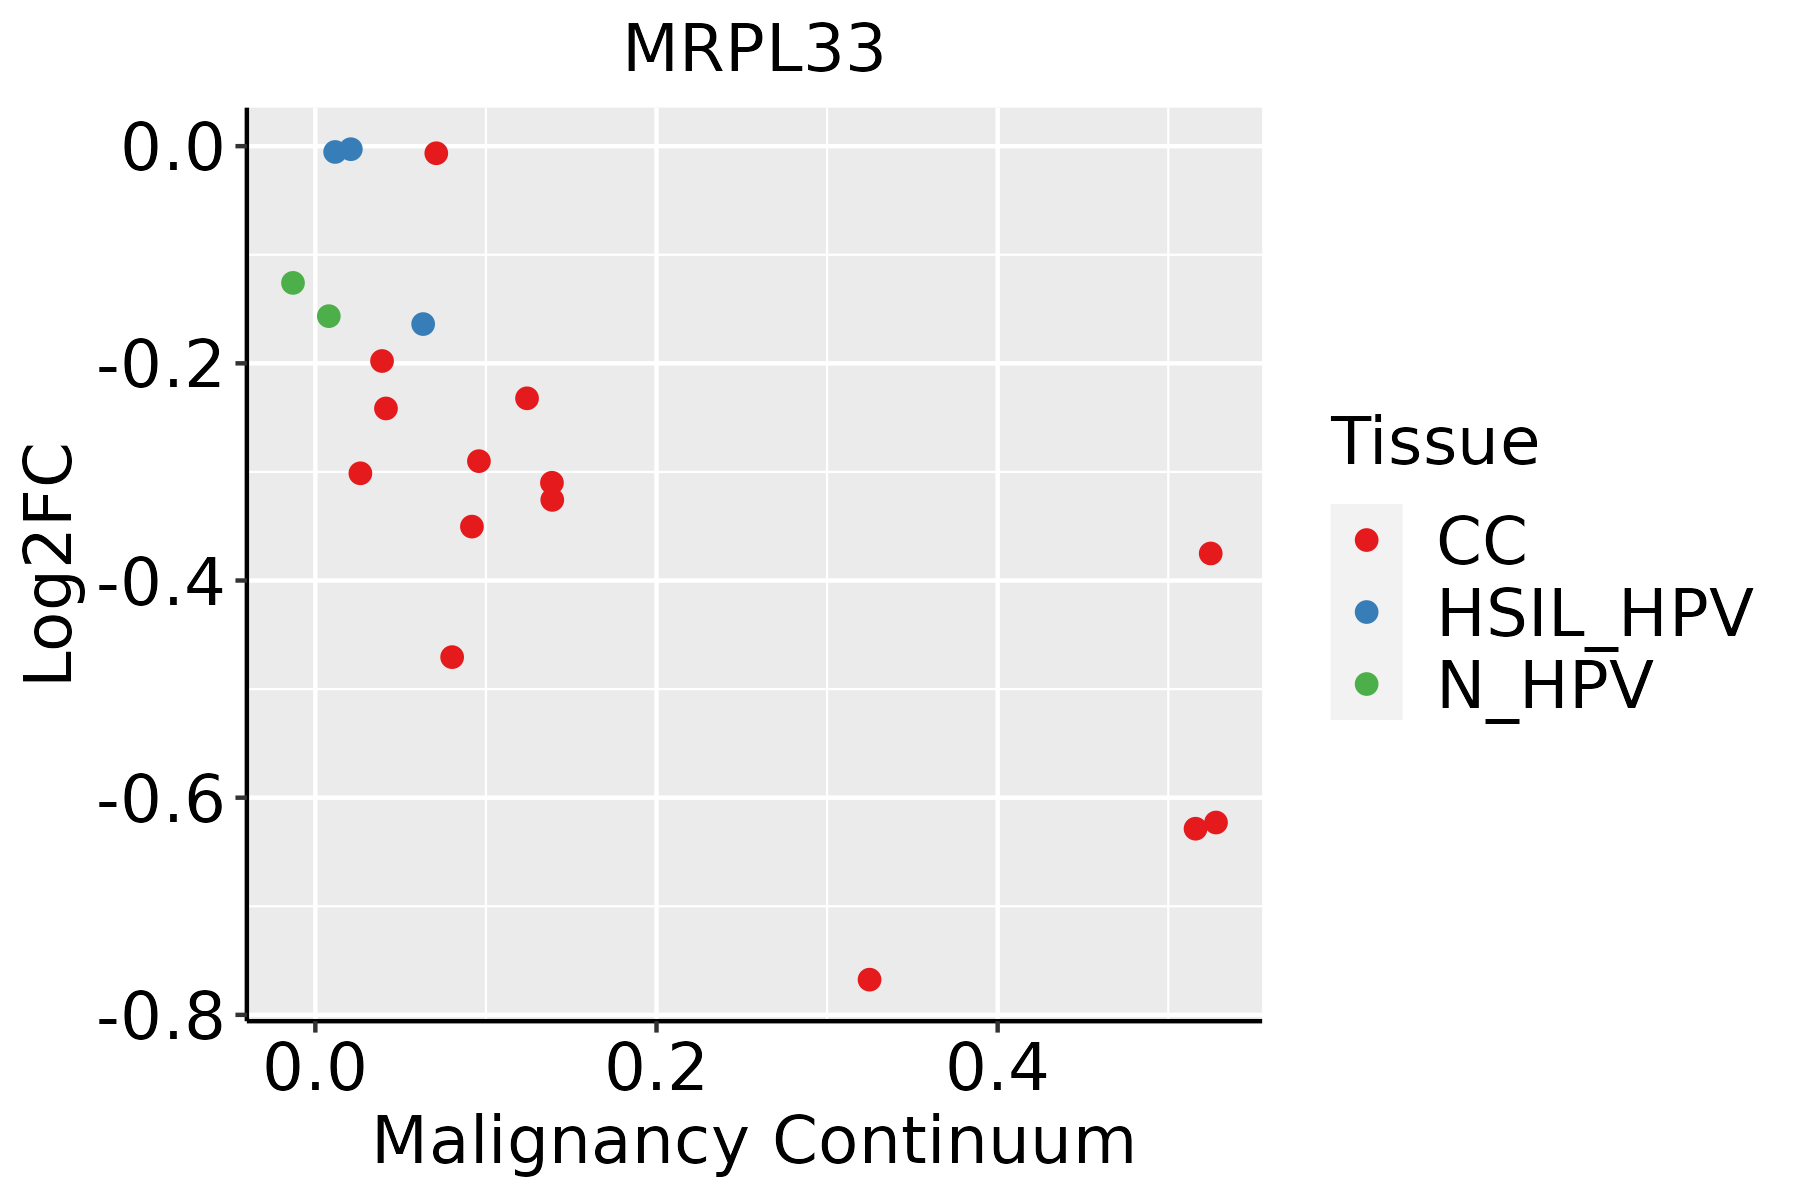 | CC: Cervix cancer |
| HSIL_HPV: HPV-infected high-grade squamous intraepithelial lesions | ||
| N_HPV: HPV-infected normal cervix | ||
| Endometrium | 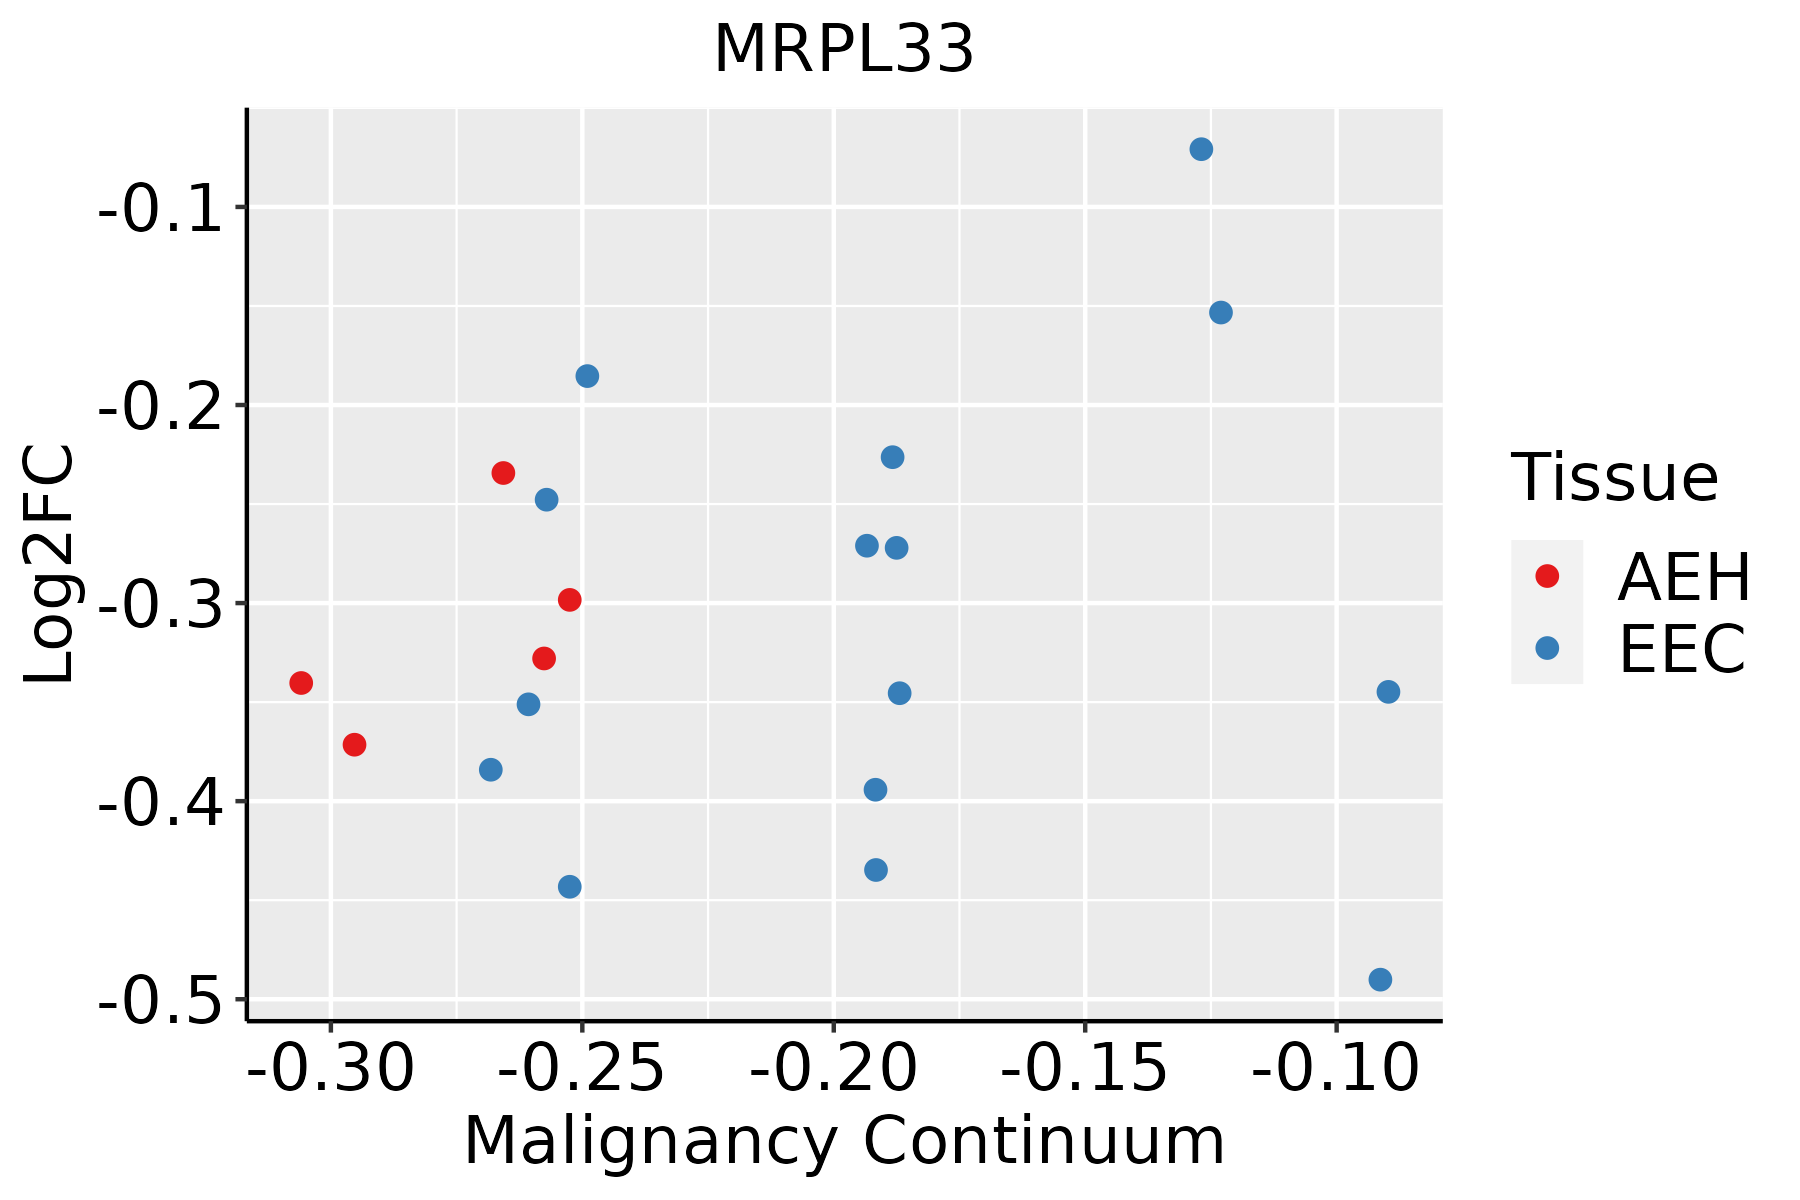 | AEH: Atypical endometrial hyperplasia |
| EEC: Endometrioid Cancer | ||
| Esophagus | 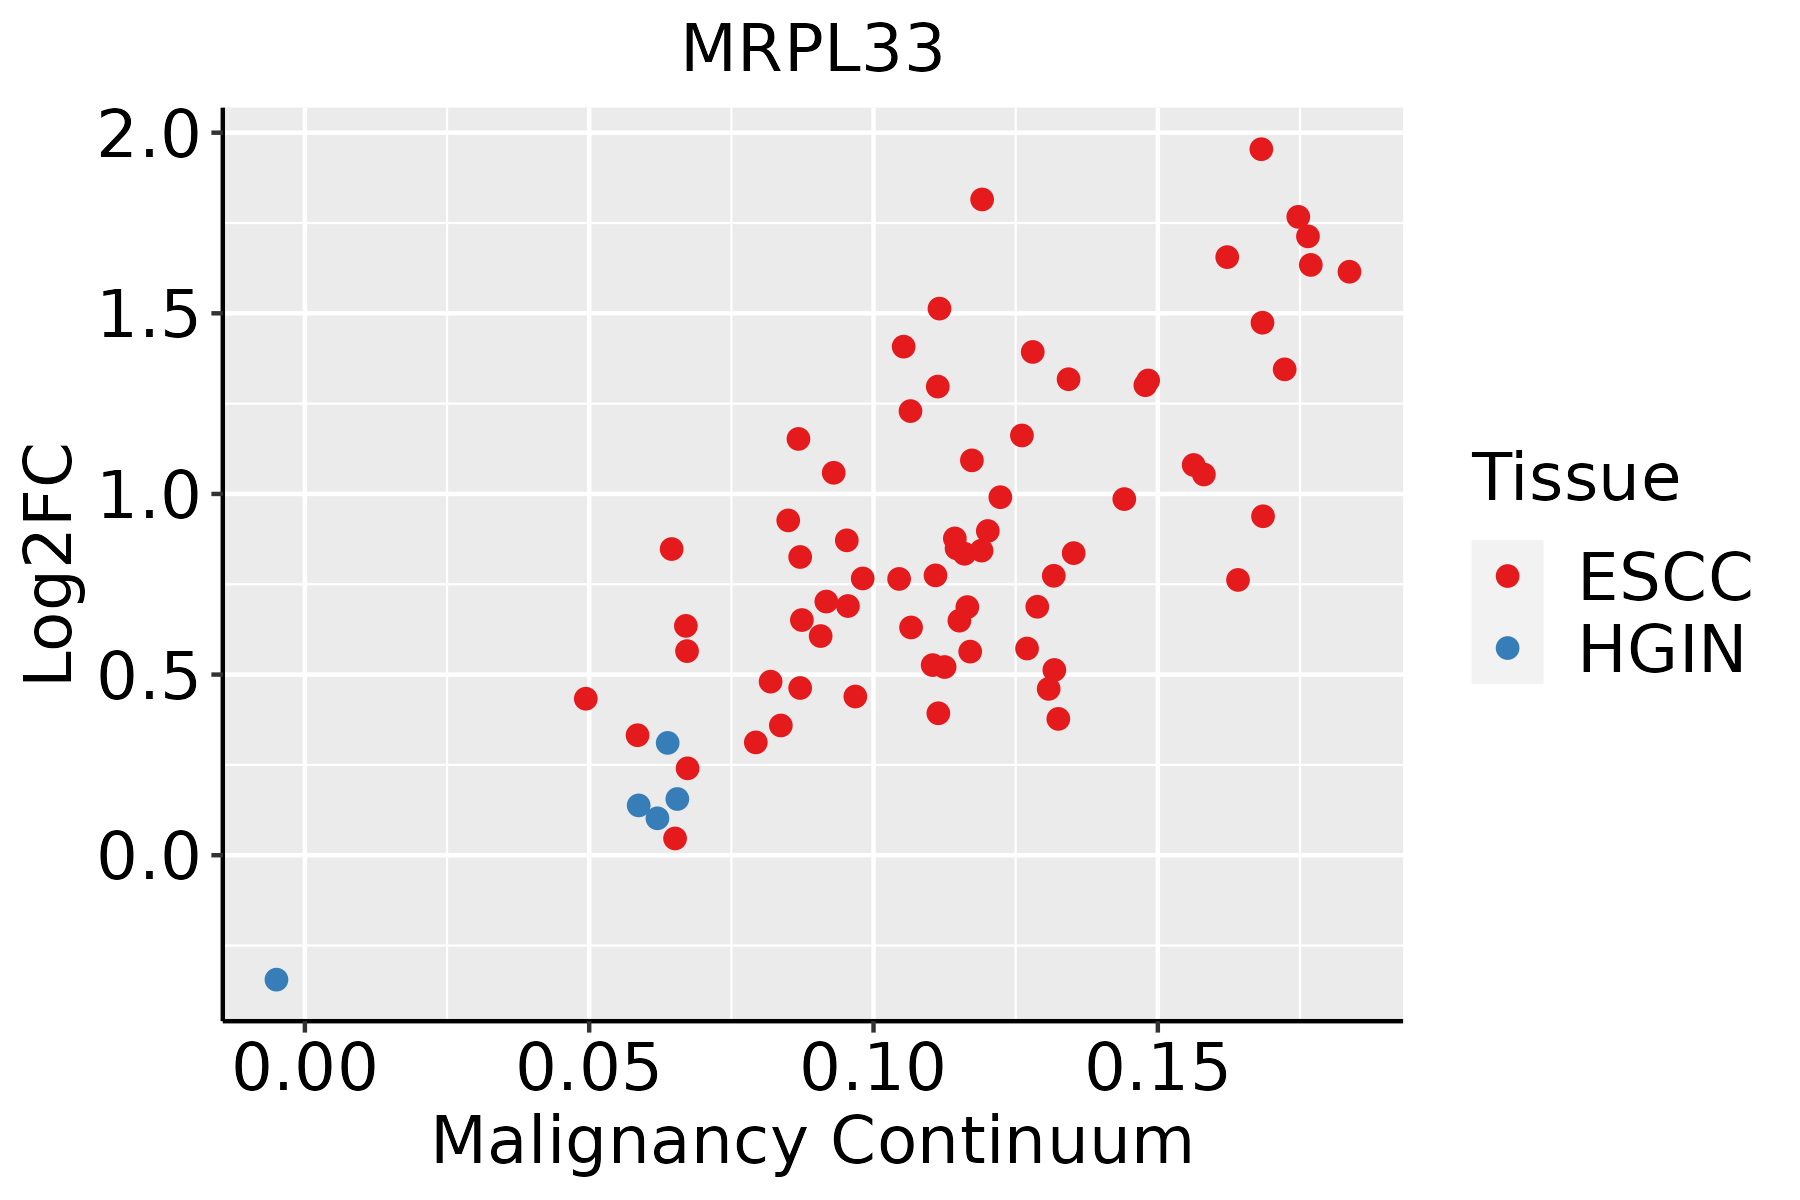 | ESCC: Esophageal squamous cell carcinoma |
| HGIN: High-grade intraepithelial neoplasias | ||
| LGIN: Low-grade intraepithelial neoplasias | ||
| Liver | 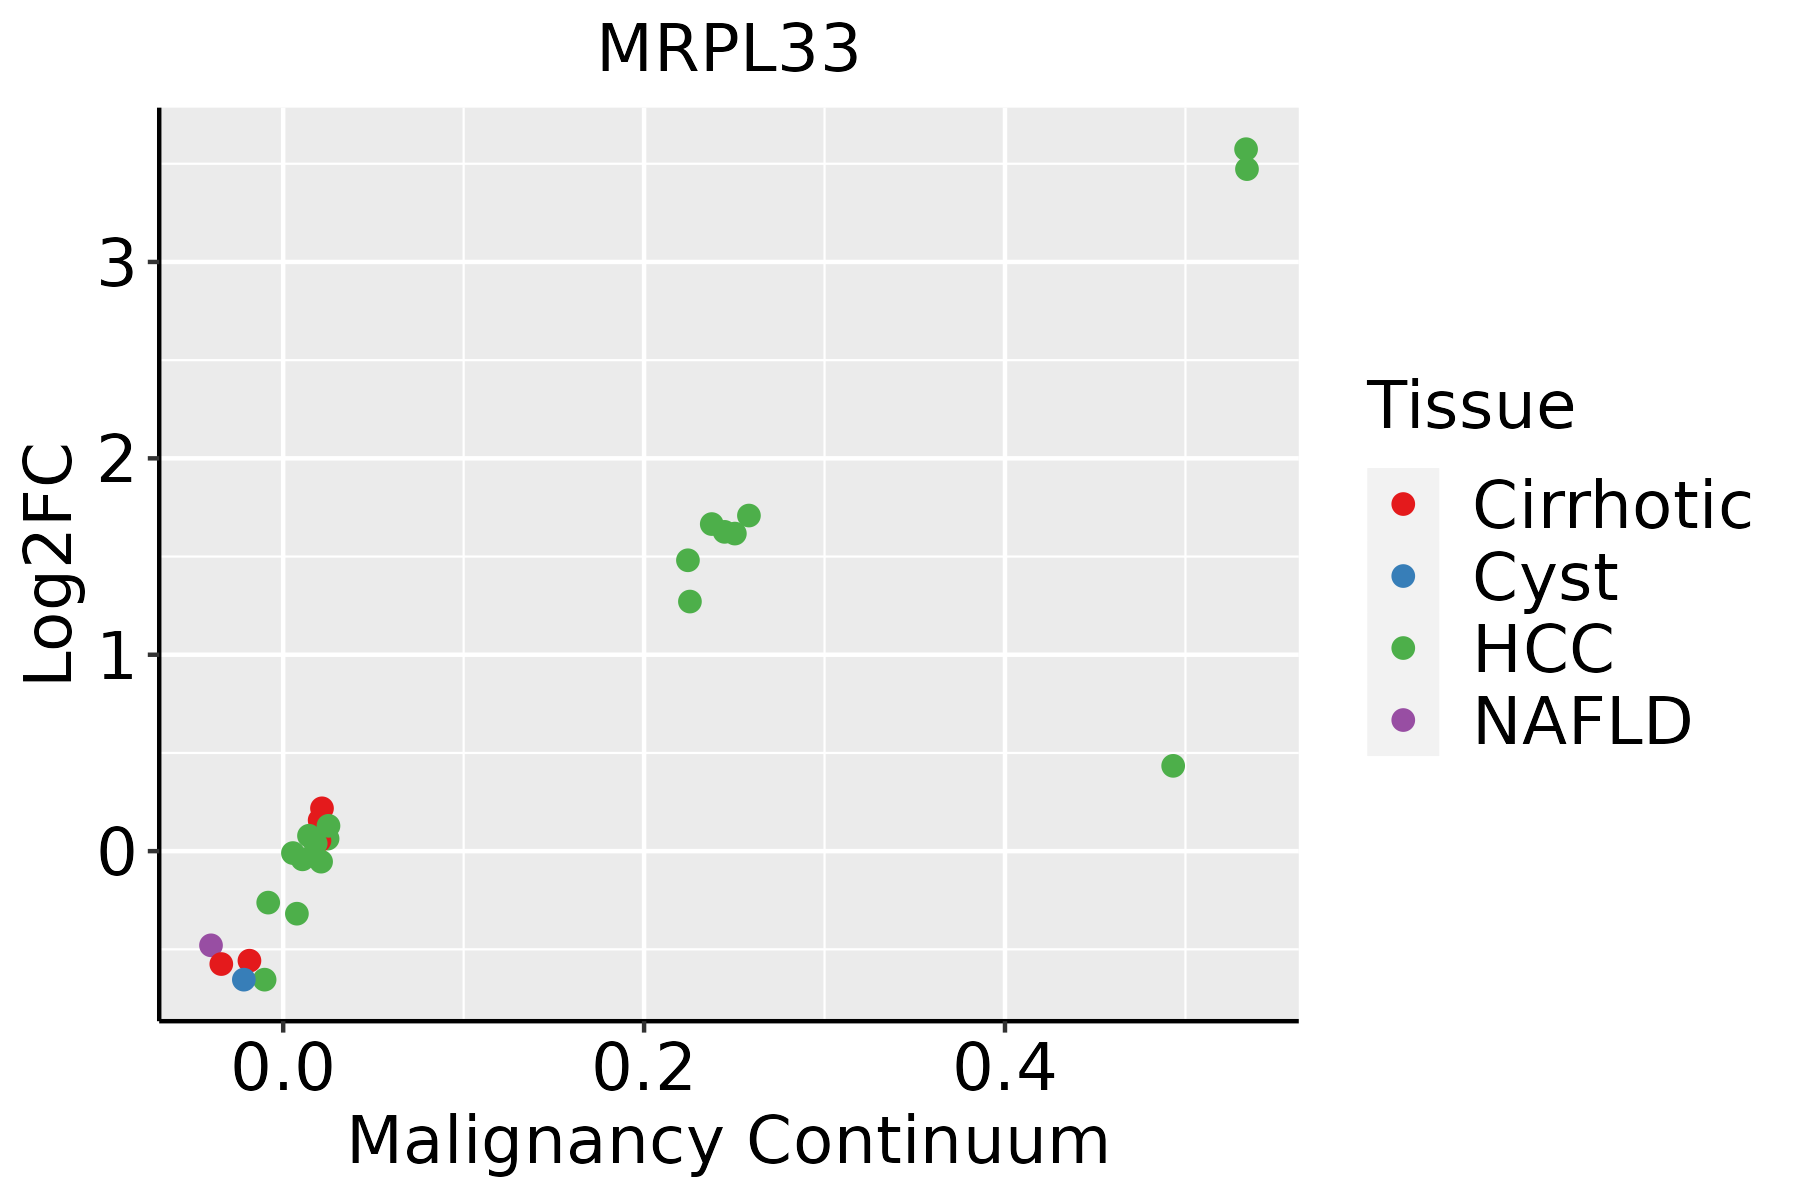 | HCC: Hepatocellular carcinoma |
| NAFLD: Non-alcoholic fatty liver disease | ||
| Oral Cavity |  | EOLP: Erosive Oral lichen planus |
| LP: leukoplakia | ||
| NEOLP: Non-erosive oral lichen planus | ||
| OSCC: Oral squamous cell carcinoma | ||
| Prostate | 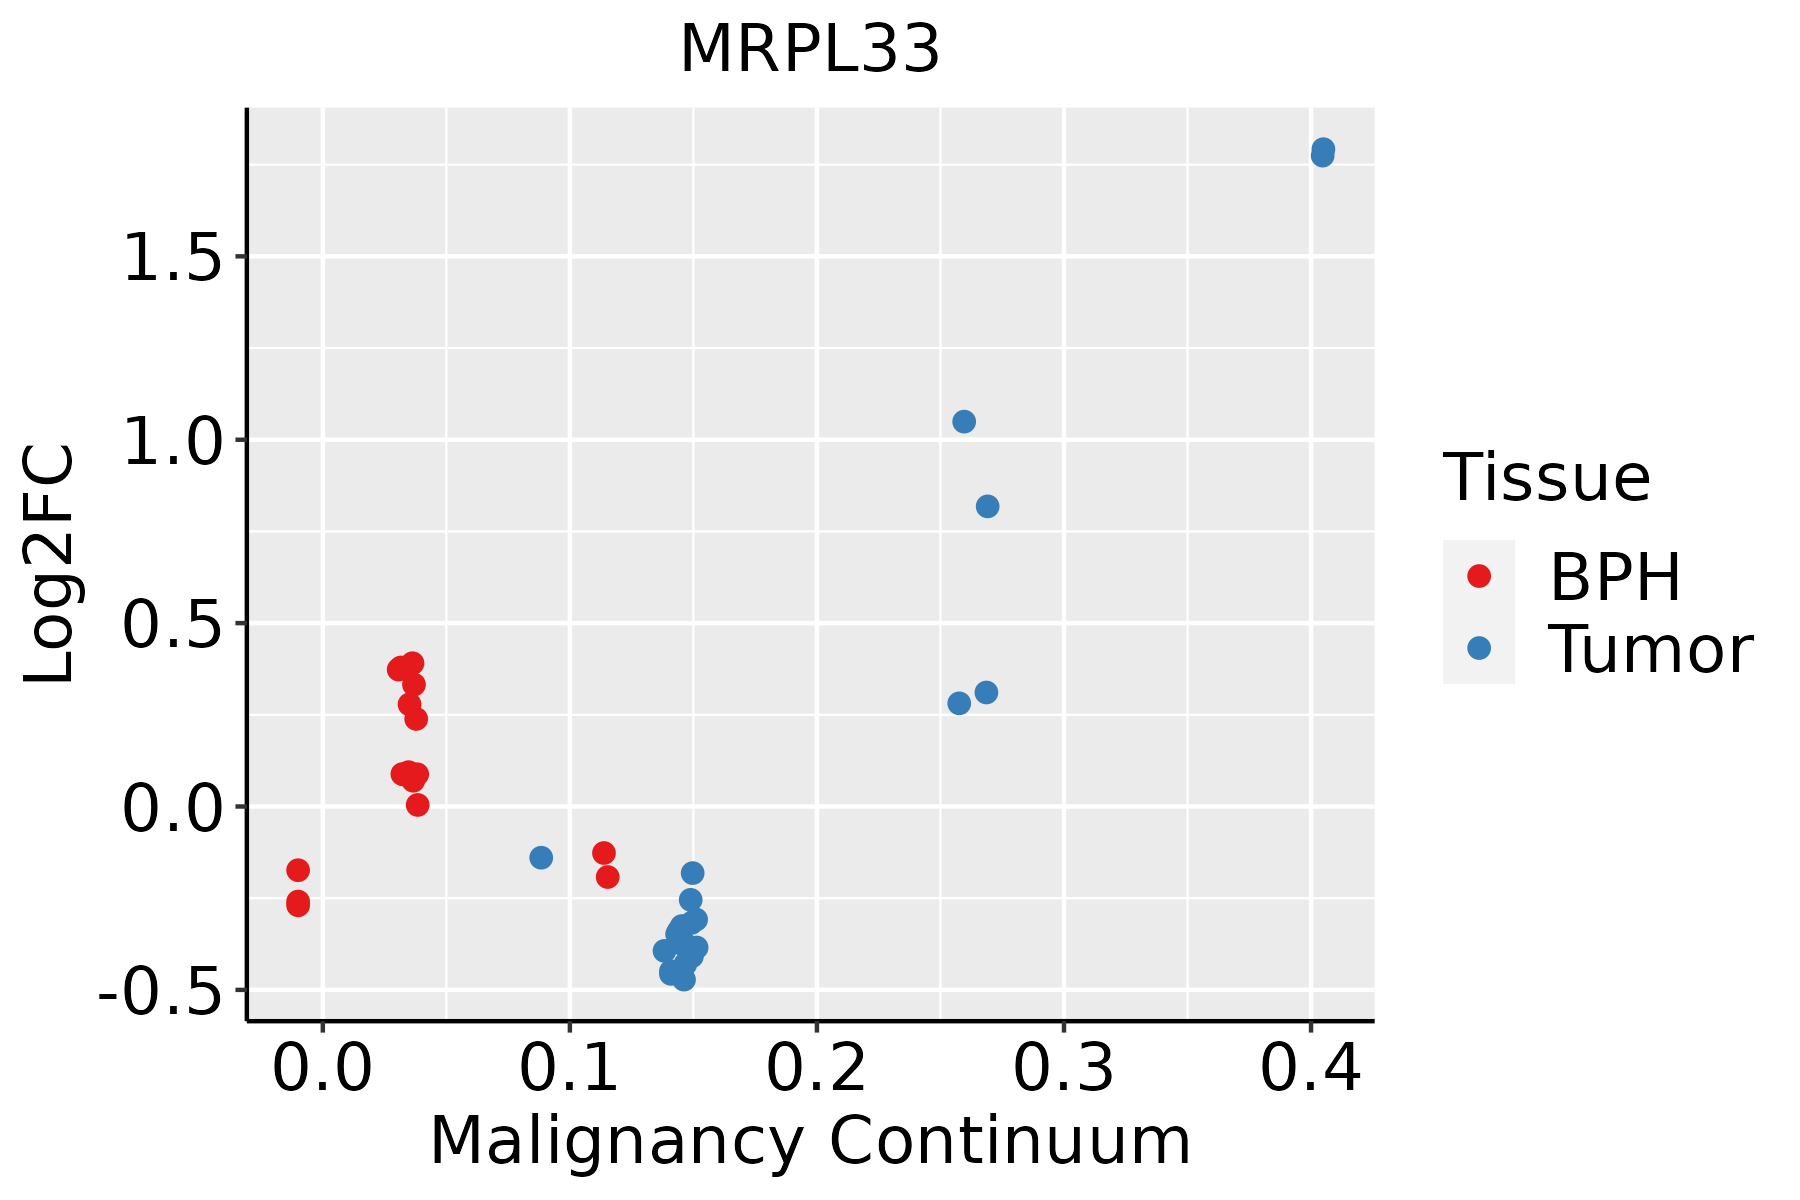 | BPH: Benign Prostatic Hyperplasia |
| Skin | 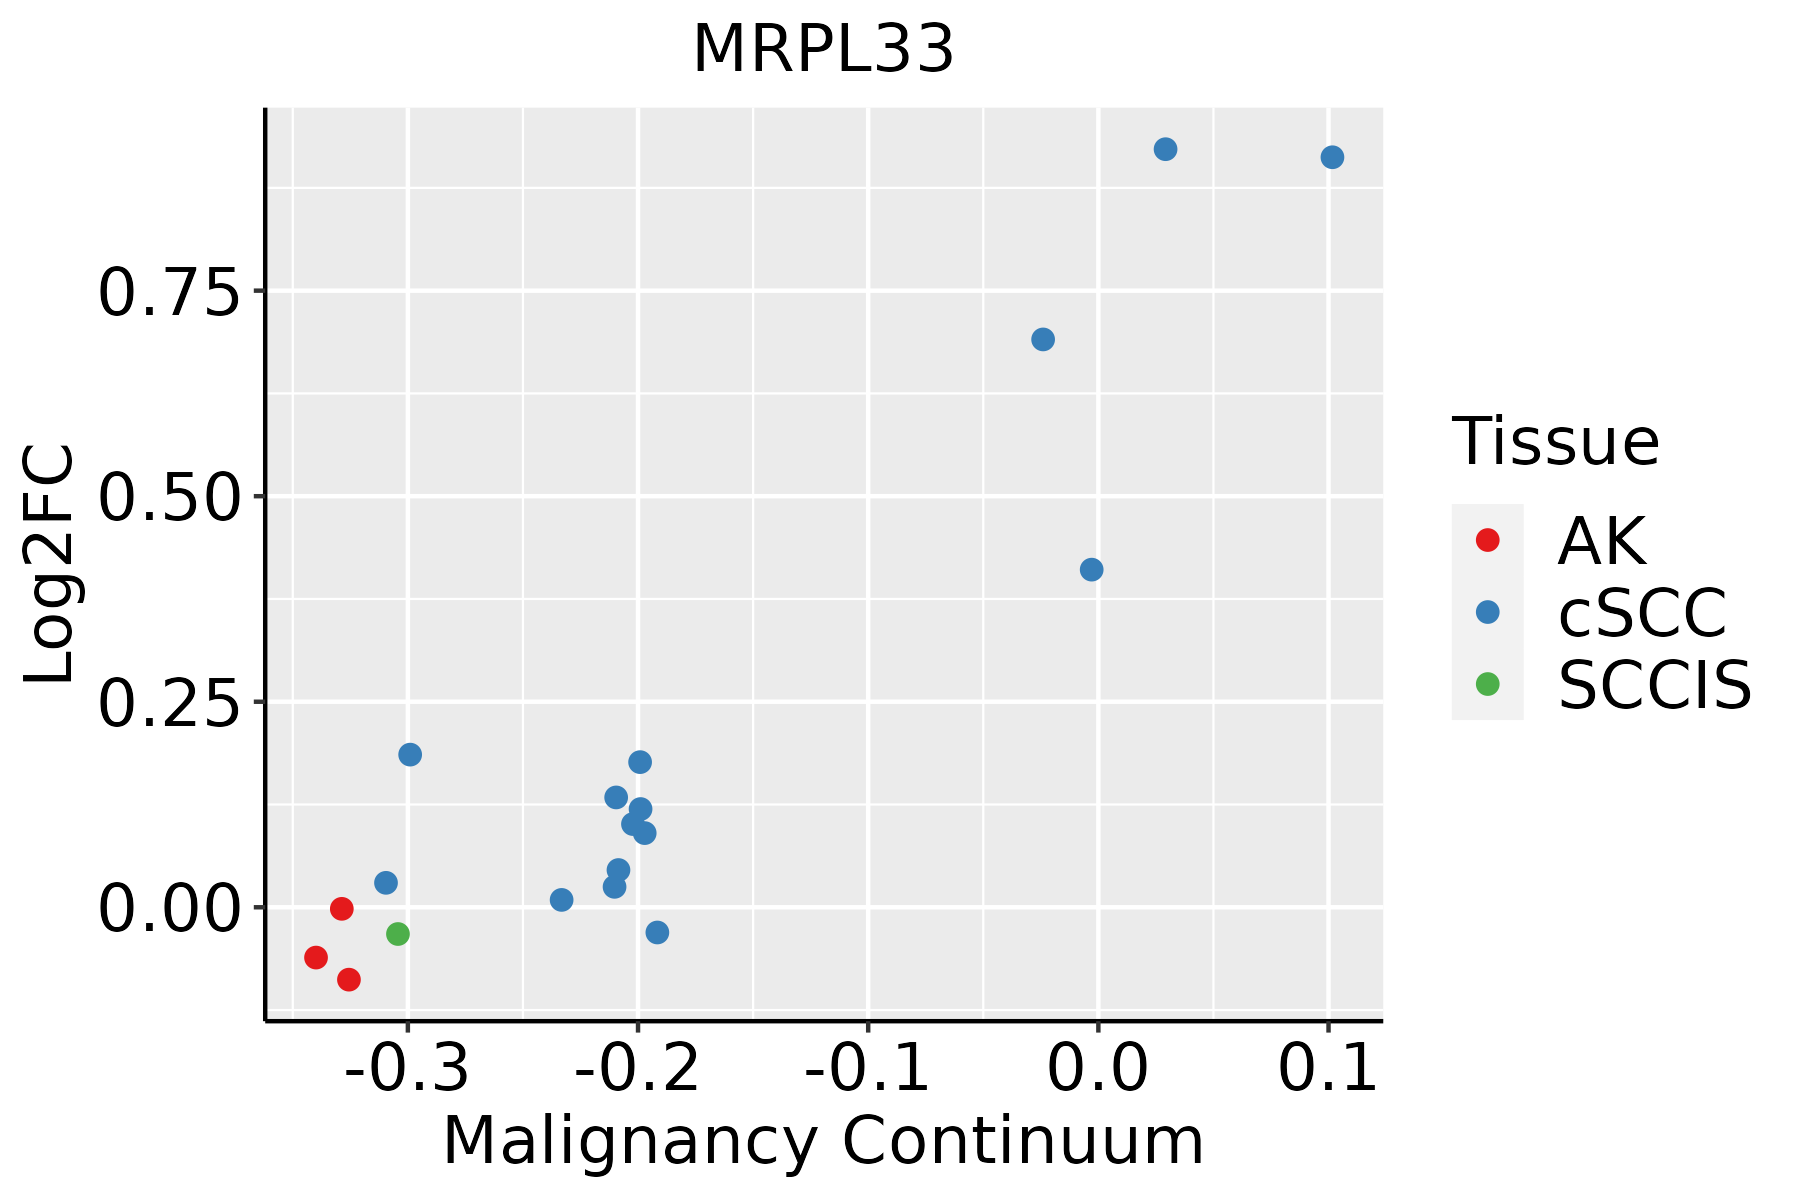 | AK: Actinic keratosis |
| cSCC: Cutaneous squamous cell carcinoma | ||
| SCCIS:squamous cell carcinoma in situ | ||
| Thyroid | 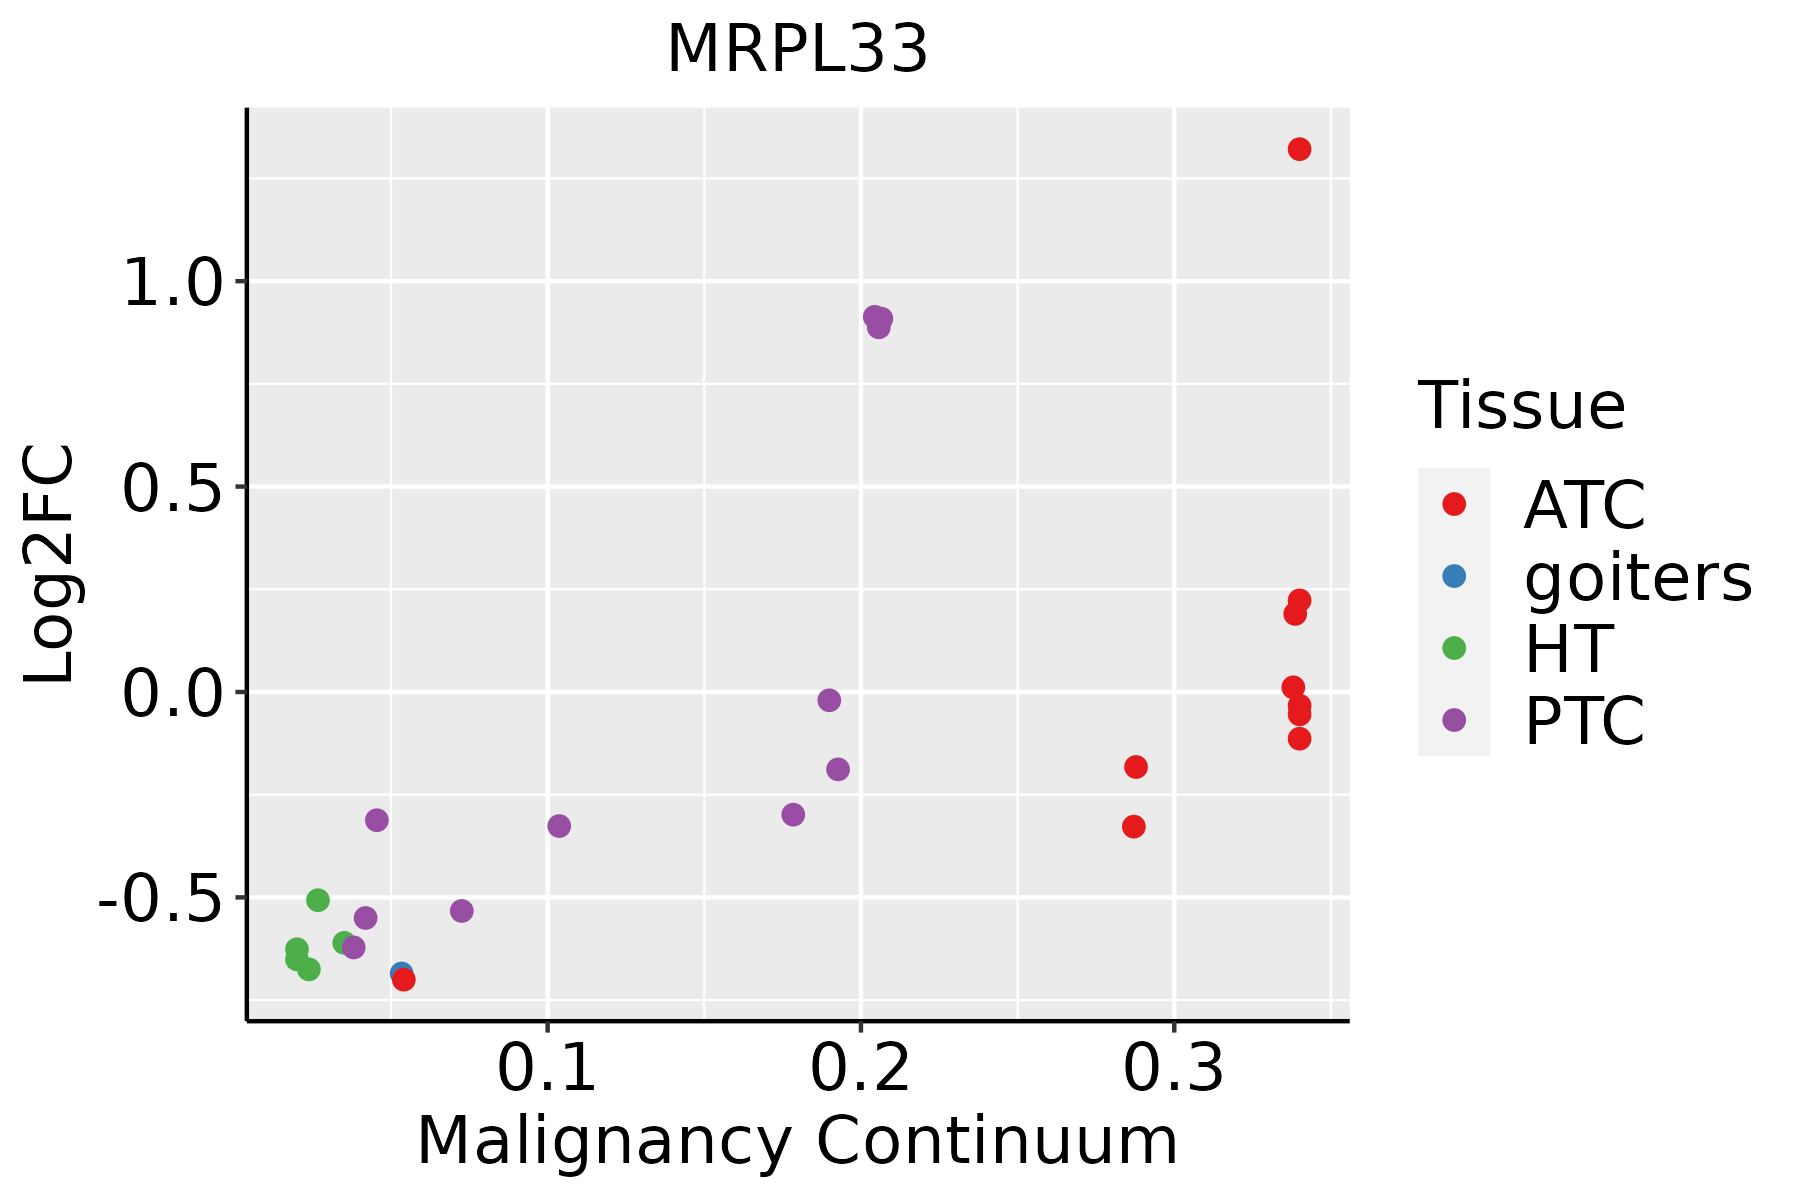 | ATC: Anaplastic thyroid cancer |
| HT: Hashimoto's thyroiditis | ||
| PTC: Papillary thyroid cancer |
| ∗log2FC in expression of this searched gene in stem-like cells from each diseased tissue sample relative to stem-like cells in normal samples in each tissue plotted against the malignancy continuum. Samples are colored based on if they are from different disease stage. |
Top |
Malignant transformation related pathway analysis |
| Find out the enriched GO biological processes and KEGG pathways involved in transition from healthy to precancer to cancer |
| Tissue | Disease Stage | Enriched GO biological Processes |
| Colorectum | AD |  |
| Colorectum | SER |  |
| Colorectum | MSS |  |
| Colorectum | MSI-H |  |
| Colorectum | FAP |  |
| ∗Top 15 enriched GO BP terms are showed in the bar plot of each disease state in each tissue. Each row represents a significant GO biological process which is colored according to the -log10(p.adjust). |
| Page: 1 2 3 4 5 6 7 8 9 |
| GO ID | Tissue | Disease Stage | Description | Gene Ratio | Bg Ratio | pvalue | p.adjust | Count |
| Page: 1 |
| Pathway ID | Tissue | Disease Stage | Description | Gene Ratio | Bg Ratio | pvalue | p.adjust | qvalue | Count |
| hsa0301020 | Cervix | CC | Ribosome | 85/1267 | 167/8465 | 3.17e-28 | 5.14e-26 | 3.04e-26 | 85 |
| hsa03010110 | Cervix | CC | Ribosome | 85/1267 | 167/8465 | 3.17e-28 | 5.14e-26 | 3.04e-26 | 85 |
| hsa0301026 | Endometrium | AEH | Ribosome | 89/1197 | 167/8465 | 1.88e-33 | 6.09e-31 | 4.46e-31 | 89 |
| hsa03010112 | Endometrium | AEH | Ribosome | 89/1197 | 167/8465 | 1.88e-33 | 6.09e-31 | 4.46e-31 | 89 |
| hsa0301027 | Endometrium | EEC | Ribosome | 89/1237 | 167/8465 | 2.55e-32 | 8.39e-30 | 6.26e-30 | 89 |
| hsa0301036 | Endometrium | EEC | Ribosome | 89/1237 | 167/8465 | 2.55e-32 | 8.39e-30 | 6.26e-30 | 89 |
| hsa0301039 | Esophagus | HGIN | Ribosome | 108/1383 | 167/8465 | 1.44e-45 | 4.71e-43 | 3.74e-43 | 108 |
| hsa03010115 | Esophagus | HGIN | Ribosome | 108/1383 | 167/8465 | 1.44e-45 | 4.71e-43 | 3.74e-43 | 108 |
| hsa03010211 | Esophagus | ESCC | Ribosome | 129/4205 | 167/8465 | 1.43e-13 | 3.43e-12 | 1.75e-12 | 129 |
| hsa03010310 | Esophagus | ESCC | Ribosome | 129/4205 | 167/8465 | 1.43e-13 | 3.43e-12 | 1.75e-12 | 129 |
| hsa0301022 | Liver | Cirrhotic | Ribosome | 127/2530 | 167/8465 | 2.12e-35 | 7.06e-33 | 4.35e-33 | 127 |
| hsa0301032 | Liver | Cirrhotic | Ribosome | 127/2530 | 167/8465 | 2.12e-35 | 7.06e-33 | 4.35e-33 | 127 |
| hsa0301042 | Liver | HCC | Ribosome | 128/4020 | 167/8465 | 7.32e-15 | 2.23e-13 | 1.24e-13 | 128 |
| hsa0301052 | Liver | HCC | Ribosome | 128/4020 | 167/8465 | 7.32e-15 | 2.23e-13 | 1.24e-13 | 128 |
| hsa0301062 | Liver | Cyst | Ribosome | 70/339 | 167/8465 | 5.37e-55 | 1.55e-52 | 1.28e-52 | 70 |
| hsa0301072 | Liver | Cyst | Ribosome | 70/339 | 167/8465 | 5.37e-55 | 1.55e-52 | 1.28e-52 | 70 |
| hsa0301030 | Oral cavity | OSCC | Ribosome | 128/3704 | 167/8465 | 2.42e-18 | 1.62e-16 | 8.25e-17 | 128 |
| hsa03010114 | Oral cavity | OSCC | Ribosome | 128/3704 | 167/8465 | 2.42e-18 | 1.62e-16 | 8.25e-17 | 128 |
| hsa03010210 | Oral cavity | LP | Ribosome | 127/2418 | 167/8465 | 1.22e-37 | 4.05e-35 | 2.61e-35 | 127 |
| hsa0301038 | Oral cavity | LP | Ribosome | 127/2418 | 167/8465 | 1.22e-37 | 4.05e-35 | 2.61e-35 | 127 |
| Page: 1 2 |
Top |
Cell-cell communication analysis |
| Identification of potential cell-cell interactions between two cell types and their ligand-receptor pairs for different disease states |
| Ligand | Receptor | LRpair | Pathway | Tissue | Disease Stage |
| Page: 1 |
Top |
Single-cell gene regulatory network inference analysis |
| Find out the significant the regulons (TFs) and the target genes of each regulon across cell types for different disease states |
| TF | Cell Type | Tissue | Disease Stage | Target Gene | RSS | Regulon Activity |
| ∗The dot plots of a searched regulon are shown for all cell subpopulations in each disease state of each tissue based on the regulon specific score inferred using pySCENIC and by calculating the average expression. |
| Page: 1 |
Top |
Somatic mutation of malignant transformation related genes |
| Annotation of somatic variants for genes involved in malignant transformation |
| Hugo Symbol | Variant Class | Variant Classification | dbSNP RS | HGVSc | HGVSp | HGVSp Short | SWISSPROT | BIOTYPE | SIFT | PolyPhen | Tumor Sample Barcode | Tissue | Histology | Sex | Age | Stage | Therapy Types | Drugs | Outcome |
| MRPL33 | SNV | Missense_Mutation | c.122T>C | p.Leu41Pro | p.L41P | O75394 | protein_coding | deleterious(0) | probably_damaging(0.965) | TCGA-AA-3864-01 | Colorectum | colon adenocarcinoma | Male | >=65 | I/II | Unknown | Unknown | SD | |
| MRPL33 | SNV | Missense_Mutation | rs763582483 | c.187N>T | p.Arg63Cys | p.R63C | O75394 | protein_coding | tolerated(0.07) | possibly_damaging(0.826) | TCGA-G4-6588-01 | Colorectum | colon adenocarcinoma | Female | <65 | I/II | Unknown | Unknown | SD |
| MRPL33 | SNV | Missense_Mutation | novel | c.91N>G | p.Asn31Asp | p.N31D | O75394 | protein_coding | tolerated(0.07) | possibly_damaging(0.897) | TCGA-AP-A1DK-01 | Endometrium | uterine corpus endometrioid carcinoma | Female | <65 | I/II | Unknown | Unknown | SD |
| MRPL33 | SNV | Missense_Mutation | novel | c.163N>A | p.Leu55Ile | p.L55I | O75394 | protein_coding | deleterious(0.04) | probably_damaging(0.998) | TCGA-AP-A1DK-01 | Endometrium | uterine corpus endometrioid carcinoma | Female | <65 | I/II | Unknown | Unknown | SD |
| MRPL33 | SNV | Missense_Mutation | novel | c.83N>C | p.Phe28Ser | p.F28S | O75394 | protein_coding | deleterious(0.02) | benign(0.224) | TCGA-AX-A06F-01 | Endometrium | uterine corpus endometrioid carcinoma | Female | <65 | III/IV | Chemotherapy | carboplatin | SD |
| MRPL33 | SNV | Missense_Mutation | c.4N>C | p.Phe2Leu | p.F2L | O75394 | protein_coding | tolerated_low_confidence(0.15) | benign(0.003) | TCGA-CG-5721-01 | Stomach | stomach adenocarcinoma | Male | <65 | III/IV | Unknown | Unknown | SD |
| Page: 1 |
Top |
Related drugs of malignant transformation related genes |
| Identification of chemicals and drugs interact with genes involved in malignant transfromation |
| (DGIdb 4.0) |
| Entrez ID | Symbol | Category | Interaction Types | Drug Claim Name | Drug Name | PMIDs |
| Page: 1 |

Copyright 2023-Present -The University of Texas Health Science Center at Houston |