
|
|||||
|
 | |
| |
| |
| |
| |
| |
|
Gene: MRPL30 |
Gene summary for MRPL30 |
| Gene information | Species | Human | Gene symbol | MRPL30 | Gene ID | 51263 |
| Gene name | mitochondrial ribosomal protein L30 | |
| Gene Alias | L28MT | |
| Cytomap | 2q11.2 | |
| Gene Type | protein-coding | GO ID | GO:0006412 | UniProtAcc | Q8TCC3 |
Top |
Malignant transformation analysis |
| Identification of the aberrant gene expression in precancerous and cancerous lesions by comparing the gene expression of stem-like cells in diseased tissues with normal stem cells |
| Entrez ID | Symbol | Replicates | Species | Organ | Tissue | Adj P-value | Log2FC | Malignancy |
| 51263 | MRPL30 | LZE4T | Human | Esophagus | ESCC | 5.27e-12 | 2.21e-01 | 0.0811 |
| 51263 | MRPL30 | LZE5T | Human | Esophagus | ESCC | 2.89e-03 | 3.78e-01 | 0.0514 |
| 51263 | MRPL30 | LZE7T | Human | Esophagus | ESCC | 3.91e-08 | 2.96e-01 | 0.0667 |
| 51263 | MRPL30 | LZE8T | Human | Esophagus | ESCC | 7.05e-03 | 3.37e-02 | 0.067 |
| 51263 | MRPL30 | LZE20T | Human | Esophagus | ESCC | 9.29e-03 | 9.88e-02 | 0.0662 |
| 51263 | MRPL30 | LZE24T | Human | Esophagus | ESCC | 3.74e-14 | 4.02e-01 | 0.0596 |
| 51263 | MRPL30 | LZE21T | Human | Esophagus | ESCC | 4.22e-02 | 2.56e-01 | 0.0655 |
| 51263 | MRPL30 | LZE6T | Human | Esophagus | ESCC | 2.70e-05 | 1.79e-01 | 0.0845 |
| 51263 | MRPL30 | P1T-E | Human | Esophagus | ESCC | 1.28e-03 | 1.35e-01 | 0.0875 |
| 51263 | MRPL30 | P2T-E | Human | Esophagus | ESCC | 3.23e-24 | 4.55e-01 | 0.1177 |
| 51263 | MRPL30 | P4T-E | Human | Esophagus | ESCC | 1.59e-29 | 5.47e-01 | 0.1323 |
| 51263 | MRPL30 | P5T-E | Human | Esophagus | ESCC | 1.43e-20 | 4.67e-01 | 0.1327 |
| 51263 | MRPL30 | P8T-E | Human | Esophagus | ESCC | 1.12e-13 | 2.27e-01 | 0.0889 |
| 51263 | MRPL30 | P9T-E | Human | Esophagus | ESCC | 7.15e-25 | 5.00e-01 | 0.1131 |
| 51263 | MRPL30 | P10T-E | Human | Esophagus | ESCC | 1.63e-30 | 6.76e-01 | 0.116 |
| 51263 | MRPL30 | P11T-E | Human | Esophagus | ESCC | 4.15e-13 | 4.74e-01 | 0.1426 |
| 51263 | MRPL30 | P12T-E | Human | Esophagus | ESCC | 8.26e-24 | 4.65e-01 | 0.1122 |
| 51263 | MRPL30 | P15T-E | Human | Esophagus | ESCC | 3.14e-24 | 4.95e-01 | 0.1149 |
| 51263 | MRPL30 | P16T-E | Human | Esophagus | ESCC | 3.84e-21 | 3.21e-01 | 0.1153 |
| 51263 | MRPL30 | P17T-E | Human | Esophagus | ESCC | 1.87e-09 | 4.60e-01 | 0.1278 |
| Page: 1 2 3 4 5 |
| Tissue | Expression Dynamics | Abbreviation |
| Esophagus |  | ESCC: Esophageal squamous cell carcinoma |
| HGIN: High-grade intraepithelial neoplasias | ||
| LGIN: Low-grade intraepithelial neoplasias | ||
| Liver |  | HCC: Hepatocellular carcinoma |
| NAFLD: Non-alcoholic fatty liver disease | ||
| Oral Cavity | 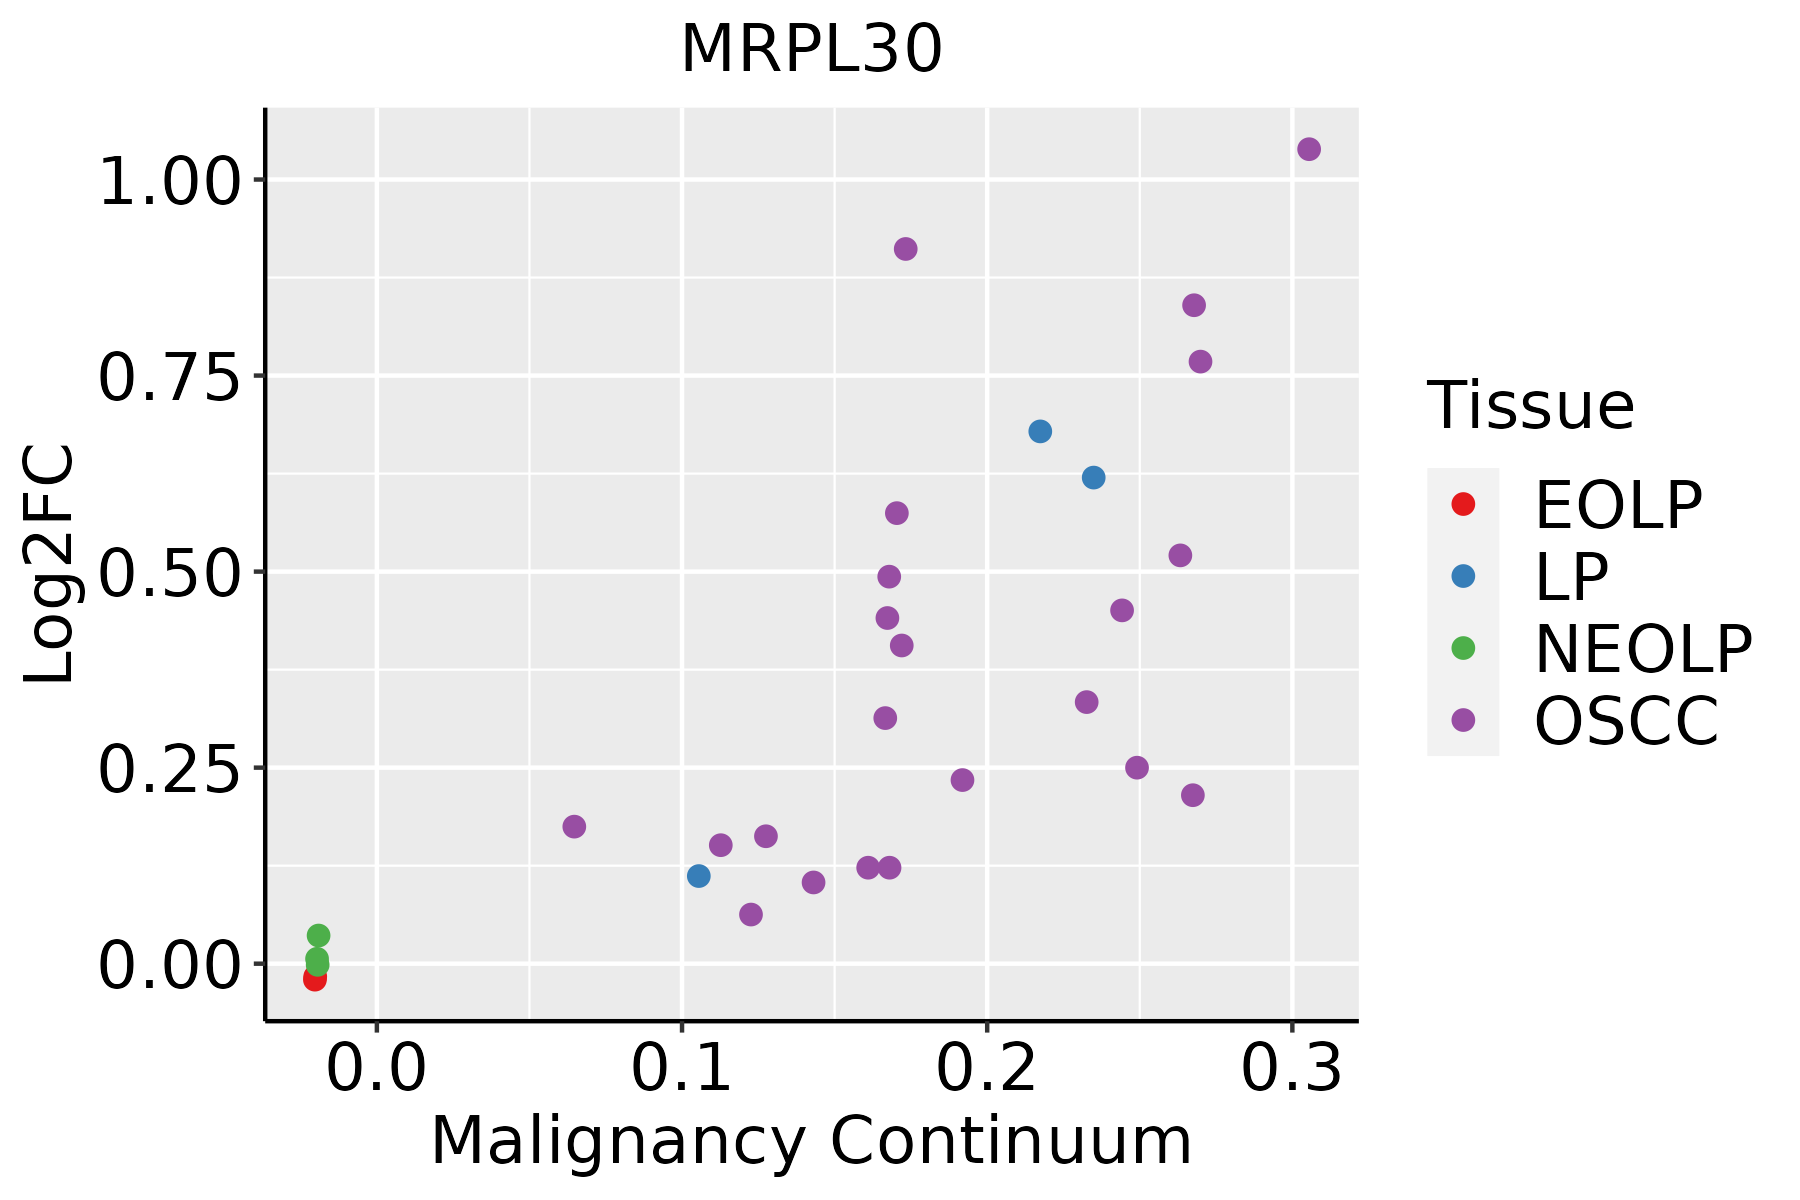 | EOLP: Erosive Oral lichen planus |
| LP: leukoplakia | ||
| NEOLP: Non-erosive oral lichen planus | ||
| OSCC: Oral squamous cell carcinoma |
| ∗log2FC in expression of this searched gene in stem-like cells from each diseased tissue sample relative to stem-like cells in normal samples in each tissue plotted against the malignancy continuum. Samples are colored based on if they are from different disease stage. |
Top |
Malignant transformation related pathway analysis |
| Find out the enriched GO biological processes and KEGG pathways involved in transition from healthy to precancer to cancer |
| Tissue | Disease Stage | Enriched GO biological Processes |
| Colorectum | AD |  |
| Colorectum | SER |  |
| Colorectum | MSS |  |
| Colorectum | MSI-H |  |
| Colorectum | FAP |  |
| ∗Top 15 enriched GO BP terms are showed in the bar plot of each disease state in each tissue. Each row represents a significant GO biological process which is colored according to the -log10(p.adjust). |
| Page: 1 2 3 4 5 6 7 8 9 |
| GO ID | Tissue | Disease Stage | Description | Gene Ratio | Bg Ratio | pvalue | p.adjust | Count |
| Page: 1 |
| Pathway ID | Tissue | Disease Stage | Description | Gene Ratio | Bg Ratio | pvalue | p.adjust | qvalue | Count |
| hsa03010211 | Esophagus | ESCC | Ribosome | 129/4205 | 167/8465 | 1.43e-13 | 3.43e-12 | 1.75e-12 | 129 |
| hsa03010310 | Esophagus | ESCC | Ribosome | 129/4205 | 167/8465 | 1.43e-13 | 3.43e-12 | 1.75e-12 | 129 |
| hsa0301042 | Liver | HCC | Ribosome | 128/4020 | 167/8465 | 7.32e-15 | 2.23e-13 | 1.24e-13 | 128 |
| hsa0301052 | Liver | HCC | Ribosome | 128/4020 | 167/8465 | 7.32e-15 | 2.23e-13 | 1.24e-13 | 128 |
| hsa0301030 | Oral cavity | OSCC | Ribosome | 128/3704 | 167/8465 | 2.42e-18 | 1.62e-16 | 8.25e-17 | 128 |
| hsa03010114 | Oral cavity | OSCC | Ribosome | 128/3704 | 167/8465 | 2.42e-18 | 1.62e-16 | 8.25e-17 | 128 |
| hsa03010210 | Oral cavity | LP | Ribosome | 127/2418 | 167/8465 | 1.22e-37 | 4.05e-35 | 2.61e-35 | 127 |
| hsa0301038 | Oral cavity | LP | Ribosome | 127/2418 | 167/8465 | 1.22e-37 | 4.05e-35 | 2.61e-35 | 127 |
| Page: 1 |
Top |
Cell-cell communication analysis |
| Identification of potential cell-cell interactions between two cell types and their ligand-receptor pairs for different disease states |
| Ligand | Receptor | LRpair | Pathway | Tissue | Disease Stage |
| Page: 1 |
Top |
Single-cell gene regulatory network inference analysis |
| Find out the significant the regulons (TFs) and the target genes of each regulon across cell types for different disease states |
| TF | Cell Type | Tissue | Disease Stage | Target Gene | RSS | Regulon Activity |
| ∗The dot plots of a searched regulon are shown for all cell subpopulations in each disease state of each tissue based on the regulon specific score inferred using pySCENIC and by calculating the average expression. |
| Page: 1 |
Top |
Somatic mutation of malignant transformation related genes |
| Annotation of somatic variants for genes involved in malignant transformation |
| Hugo Symbol | Variant Class | Variant Classification | dbSNP RS | HGVSc | HGVSp | HGVSp Short | SWISSPROT | BIOTYPE | SIFT | PolyPhen | Tumor Sample Barcode | Tissue | Histology | Sex | Age | Stage | Therapy Types | Drugs | Outcome |
| MRPL30 | SNV | Missense_Mutation | c.274G>C | p.Glu92Gln | p.E92Q | Q8TCC3 | protein_coding | tolerated(0.41) | benign(0.018) | TCGA-AN-A0XW-01 | Breast | breast invasive carcinoma | Female | <65 | III/IV | Unknown | Unknown | SD | |
| MRPL30 | SNV | Missense_Mutation | c.97N>T | p.Arg33Cys | p.R33C | Q8TCC3 | protein_coding | tolerated(0.08) | benign(0.01) | TCGA-FU-A3HZ-01 | Cervix | cervical & endocervical cancer | Female | <65 | I/II | Chemotherapy | cisplatin | CR | |
| MRPL30 | SNV | Missense_Mutation | c.97C>T | p.Arg33Cys | p.R33C | Q8TCC3 | protein_coding | tolerated(0.08) | benign(0.01) | TCGA-AA-3510-01 | Colorectum | colon adenocarcinoma | Male | >=65 | I/II | Unknown | Unknown | SD | |
| MRPL30 | SNV | Missense_Mutation | c.277A>C | p.Lys93Gln | p.K93Q | Q8TCC3 | protein_coding | deleterious(0.04) | possibly_damaging(0.715) | TCGA-AA-3510-01 | Colorectum | colon adenocarcinoma | Male | >=65 | I/II | Unknown | Unknown | SD | |
| MRPL30 | SNV | Missense_Mutation | novel | c.119N>T | p.Arg40Ile | p.R40I | Q8TCC3 | protein_coding | deleterious(0) | probably_damaging(0.972) | TCGA-AZ-4315-01 | Colorectum | colon adenocarcinoma | Male | <65 | I/II | Unknown | Unknown | SD |
| MRPL30 | SNV | Missense_Mutation | rs768048434 | c.17N>A | p.Arg6His | p.R6H | Q8TCC3 | protein_coding | tolerated(0.17) | benign(0) | TCGA-A5-A0G9-01 | Endometrium | uterine corpus endometrioid carcinoma | Female | >=65 | I/II | Unknown | Unknown | SD |
| MRPL30 | SNV | Missense_Mutation | c.97N>A | p.Arg33Ser | p.R33S | Q8TCC3 | protein_coding | deleterious(0.01) | possibly_damaging(0.492) | TCGA-B5-A11E-01 | Endometrium | uterine corpus endometrioid carcinoma | Female | <65 | I/II | Unknown | Unknown | SD | |
| MRPL30 | SNV | Missense_Mutation | c.259A>C | p.Lys87Gln | p.K87Q | Q8TCC3 | protein_coding | tolerated(0.05) | possibly_damaging(0.869) | TCGA-BS-A0UV-01 | Endometrium | uterine corpus endometrioid carcinoma | Female | <65 | III/IV | Unknown | Unknown | SD | |
| MRPL30 | SNV | Missense_Mutation | rs771623578 | c.86C>T | p.Thr29Ile | p.T29I | Q8TCC3 | protein_coding | deleterious(0.04) | benign(0.003) | TCGA-EY-A1GQ-01 | Endometrium | uterine corpus endometrioid carcinoma | Female | >=65 | I/II | Chemotherapy | taxol | SD |
| MRPL30 | deletion | Frame_Shift_Del | novel | c.34delN | p.Pro13GlnfsTer7 | p.P13Qfs*7 | Q8TCC3 | protein_coding | TCGA-DI-A1BU-01 | Endometrium | uterine corpus endometrioid carcinoma | Female | <65 | I/II | Chemotherapy | paclitaxel | SD |
| Page: 1 2 |
Top |
Related drugs of malignant transformation related genes |
| Identification of chemicals and drugs interact with genes involved in malignant transfromation |
| (DGIdb 4.0) |
| Entrez ID | Symbol | Category | Interaction Types | Drug Claim Name | Drug Name | PMIDs |
| Page: 1 |

Copyright 2023-Present -The University of Texas Health Science Center at Houston |