
|
|||||
|
 | |
| |
| |
| |
| |
| |
|
Gene: MRPL3 |
Gene summary for MRPL3 |
| Gene information | Species | Human | Gene symbol | MRPL3 | Gene ID | 11222 |
| Gene name | mitochondrial ribosomal protein L3 | |
| Gene Alias | COXPD9 | |
| Cytomap | 3q22.1 | |
| Gene Type | protein-coding | GO ID | GO:0006412 | UniProtAcc | P09001 |
Top |
Malignant transformation analysis |
| Identification of the aberrant gene expression in precancerous and cancerous lesions by comparing the gene expression of stem-like cells in diseased tissues with normal stem cells |
| Entrez ID | Symbol | Replicates | Species | Organ | Tissue | Adj P-value | Log2FC | Malignancy |
| 11222 | MRPL3 | HTA11_99999970781_79442 | Human | Colorectum | MSS | 1.12e-06 | 5.76e-01 | 0.294 |
| 11222 | MRPL3 | HTA11_99999965104_69814 | Human | Colorectum | MSS | 5.11e-09 | 7.22e-01 | 0.281 |
| 11222 | MRPL3 | A015-C-203 | Human | Colorectum | FAP | 1.90e-13 | -3.52e-01 | -0.1294 |
| 11222 | MRPL3 | A015-C-204 | Human | Colorectum | FAP | 6.53e-04 | -2.49e-01 | -0.0228 |
| 11222 | MRPL3 | A002-C-201 | Human | Colorectum | FAP | 4.18e-09 | -3.11e-01 | 0.0324 |
| 11222 | MRPL3 | A001-C-119 | Human | Colorectum | FAP | 1.24e-11 | -4.29e-01 | -0.1557 |
| 11222 | MRPL3 | A001-C-108 | Human | Colorectum | FAP | 4.93e-10 | -2.86e-01 | -0.0272 |
| 11222 | MRPL3 | A002-C-205 | Human | Colorectum | FAP | 1.62e-13 | -3.63e-01 | -0.1236 |
| 11222 | MRPL3 | A001-C-104 | Human | Colorectum | FAP | 3.10e-02 | -2.11e-01 | 0.0184 |
| 11222 | MRPL3 | A015-C-005 | Human | Colorectum | FAP | 7.26e-03 | -2.55e-01 | -0.0336 |
| 11222 | MRPL3 | A015-C-006 | Human | Colorectum | FAP | 4.75e-09 | -3.66e-01 | -0.0994 |
| 11222 | MRPL3 | A015-C-106 | Human | Colorectum | FAP | 1.91e-05 | -2.52e-01 | -0.0511 |
| 11222 | MRPL3 | A002-C-114 | Human | Colorectum | FAP | 1.90e-11 | -3.84e-01 | -0.1561 |
| 11222 | MRPL3 | A015-C-104 | Human | Colorectum | FAP | 2.07e-15 | -3.40e-01 | -0.1899 |
| 11222 | MRPL3 | A001-C-014 | Human | Colorectum | FAP | 7.67e-05 | -2.57e-01 | 0.0135 |
| 11222 | MRPL3 | A002-C-016 | Human | Colorectum | FAP | 1.69e-11 | -3.21e-01 | 0.0521 |
| 11222 | MRPL3 | A015-C-002 | Human | Colorectum | FAP | 4.06e-06 | -2.98e-01 | -0.0763 |
| 11222 | MRPL3 | A001-C-203 | Human | Colorectum | FAP | 1.92e-06 | -2.34e-01 | -0.0481 |
| 11222 | MRPL3 | A002-C-116 | Human | Colorectum | FAP | 1.84e-13 | -3.12e-01 | -0.0452 |
| 11222 | MRPL3 | A014-C-008 | Human | Colorectum | FAP | 2.31e-08 | -3.59e-01 | -0.191 |
| Page: 1 2 3 4 5 6 7 8 |
| Tissue | Expression Dynamics | Abbreviation |
| Colorectum (GSE201348) |  | FAP: Familial adenomatous polyposis |
| CRC: Colorectal cancer | ||
| Colorectum (HTA11) |  | AD: Adenomas |
| SER: Sessile serrated lesions | ||
| MSI-H: Microsatellite-high colorectal cancer | ||
| MSS: Microsatellite stable colorectal cancer | ||
| Esophagus | 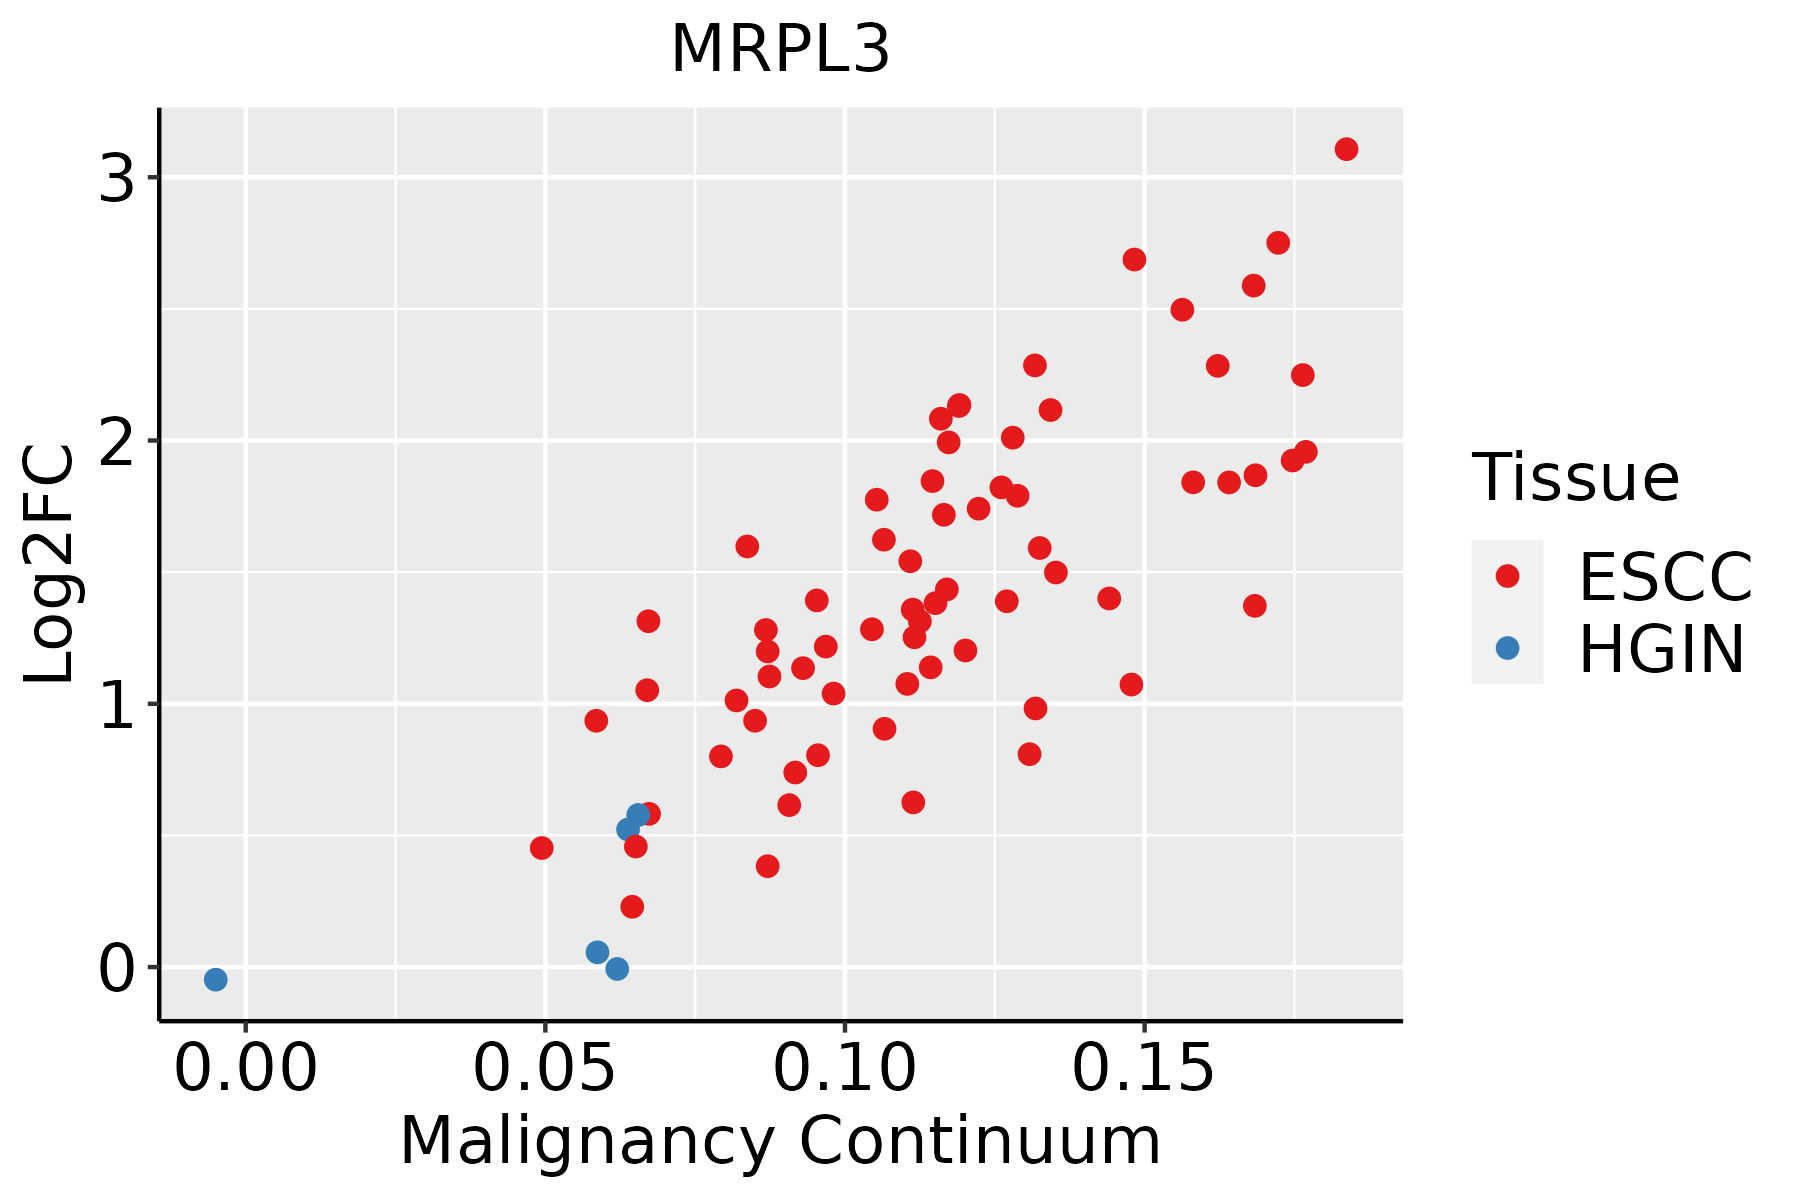 | ESCC: Esophageal squamous cell carcinoma |
| HGIN: High-grade intraepithelial neoplasias | ||
| LGIN: Low-grade intraepithelial neoplasias | ||
| Liver |  | HCC: Hepatocellular carcinoma |
| NAFLD: Non-alcoholic fatty liver disease | ||
| Oral Cavity | 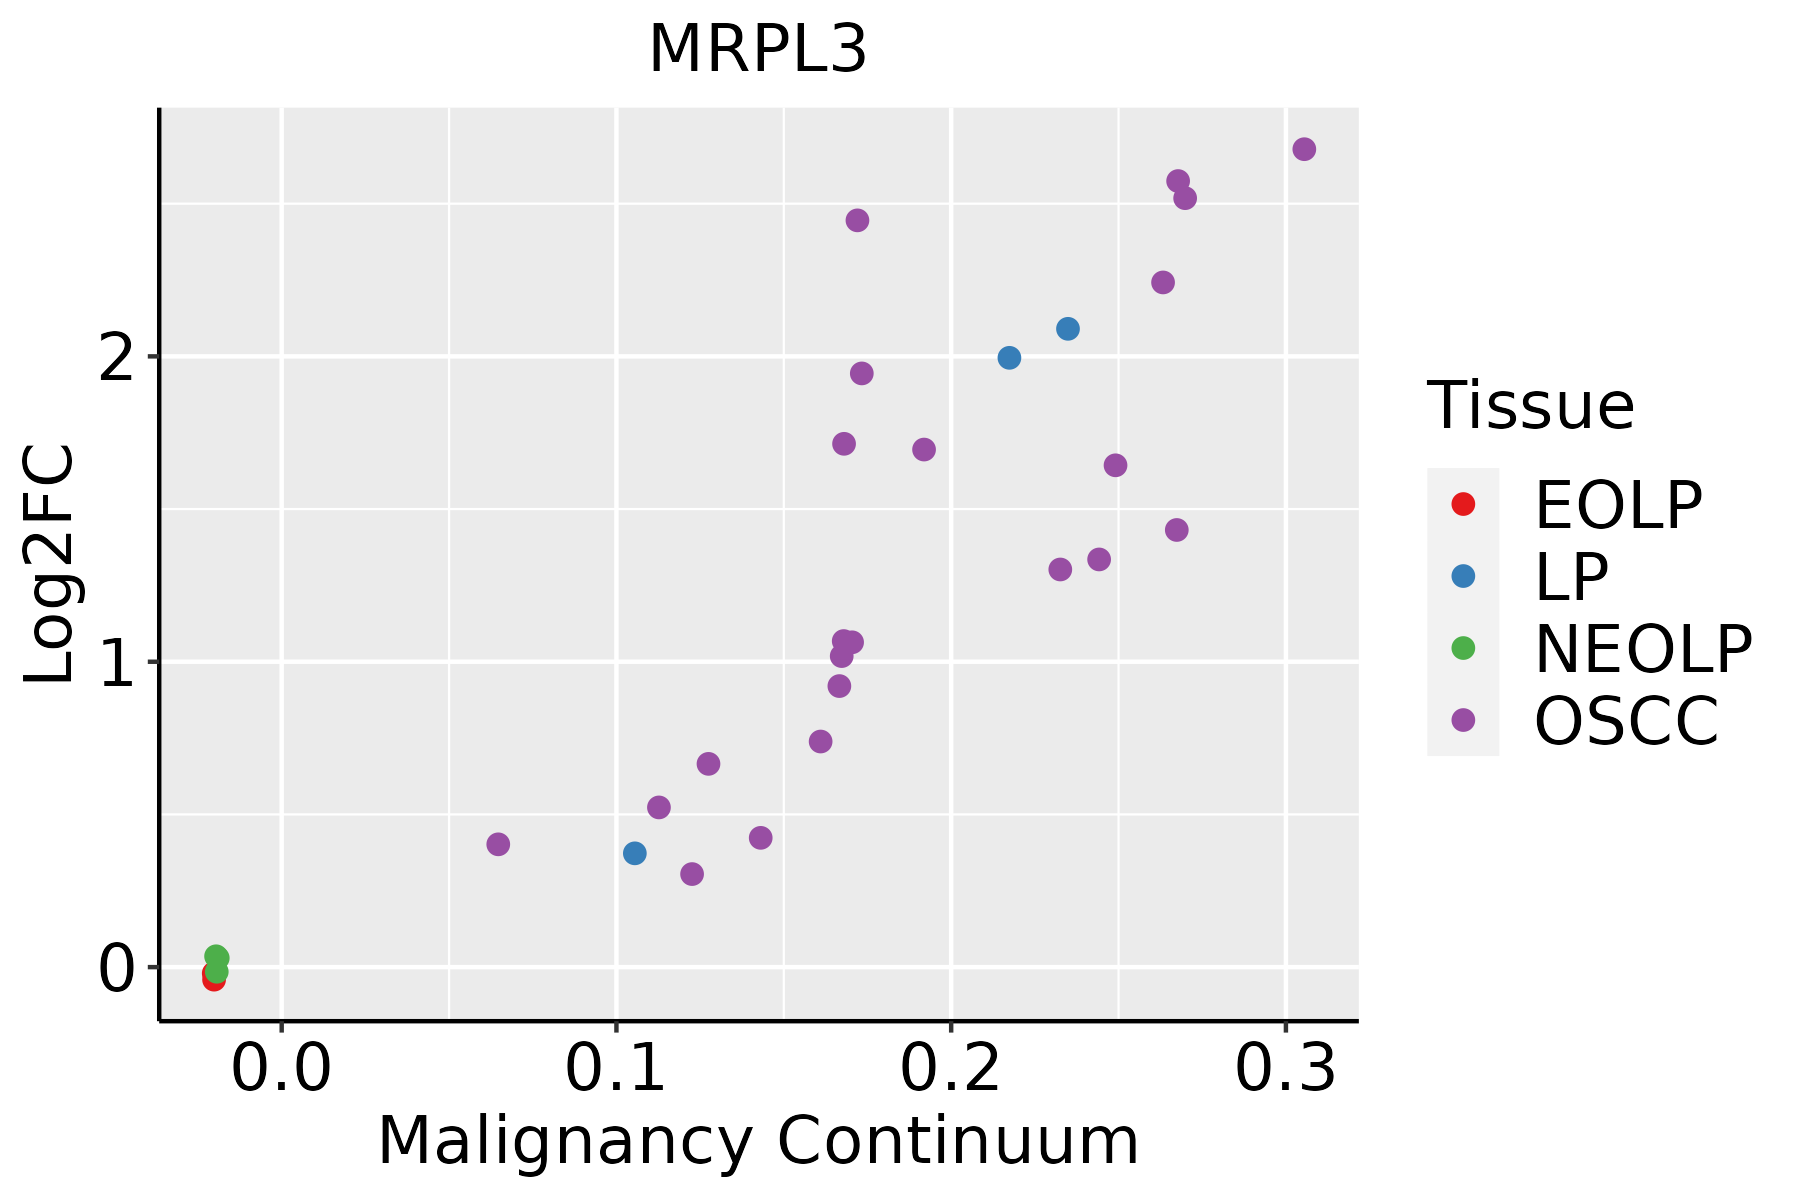 | EOLP: Erosive Oral lichen planus |
| LP: leukoplakia | ||
| NEOLP: Non-erosive oral lichen planus | ||
| OSCC: Oral squamous cell carcinoma | ||
| Skin | 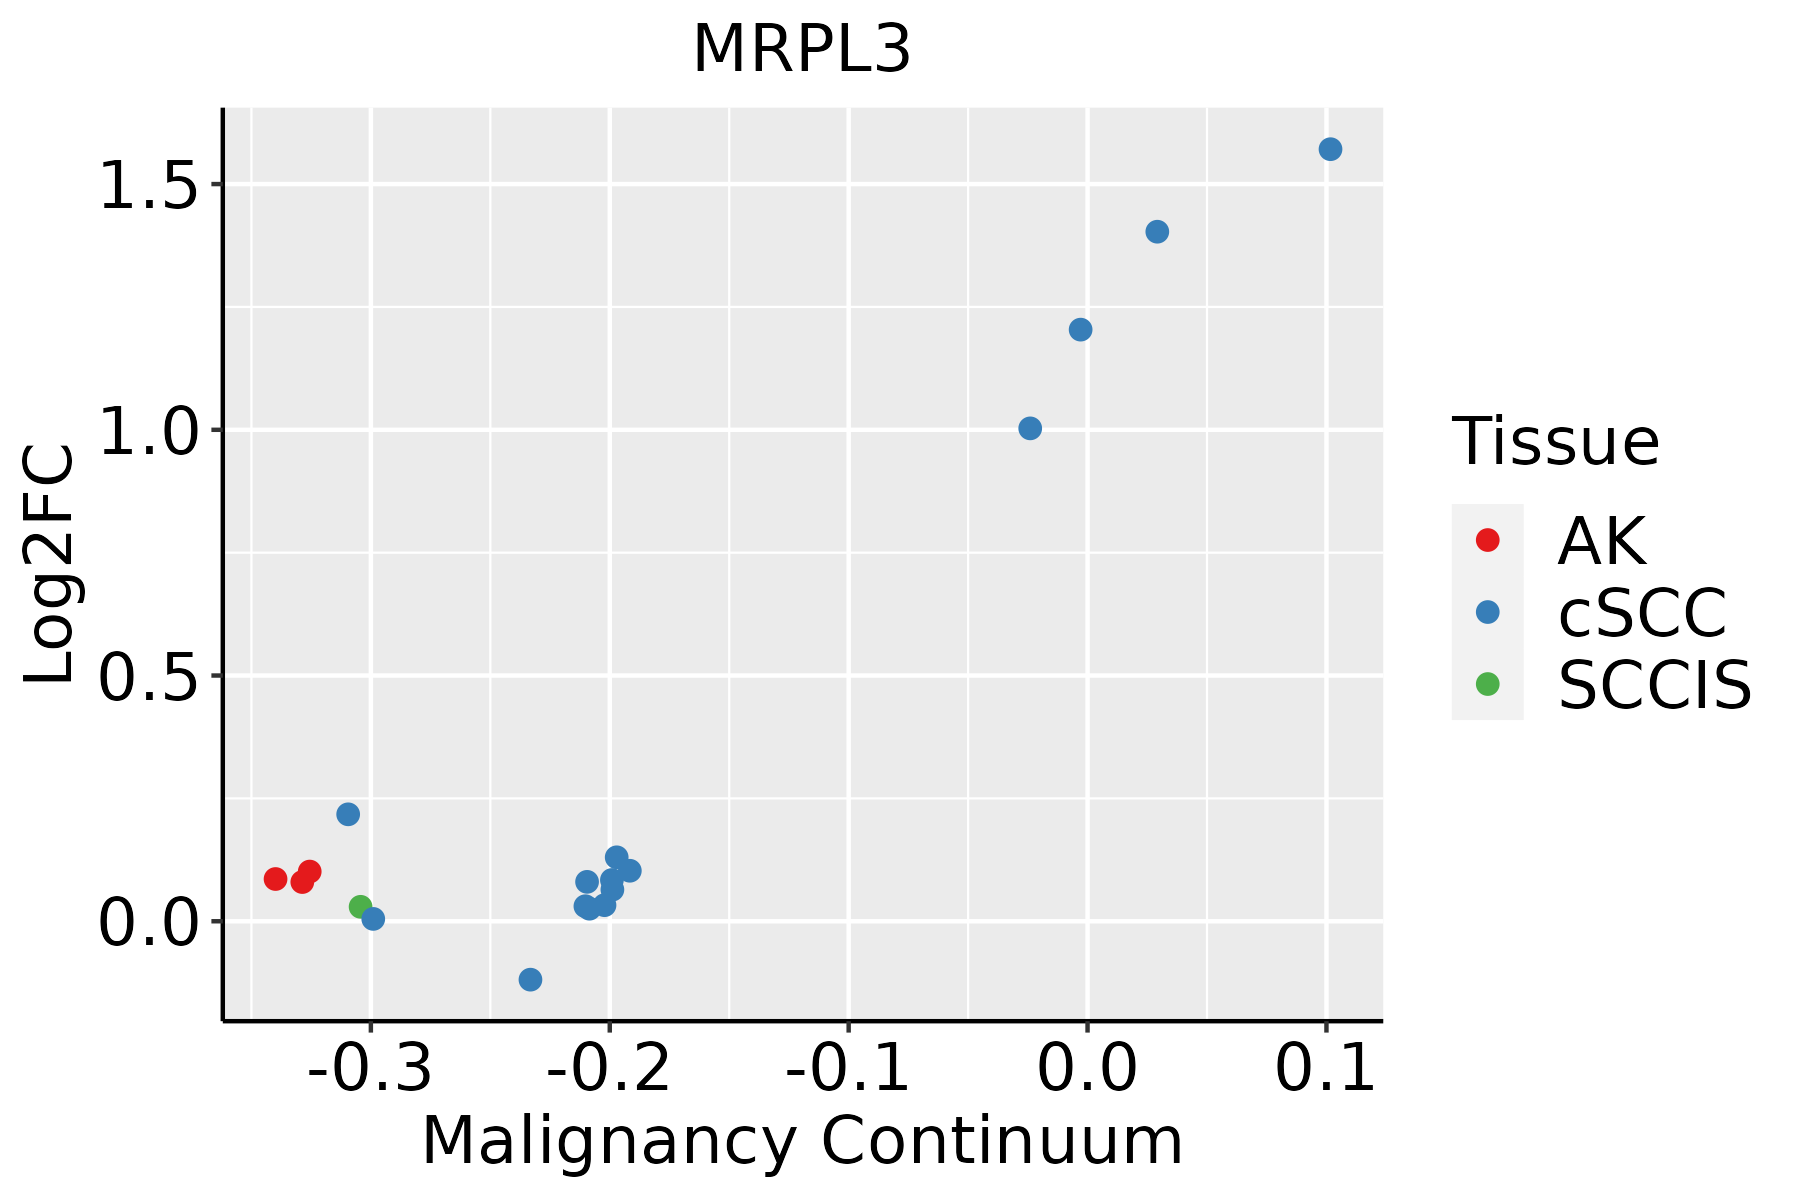 | AK: Actinic keratosis |
| cSCC: Cutaneous squamous cell carcinoma | ||
| SCCIS:squamous cell carcinoma in situ | ||
| Thyroid | 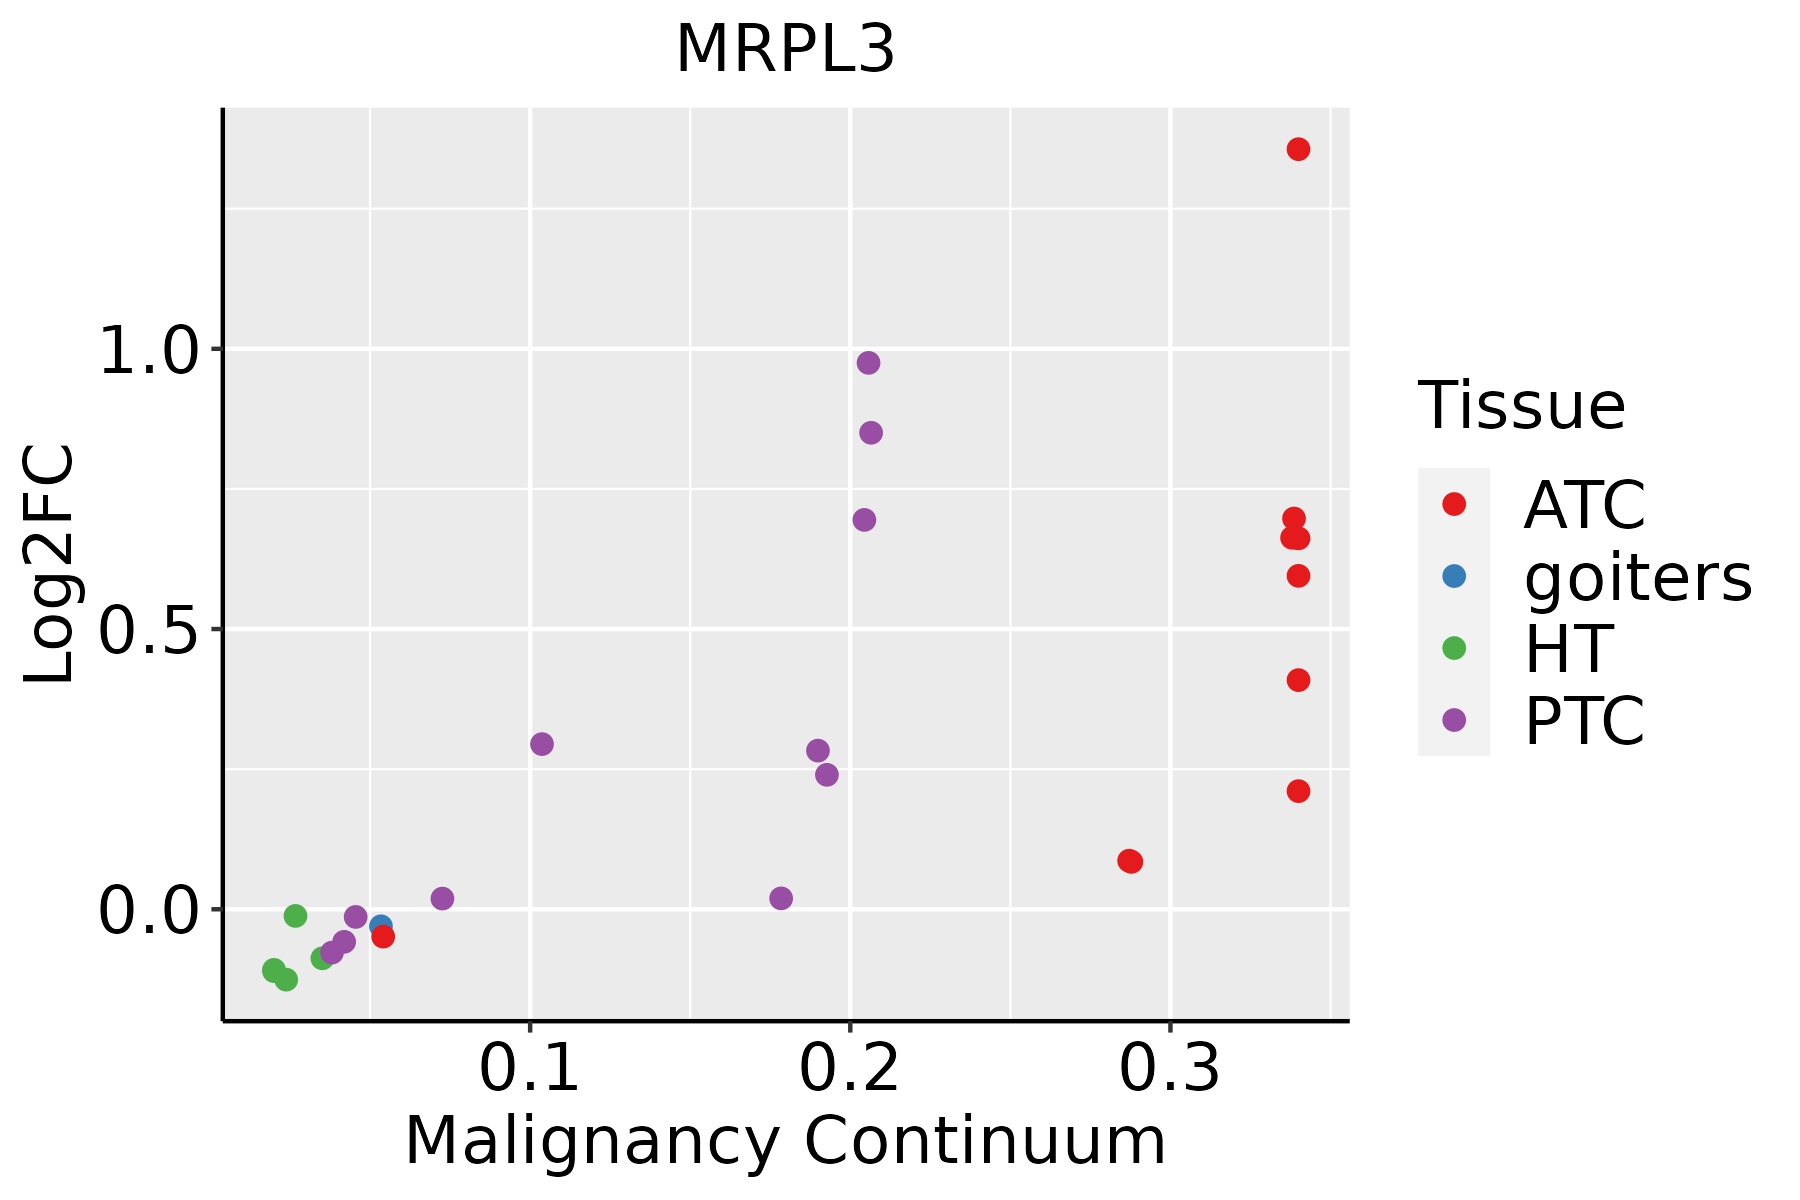 | ATC: Anaplastic thyroid cancer |
| HT: Hashimoto's thyroiditis | ||
| PTC: Papillary thyroid cancer |
| ∗log2FC in expression of this searched gene in stem-like cells from each diseased tissue sample relative to stem-like cells in normal samples in each tissue plotted against the malignancy continuum. Samples are colored based on if they are from different disease stage. |
Top |
Malignant transformation related pathway analysis |
| Find out the enriched GO biological processes and KEGG pathways involved in transition from healthy to precancer to cancer |
| Tissue | Disease Stage | Enriched GO biological Processes |
| Colorectum | AD |  |
| Colorectum | SER |  |
| Colorectum | MSS |  |
| Colorectum | MSI-H |  |
| Colorectum | FAP |  |
| ∗Top 15 enriched GO BP terms are showed in the bar plot of each disease state in each tissue. Each row represents a significant GO biological process which is colored according to the -log10(p.adjust). |
| Page: 1 2 3 4 5 6 7 8 9 |
| GO ID | Tissue | Disease Stage | Description | Gene Ratio | Bg Ratio | pvalue | p.adjust | Count |
| GO:00226139 | Breast | Precancer | ribonucleoprotein complex biogenesis | 79/1080 | 463/18723 | 2.11e-18 | 1.03e-15 | 79 |
| GO:00422549 | Breast | Precancer | ribosome biogenesis | 52/1080 | 299/18723 | 7.35e-13 | 1.51e-10 | 52 |
| GO:002261314 | Breast | IDC | ribonucleoprotein complex biogenesis | 83/1434 | 463/18723 | 2.01e-13 | 5.20e-11 | 83 |
| GO:004225414 | Breast | IDC | ribosome biogenesis | 52/1434 | 299/18723 | 1.90e-08 | 1.32e-06 | 52 |
| GO:002261324 | Breast | DCIS | ribonucleoprotein complex biogenesis | 83/1390 | 463/18723 | 3.65e-14 | 1.09e-11 | 83 |
| GO:004225423 | Breast | DCIS | ribosome biogenesis | 52/1390 | 299/18723 | 6.73e-09 | 5.44e-07 | 52 |
| GO:002261327 | Esophagus | HGIN | ribonucleoprotein complex biogenesis | 158/2587 | 463/18723 | 2.61e-29 | 5.23e-26 | 158 |
| GO:004225426 | Esophagus | HGIN | ribosome biogenesis | 101/2587 | 299/18723 | 8.74e-19 | 4.03e-16 | 101 |
| GO:0022613111 | Esophagus | ESCC | ribonucleoprotein complex biogenesis | 365/8552 | 463/18723 | 1.74e-49 | 1.11e-45 | 365 |
| GO:0042254111 | Esophagus | ESCC | ribosome biogenesis | 252/8552 | 299/18723 | 3.27e-44 | 1.04e-40 | 252 |
| GO:002261312 | Liver | Cirrhotic | ribonucleoprotein complex biogenesis | 231/4634 | 463/18723 | 3.28e-32 | 6.86e-29 | 231 |
| GO:004225412 | Liver | Cirrhotic | ribosome biogenesis | 154/4634 | 299/18723 | 1.18e-23 | 6.72e-21 | 154 |
| GO:002261322 | Liver | HCC | ribonucleoprotein complex biogenesis | 355/7958 | 463/18723 | 7.76e-52 | 4.92e-48 | 355 |
| GO:004225422 | Liver | HCC | ribosome biogenesis | 246/7958 | 299/18723 | 4.99e-46 | 1.58e-42 | 246 |
| GO:002261320 | Oral cavity | OSCC | ribonucleoprotein complex biogenesis | 333/7305 | 463/18723 | 8.28e-48 | 5.24e-44 | 333 |
| GO:004225420 | Oral cavity | OSCC | ribosome biogenesis | 230/7305 | 299/18723 | 3.22e-41 | 6.80e-38 | 230 |
| GO:0022613110 | Oral cavity | LP | ribonucleoprotein complex biogenesis | 259/4623 | 463/18723 | 7.20e-48 | 2.25e-44 | 259 |
| GO:0042254110 | Oral cavity | LP | ribosome biogenesis | 173/4623 | 299/18723 | 8.97e-35 | 1.41e-31 | 173 |
| GO:002261318 | Prostate | BPH | ribonucleoprotein complex biogenesis | 150/3107 | 463/18723 | 2.18e-17 | 5.62e-15 | 150 |
| GO:004225418 | Prostate | BPH | ribosome biogenesis | 90/3107 | 299/18723 | 3.82e-09 | 1.44e-07 | 90 |
| Page: 1 2 |
| Pathway ID | Tissue | Disease Stage | Description | Gene Ratio | Bg Ratio | pvalue | p.adjust | qvalue | Count |
| hsa030104 | Colorectum | MSS | Ribosome | 96/1875 | 167/8465 | 1.82e-23 | 2.03e-21 | 1.24e-21 | 96 |
| hsa030105 | Colorectum | MSS | Ribosome | 96/1875 | 167/8465 | 1.82e-23 | 2.03e-21 | 1.24e-21 | 96 |
| hsa030108 | Colorectum | FAP | Ribosome | 59/1404 | 167/8465 | 2.38e-09 | 1.32e-07 | 8.05e-08 | 59 |
| hsa030109 | Colorectum | FAP | Ribosome | 59/1404 | 167/8465 | 2.38e-09 | 1.32e-07 | 8.05e-08 | 59 |
| hsa0301010 | Colorectum | CRC | Ribosome | 60/1091 | 167/8465 | 1.43e-14 | 2.78e-12 | 1.88e-12 | 60 |
| hsa0301011 | Colorectum | CRC | Ribosome | 60/1091 | 167/8465 | 1.43e-14 | 2.78e-12 | 1.88e-12 | 60 |
| hsa03010211 | Esophagus | ESCC | Ribosome | 129/4205 | 167/8465 | 1.43e-13 | 3.43e-12 | 1.75e-12 | 129 |
| hsa03010310 | Esophagus | ESCC | Ribosome | 129/4205 | 167/8465 | 1.43e-13 | 3.43e-12 | 1.75e-12 | 129 |
| hsa0301022 | Liver | Cirrhotic | Ribosome | 127/2530 | 167/8465 | 2.12e-35 | 7.06e-33 | 4.35e-33 | 127 |
| hsa0301032 | Liver | Cirrhotic | Ribosome | 127/2530 | 167/8465 | 2.12e-35 | 7.06e-33 | 4.35e-33 | 127 |
| hsa0301042 | Liver | HCC | Ribosome | 128/4020 | 167/8465 | 7.32e-15 | 2.23e-13 | 1.24e-13 | 128 |
| hsa0301052 | Liver | HCC | Ribosome | 128/4020 | 167/8465 | 7.32e-15 | 2.23e-13 | 1.24e-13 | 128 |
| hsa0301030 | Oral cavity | OSCC | Ribosome | 128/3704 | 167/8465 | 2.42e-18 | 1.62e-16 | 8.25e-17 | 128 |
| hsa03010114 | Oral cavity | OSCC | Ribosome | 128/3704 | 167/8465 | 2.42e-18 | 1.62e-16 | 8.25e-17 | 128 |
| hsa03010210 | Oral cavity | LP | Ribosome | 127/2418 | 167/8465 | 1.22e-37 | 4.05e-35 | 2.61e-35 | 127 |
| hsa0301038 | Oral cavity | LP | Ribosome | 127/2418 | 167/8465 | 1.22e-37 | 4.05e-35 | 2.61e-35 | 127 |
| Page: 1 |
Top |
Cell-cell communication analysis |
| Identification of potential cell-cell interactions between two cell types and their ligand-receptor pairs for different disease states |
| Ligand | Receptor | LRpair | Pathway | Tissue | Disease Stage |
| Page: 1 |
Top |
Single-cell gene regulatory network inference analysis |
| Find out the significant the regulons (TFs) and the target genes of each regulon across cell types for different disease states |
| TF | Cell Type | Tissue | Disease Stage | Target Gene | RSS | Regulon Activity |
| ∗The dot plots of a searched regulon are shown for all cell subpopulations in each disease state of each tissue based on the regulon specific score inferred using pySCENIC and by calculating the average expression. |
| Page: 1 |
Top |
Somatic mutation of malignant transformation related genes |
| Annotation of somatic variants for genes involved in malignant transformation |
| Hugo Symbol | Variant Class | Variant Classification | dbSNP RS | HGVSc | HGVSp | HGVSp Short | SWISSPROT | BIOTYPE | SIFT | PolyPhen | Tumor Sample Barcode | Tissue | Histology | Sex | Age | Stage | Therapy Types | Drugs | Outcome |
| MRPL3 | SNV | Missense_Mutation | novel | c.308N>T | p.Lys103Met | p.K103M | P09001 | protein_coding | deleterious(0) | probably_damaging(1) | TCGA-OL-A5D7-01 | Breast | breast invasive carcinoma | Female | >=65 | I/II | Chemotherapy | cytoxan | CR |
| MRPL3 | SNV | Missense_Mutation | novel | c.411N>G | p.Asn137Lys | p.N137K | P09001 | protein_coding | tolerated(0.22) | benign(0.012) | TCGA-OL-A97C-01 | Breast | breast invasive carcinoma | Female | >=65 | I/II | Unknown | Unknown | PD |
| MRPL3 | insertion | In_Frame_Ins | novel | c.381_382insGTCTTGATATCTACCCACTGGGAGCTC | p.Cys127_His128insValLeuIleSerThrHisTrpGluLeu | p.C127_H128insVLISTHWEL | P09001 | protein_coding | TCGA-BH-A0HF-01 | Breast | breast invasive carcinoma | Female | >=65 | I/II | Hormone Therapy | arimidex | SD | ||
| MRPL3 | SNV | Missense_Mutation | c.166N>C | p.Glu56Gln | p.E56Q | P09001 | protein_coding | deleterious(0.02) | probably_damaging(0.986) | TCGA-C5-A0TN-01 | Cervix | cervical & endocervical cancer | Female | <65 | I/II | Chemotherapy | cisplatin | PD | |
| MRPL3 | SNV | Missense_Mutation | rs377532148 | c.466N>T | p.Arg156Cys | p.R156C | P09001 | protein_coding | tolerated(0.13) | benign(0) | TCGA-AA-3510-01 | Colorectum | colon adenocarcinoma | Male | >=65 | I/II | Unknown | Unknown | SD |
| MRPL3 | SNV | Missense_Mutation | c.489N>T | p.Glu163Asp | p.E163D | P09001 | protein_coding | tolerated(0.4) | benign(0.038) | TCGA-CA-6718-01 | Colorectum | colon adenocarcinoma | Male | <65 | I/II | Unknown | Unknown | PD | |
| MRPL3 | SNV | Missense_Mutation | c.64N>A | p.Leu22Met | p.L22M | P09001 | protein_coding | tolerated_low_confidence(0.16) | benign(0.102) | TCGA-CM-5861-01 | Colorectum | colon adenocarcinoma | Female | <65 | I/II | Unknown | Unknown | PD | |
| MRPL3 | deletion | Frame_Shift_Del | c.628delN | p.Thr210LeufsTer10 | p.T210Lfs*10 | P09001 | protein_coding | TCGA-AD-5900-01 | Colorectum | colon adenocarcinoma | Male | >=65 | I/II | Unknown | Unknown | SD | |||
| MRPL3 | SNV | Missense_Mutation | novel | c.100A>G | p.Ile34Val | p.I34V | P09001 | protein_coding | tolerated(0.4) | benign(0) | TCGA-AJ-A3EK-01 | Endometrium | uterine corpus endometrioid carcinoma | Female | <65 | I/II | Chemotherapy | carboplatin | CR |
| MRPL3 | SNV | Missense_Mutation | novel | c.522N>T | p.Gln174His | p.Q174H | P09001 | protein_coding | deleterious(0.01) | benign(0.141) | TCGA-AJ-A5DW-01 | Endometrium | uterine corpus endometrioid carcinoma | Female | <65 | I/II | Unknown | Unknown | SD |
| Page: 1 2 3 |
Top |
Related drugs of malignant transformation related genes |
| Identification of chemicals and drugs interact with genes involved in malignant transfromation |
| (DGIdb 4.0) |
| Entrez ID | Symbol | Category | Interaction Types | Drug Claim Name | Drug Name | PMIDs |
| Page: 1 |

Copyright 2023-Present -The University of Texas Health Science Center at Houston |