
|
|||||
|
 | |
| |
| |
| |
| |
| |
|
Gene: MRPL24 |
Gene summary for MRPL24 |
| Gene information | Species | Human | Gene symbol | MRPL24 | Gene ID | 79590 |
| Gene name | mitochondrial ribosomal protein L24 | |
| Gene Alias | L24mt | |
| Cytomap | 1q23.1 | |
| Gene Type | protein-coding | GO ID | GO:0006412 | UniProtAcc | Q96A35 |
Top |
Malignant transformation analysis |
| Identification of the aberrant gene expression in precancerous and cancerous lesions by comparing the gene expression of stem-like cells in diseased tissues with normal stem cells |
| Entrez ID | Symbol | Replicates | Species | Organ | Tissue | Adj P-value | Log2FC | Malignancy |
| 79590 | MRPL24 | GSM4909281 | Human | Breast | IDC | 3.65e-06 | 3.04e-01 | 0.21 |
| 79590 | MRPL24 | GSM4909286 | Human | Breast | IDC | 3.69e-05 | 1.79e-01 | 0.1081 |
| 79590 | MRPL24 | GSM4909293 | Human | Breast | IDC | 2.09e-10 | 3.40e-01 | 0.1581 |
| 79590 | MRPL24 | GSM4909298 | Human | Breast | IDC | 1.71e-03 | 1.87e-01 | 0.1551 |
| 79590 | MRPL24 | GSM4909302 | Human | Breast | IDC | 8.59e-04 | 3.66e-01 | 0.1545 |
| 79590 | MRPL24 | GSM4909304 | Human | Breast | IDC | 7.43e-05 | 3.09e-01 | 0.1636 |
| 79590 | MRPL24 | GSM4909306 | Human | Breast | IDC | 1.89e-18 | 4.84e-01 | 0.1564 |
| 79590 | MRPL24 | GSM4909307 | Human | Breast | IDC | 3.79e-16 | 5.53e-01 | 0.1569 |
| 79590 | MRPL24 | GSM4909308 | Human | Breast | IDC | 7.92e-22 | 6.13e-01 | 0.158 |
| 79590 | MRPL24 | GSM4909311 | Human | Breast | IDC | 7.70e-09 | 6.98e-02 | 0.1534 |
| 79590 | MRPL24 | GSM4909312 | Human | Breast | IDC | 2.99e-03 | 2.22e-01 | 0.1552 |
| 79590 | MRPL24 | GSM4909319 | Human | Breast | IDC | 8.08e-16 | 2.27e-01 | 0.1563 |
| 79590 | MRPL24 | GSM4909321 | Human | Breast | IDC | 2.76e-04 | 2.35e-01 | 0.1559 |
| 79590 | MRPL24 | brca1 | Human | Breast | Precancer | 1.36e-04 | 2.15e-01 | -0.0338 |
| 79590 | MRPL24 | brca2 | Human | Breast | Precancer | 3.07e-03 | 2.02e-01 | -0.024 |
| 79590 | MRPL24 | DCIS2 | Human | Breast | DCIS | 1.82e-45 | 9.46e-02 | 0.0085 |
| 79590 | MRPL24 | LZE2T | Human | Esophagus | ESCC | 2.22e-09 | 1.56e+00 | 0.082 |
| 79590 | MRPL24 | LZE3D | Human | Esophagus | HGIN | 3.81e-03 | 6.05e-01 | 0.0668 |
| 79590 | MRPL24 | LZE4T | Human | Esophagus | ESCC | 2.05e-13 | 4.77e-01 | 0.0811 |
| 79590 | MRPL24 | LZE5T | Human | Esophagus | ESCC | 1.35e-02 | 3.30e-01 | 0.0514 |
| Page: 1 2 3 4 5 6 7 |
| Tissue | Expression Dynamics | Abbreviation |
| Breast | 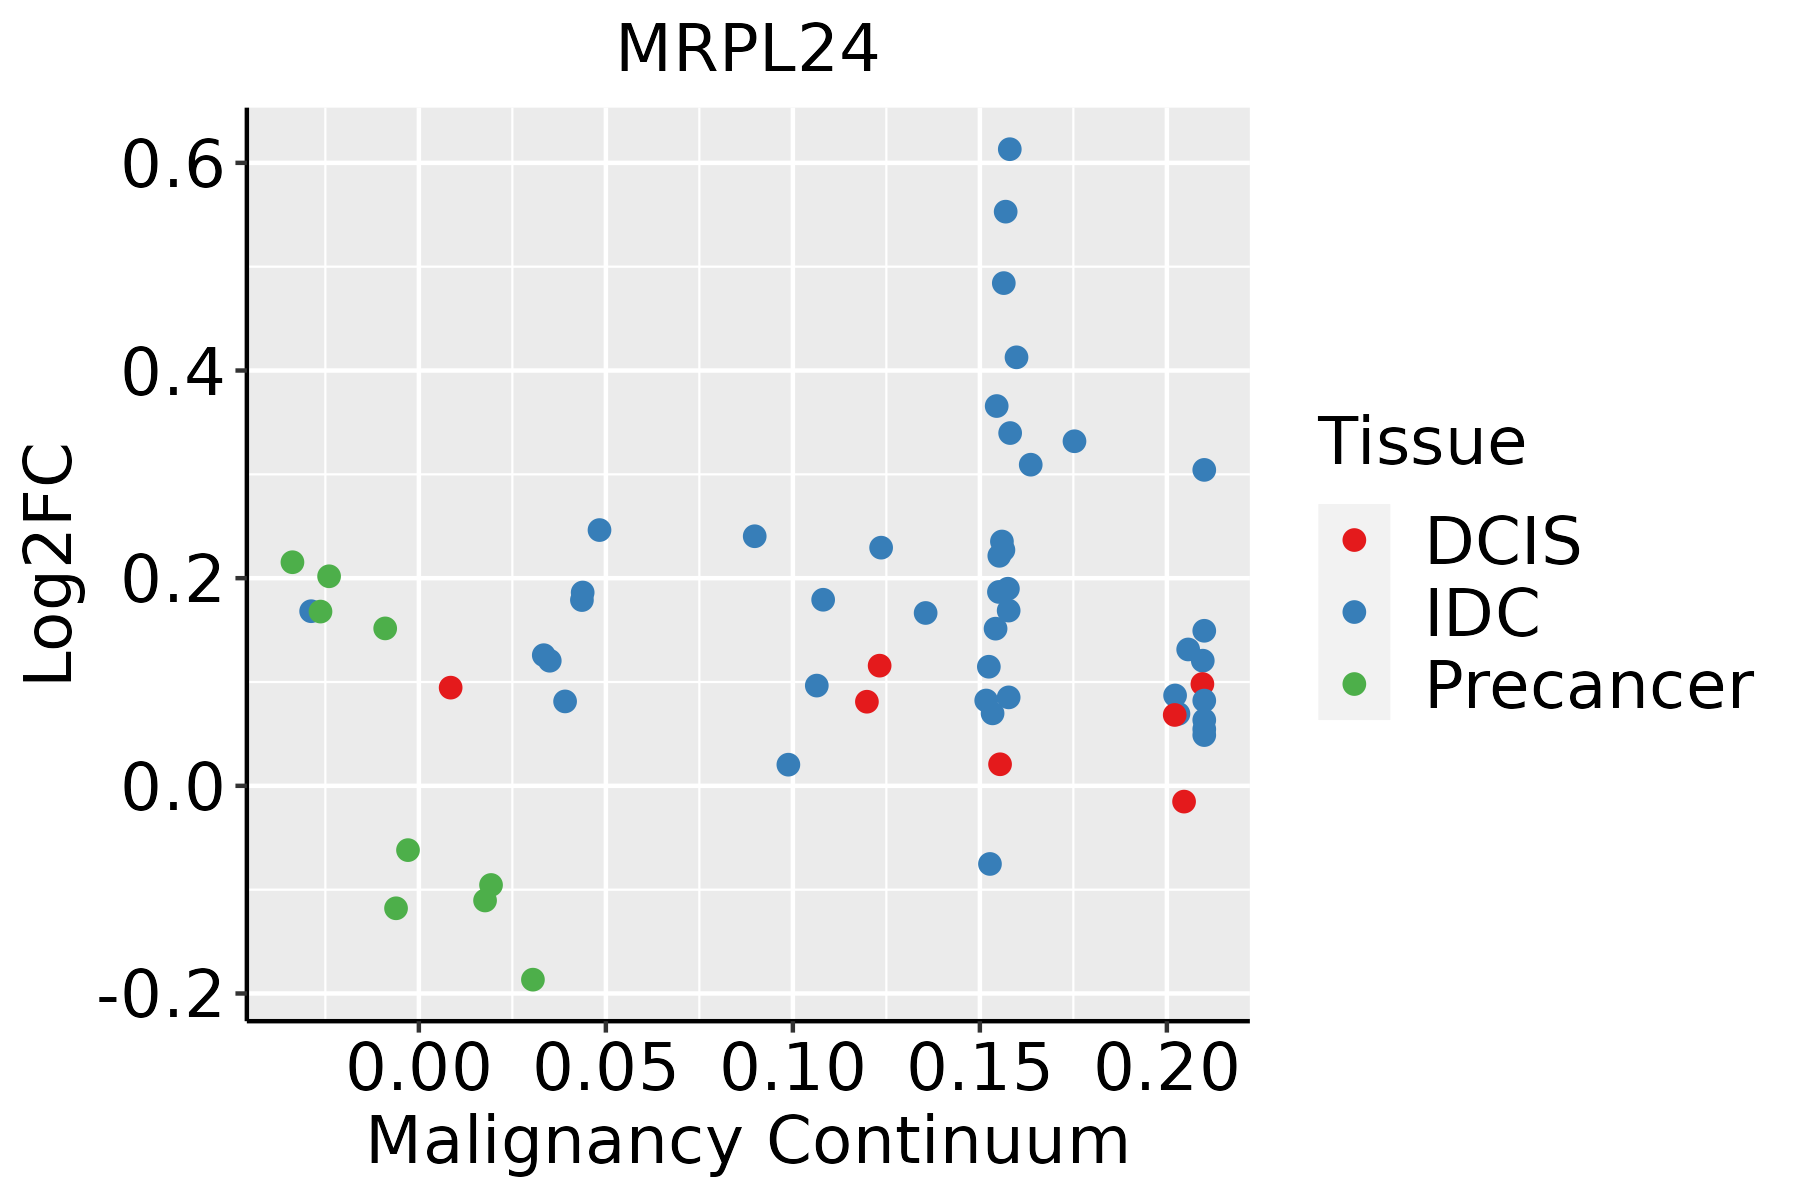 | IDC: Invasive ductal carcinoma |
| DCIS: Ductal carcinoma in situ | ||
| Precancer(BRCA1-mut): Precancerous lesion from BRCA1 mutation carriers | ||
| Esophagus | 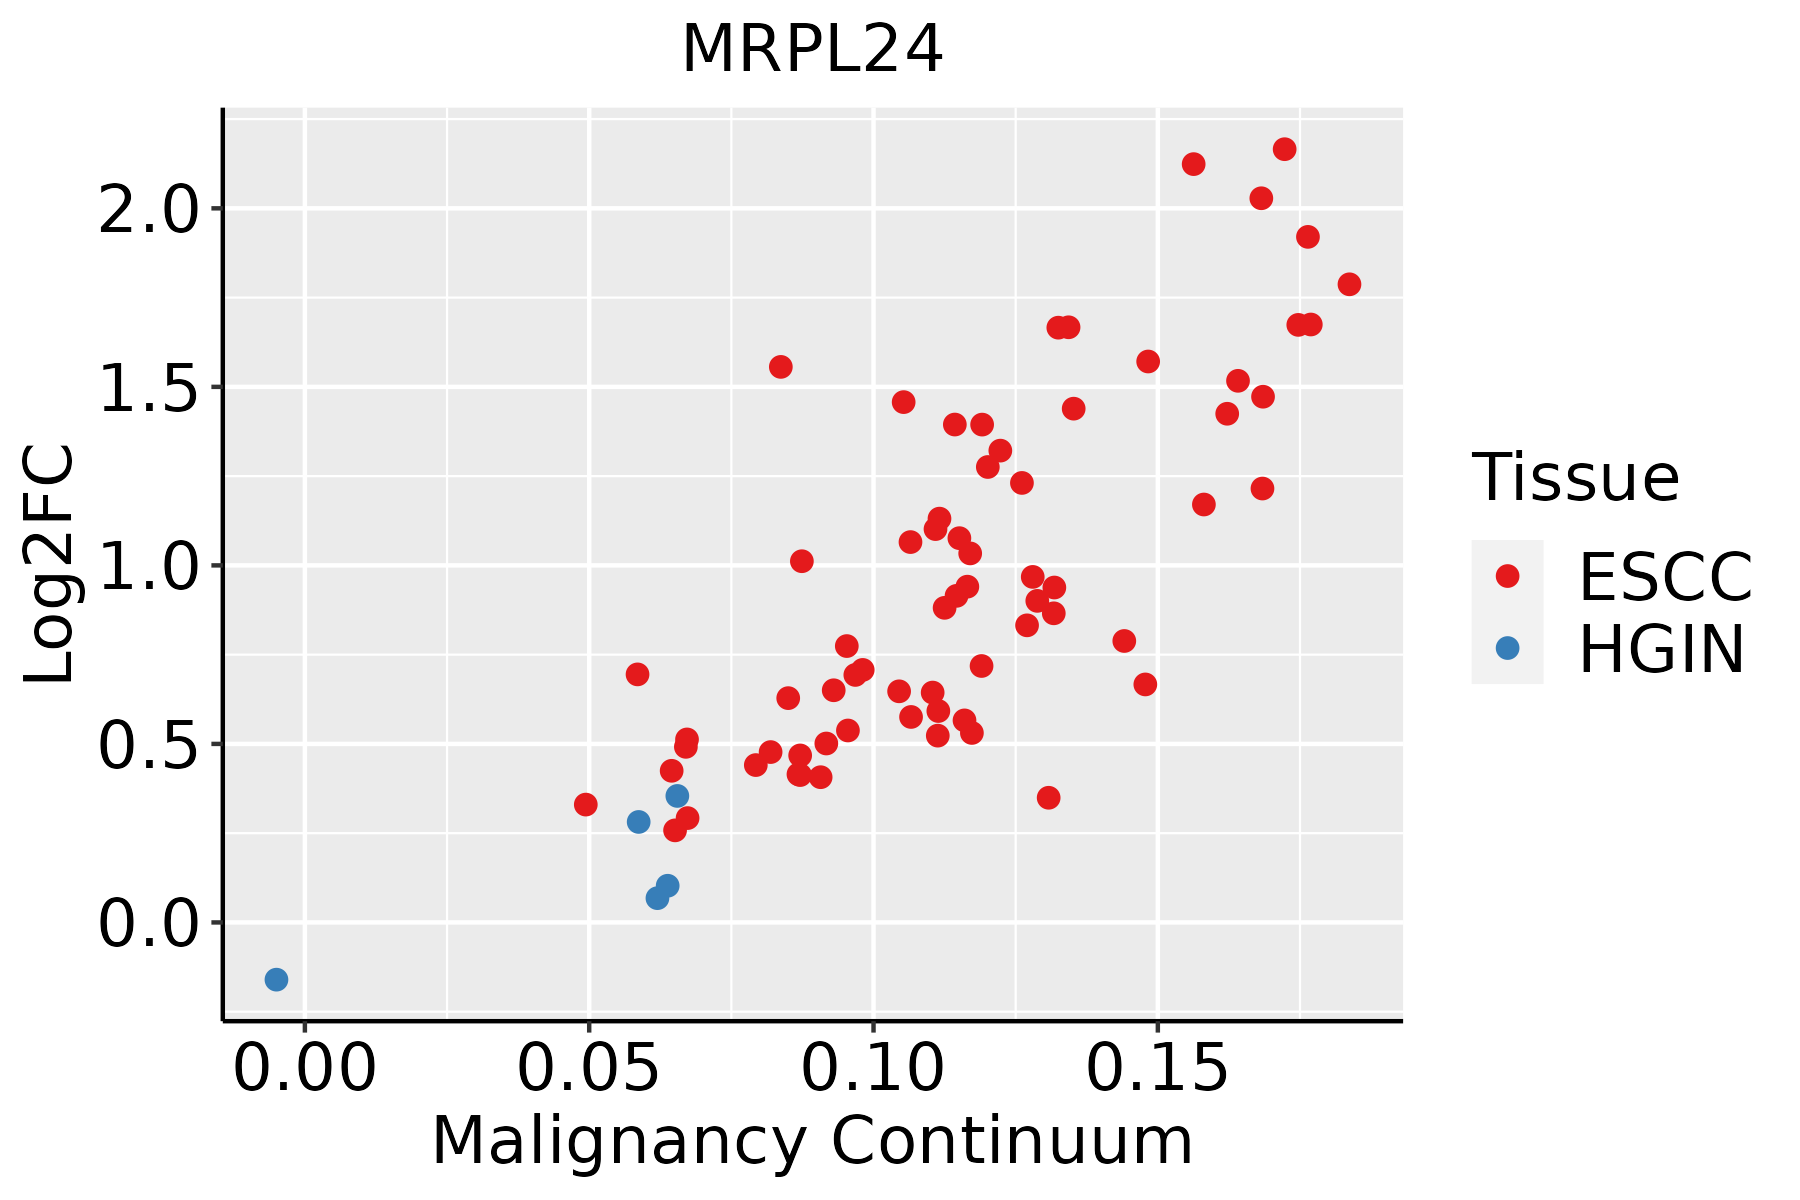 | ESCC: Esophageal squamous cell carcinoma |
| HGIN: High-grade intraepithelial neoplasias | ||
| LGIN: Low-grade intraepithelial neoplasias | ||
| Liver | 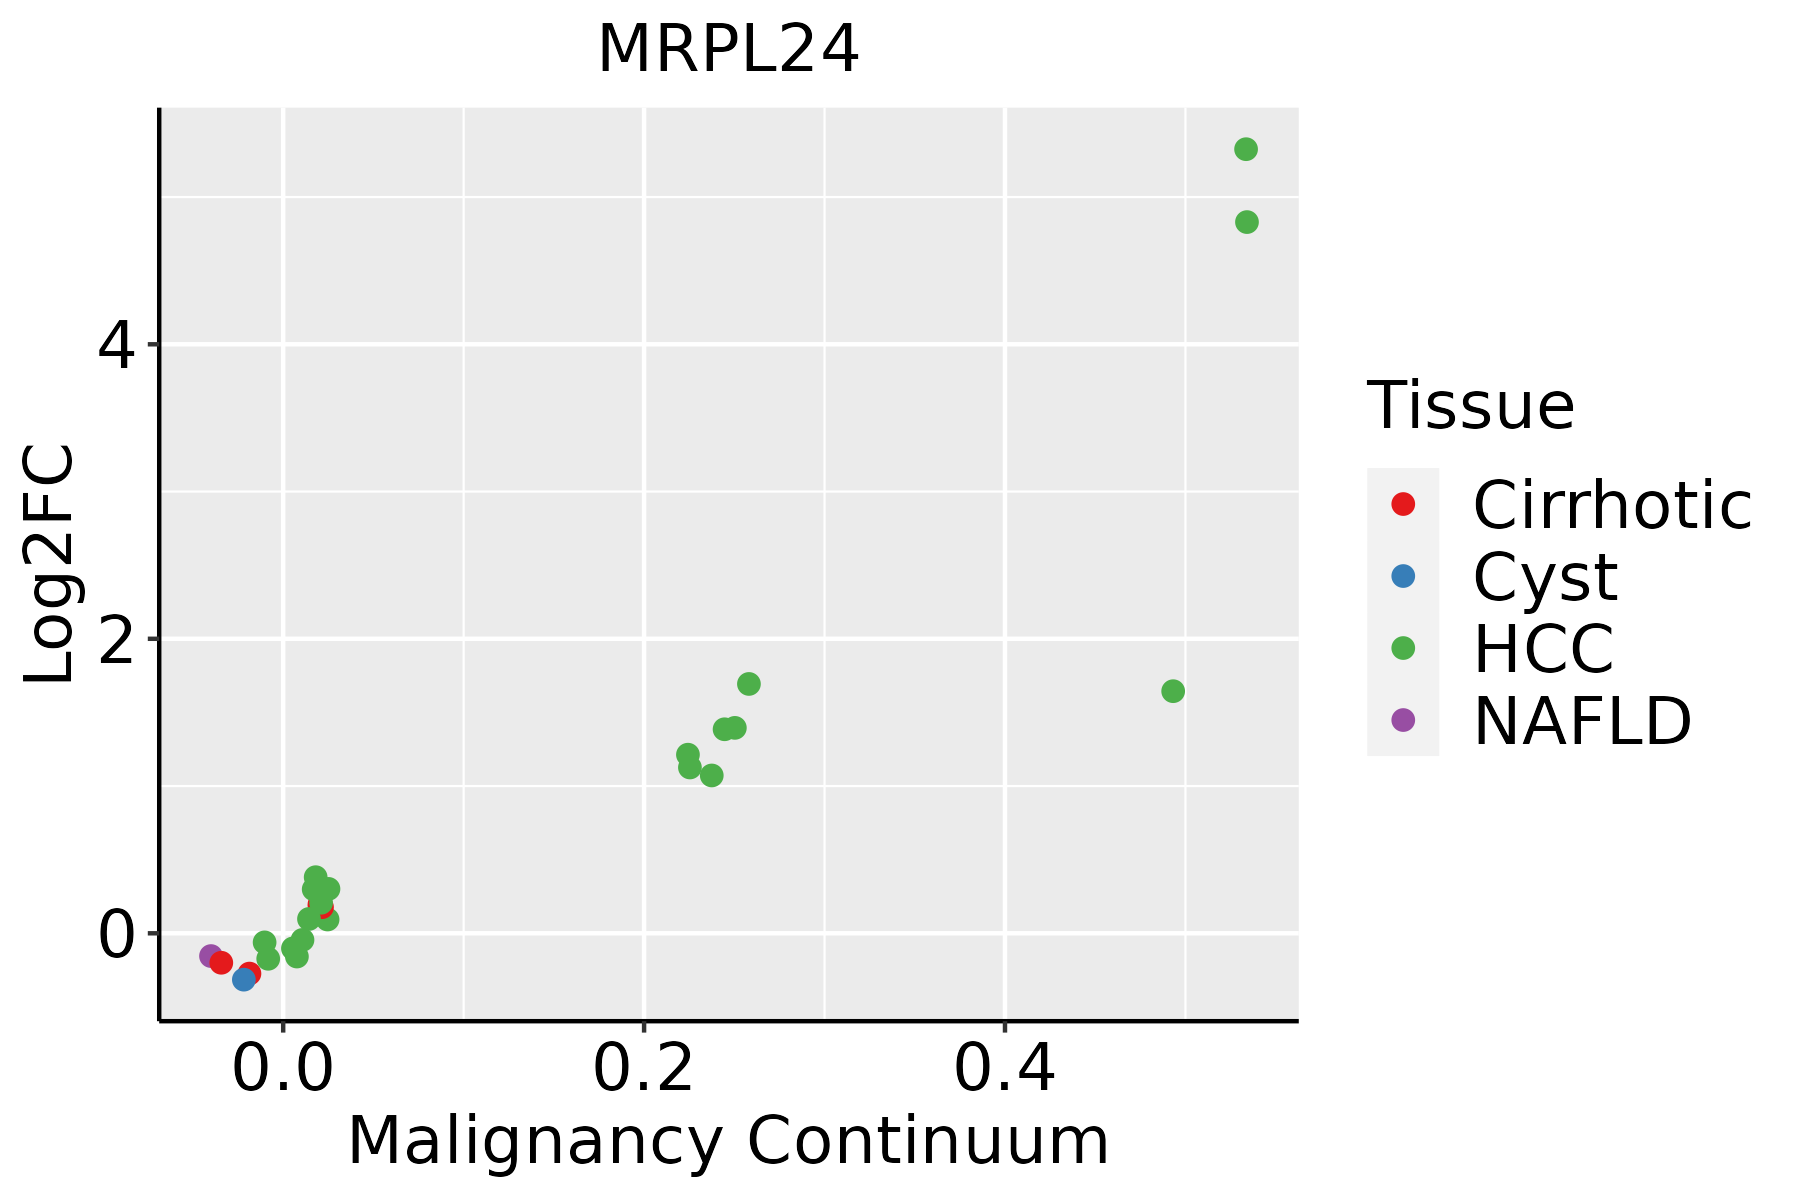 | HCC: Hepatocellular carcinoma |
| NAFLD: Non-alcoholic fatty liver disease | ||
| Oral Cavity | 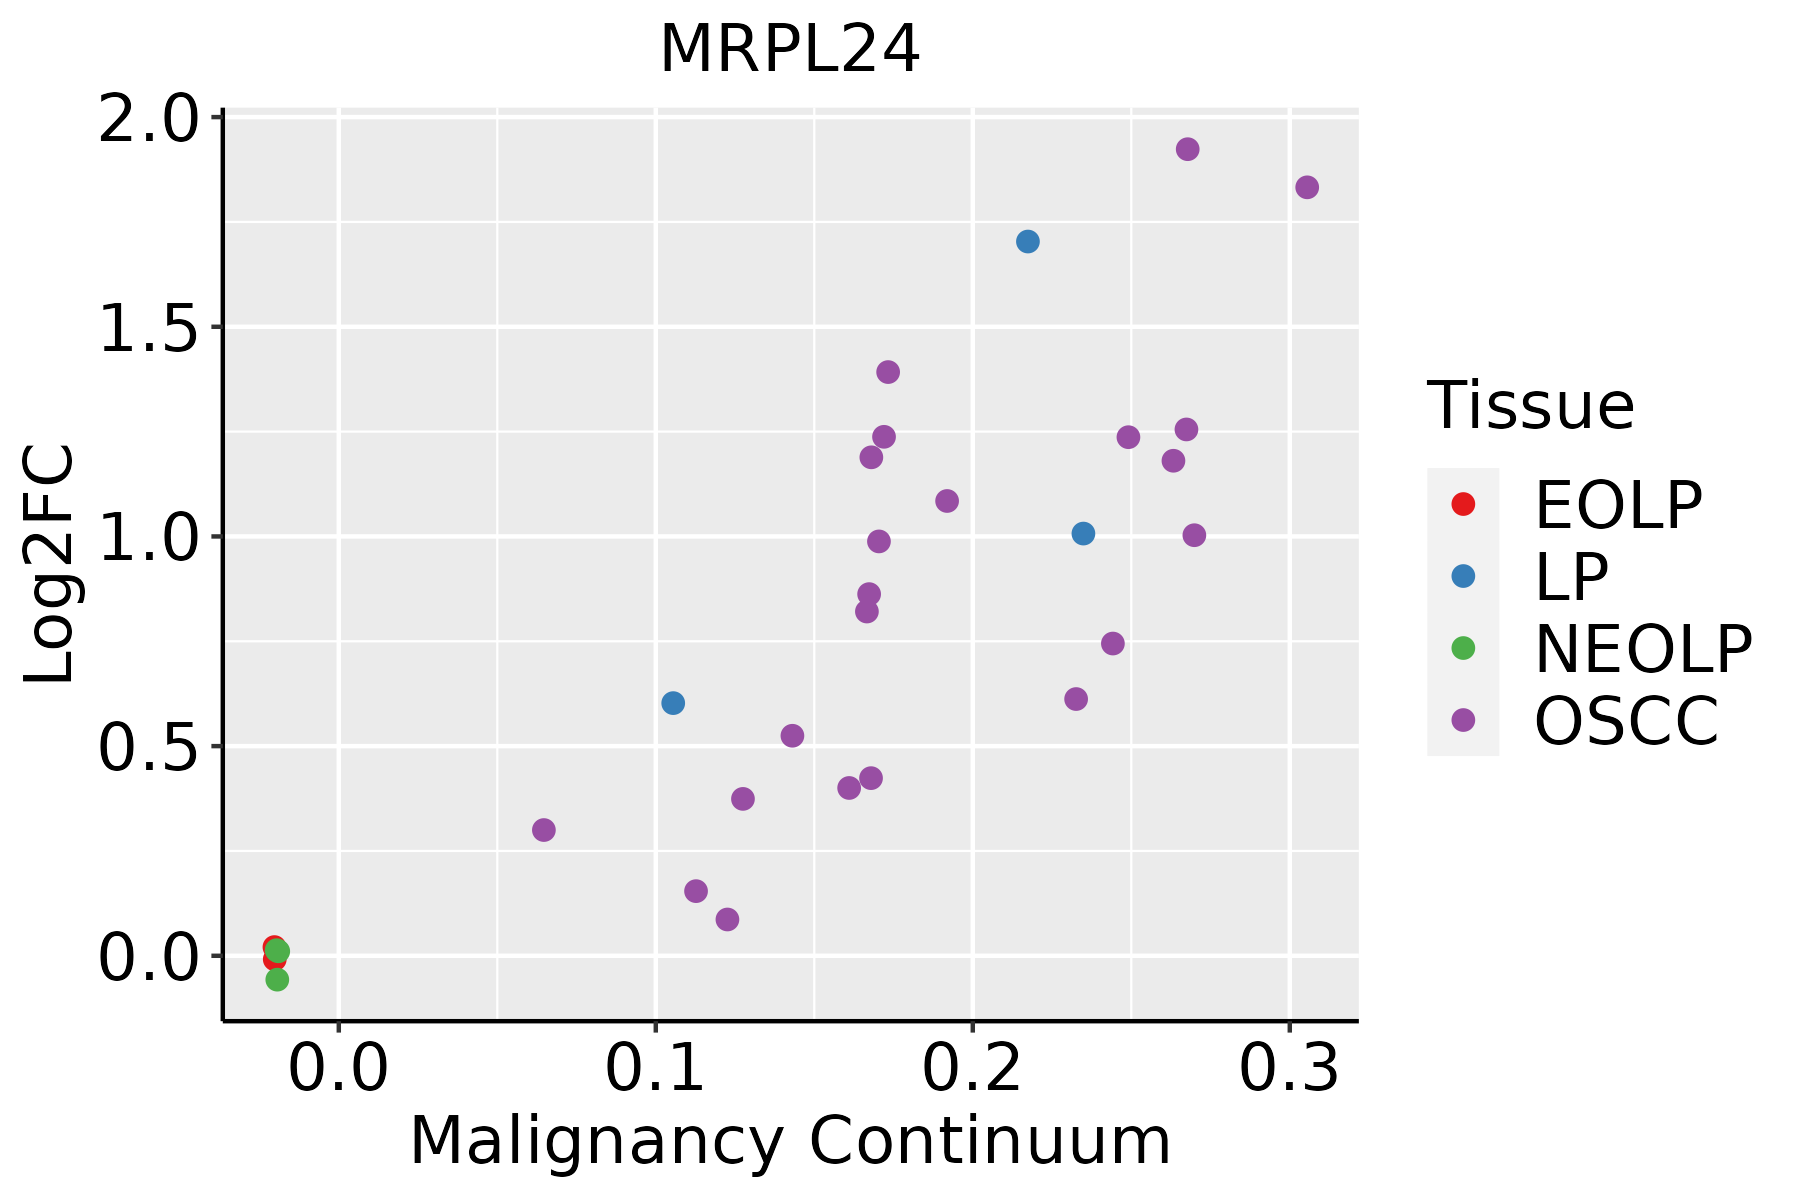 | EOLP: Erosive Oral lichen planus |
| LP: leukoplakia | ||
| NEOLP: Non-erosive oral lichen planus | ||
| OSCC: Oral squamous cell carcinoma | ||
| Prostate | 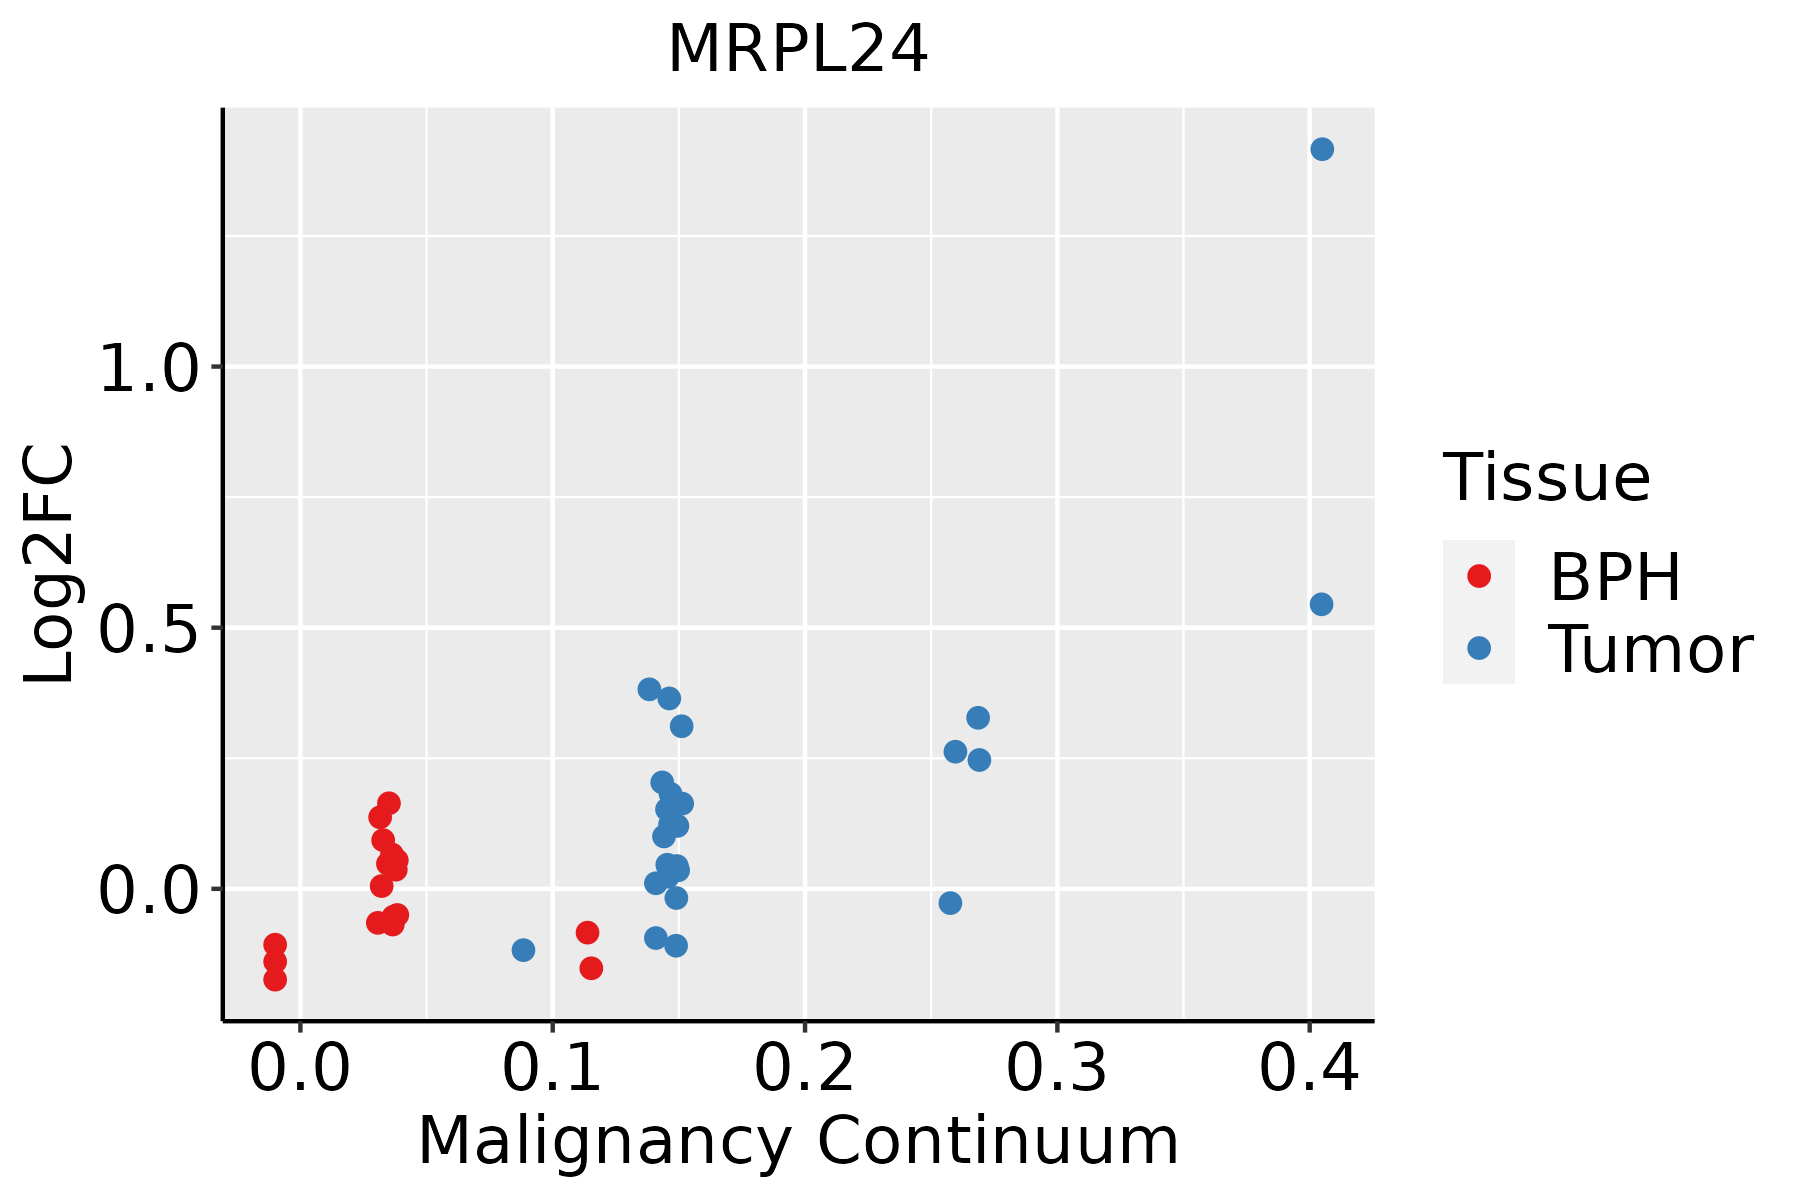 | BPH: Benign Prostatic Hyperplasia |
| Skin | 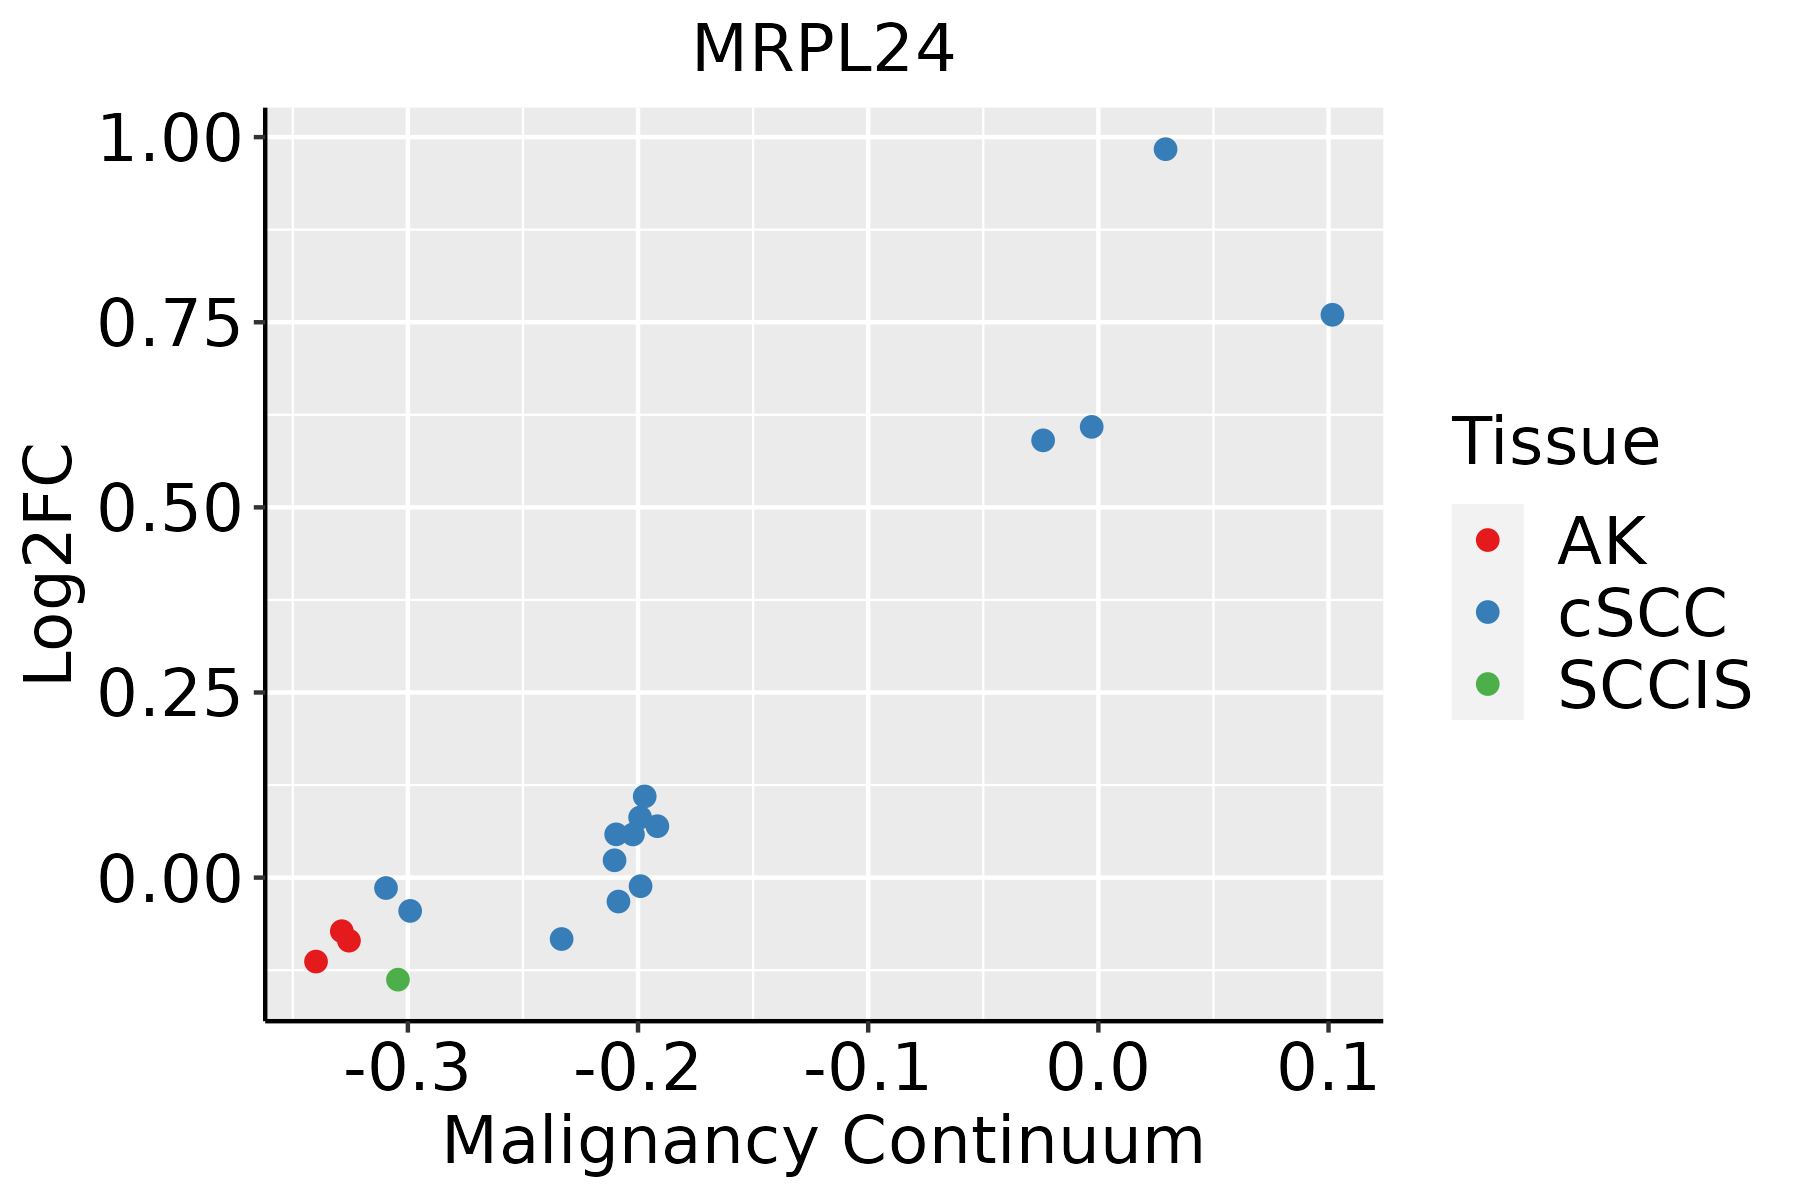 | AK: Actinic keratosis |
| cSCC: Cutaneous squamous cell carcinoma | ||
| SCCIS:squamous cell carcinoma in situ |
| ∗log2FC in expression of this searched gene in stem-like cells from each diseased tissue sample relative to stem-like cells in normal samples in each tissue plotted against the malignancy continuum. Samples are colored based on if they are from different disease stage. |
Top |
Malignant transformation related pathway analysis |
| Find out the enriched GO biological processes and KEGG pathways involved in transition from healthy to precancer to cancer |
| Tissue | Disease Stage | Enriched GO biological Processes |
| Colorectum | AD |  |
| Colorectum | SER |  |
| Colorectum | MSS |  |
| Colorectum | MSI-H |  |
| Colorectum | FAP |  |
| ∗Top 15 enriched GO BP terms are showed in the bar plot of each disease state in each tissue. Each row represents a significant GO biological process which is colored according to the -log10(p.adjust). |
| Page: 1 2 3 4 5 6 7 8 9 |
| GO ID | Tissue | Disease Stage | Description | Gene Ratio | Bg Ratio | pvalue | p.adjust | Count |
| Page: 1 |
| Pathway ID | Tissue | Disease Stage | Description | Gene Ratio | Bg Ratio | pvalue | p.adjust | qvalue | Count |
| hsa0301018 | Breast | Precancer | Ribosome | 80/684 | 167/8465 | 7.33e-44 | 2.32e-41 | 1.77e-41 | 80 |
| hsa0301019 | Breast | Precancer | Ribosome | 80/684 | 167/8465 | 7.33e-44 | 2.32e-41 | 1.77e-41 | 80 |
| hsa0301024 | Breast | IDC | Ribosome | 83/867 | 167/8465 | 6.07e-39 | 9.87e-37 | 7.38e-37 | 83 |
| hsa0301034 | Breast | IDC | Ribosome | 83/867 | 167/8465 | 6.07e-39 | 9.87e-37 | 7.38e-37 | 83 |
| hsa0301039 | Esophagus | HGIN | Ribosome | 108/1383 | 167/8465 | 1.44e-45 | 4.71e-43 | 3.74e-43 | 108 |
| hsa03010115 | Esophagus | HGIN | Ribosome | 108/1383 | 167/8465 | 1.44e-45 | 4.71e-43 | 3.74e-43 | 108 |
| hsa03010211 | Esophagus | ESCC | Ribosome | 129/4205 | 167/8465 | 1.43e-13 | 3.43e-12 | 1.75e-12 | 129 |
| hsa03010310 | Esophagus | ESCC | Ribosome | 129/4205 | 167/8465 | 1.43e-13 | 3.43e-12 | 1.75e-12 | 129 |
| hsa0301022 | Liver | Cirrhotic | Ribosome | 127/2530 | 167/8465 | 2.12e-35 | 7.06e-33 | 4.35e-33 | 127 |
| hsa0301032 | Liver | Cirrhotic | Ribosome | 127/2530 | 167/8465 | 2.12e-35 | 7.06e-33 | 4.35e-33 | 127 |
| hsa0301042 | Liver | HCC | Ribosome | 128/4020 | 167/8465 | 7.32e-15 | 2.23e-13 | 1.24e-13 | 128 |
| hsa0301052 | Liver | HCC | Ribosome | 128/4020 | 167/8465 | 7.32e-15 | 2.23e-13 | 1.24e-13 | 128 |
| hsa0301030 | Oral cavity | OSCC | Ribosome | 128/3704 | 167/8465 | 2.42e-18 | 1.62e-16 | 8.25e-17 | 128 |
| hsa03010114 | Oral cavity | OSCC | Ribosome | 128/3704 | 167/8465 | 2.42e-18 | 1.62e-16 | 8.25e-17 | 128 |
| hsa03010210 | Oral cavity | LP | Ribosome | 127/2418 | 167/8465 | 1.22e-37 | 4.05e-35 | 2.61e-35 | 127 |
| hsa0301038 | Oral cavity | LP | Ribosome | 127/2418 | 167/8465 | 1.22e-37 | 4.05e-35 | 2.61e-35 | 127 |
| hsa0301028 | Prostate | BPH | Ribosome | 104/1718 | 167/8465 | 8.04e-33 | 1.33e-30 | 8.21e-31 | 104 |
| hsa03010113 | Prostate | BPH | Ribosome | 104/1718 | 167/8465 | 8.04e-33 | 1.33e-30 | 8.21e-31 | 104 |
| hsa0301029 | Prostate | Tumor | Ribosome | 104/1791 | 167/8465 | 3.53e-31 | 5.84e-29 | 3.62e-29 | 104 |
| hsa0301037 | Prostate | Tumor | Ribosome | 104/1791 | 167/8465 | 3.53e-31 | 5.84e-29 | 3.62e-29 | 104 |
| Page: 1 |
Top |
Cell-cell communication analysis |
| Identification of potential cell-cell interactions between two cell types and their ligand-receptor pairs for different disease states |
| Ligand | Receptor | LRpair | Pathway | Tissue | Disease Stage |
| Page: 1 |
Top |
Single-cell gene regulatory network inference analysis |
| Find out the significant the regulons (TFs) and the target genes of each regulon across cell types for different disease states |
| TF | Cell Type | Tissue | Disease Stage | Target Gene | RSS | Regulon Activity |
| ∗The dot plots of a searched regulon are shown for all cell subpopulations in each disease state of each tissue based on the regulon specific score inferred using pySCENIC and by calculating the average expression. |
| Page: 1 |
Top |
Somatic mutation of malignant transformation related genes |
| Annotation of somatic variants for genes involved in malignant transformation |
| Hugo Symbol | Variant Class | Variant Classification | dbSNP RS | HGVSc | HGVSp | HGVSp Short | SWISSPROT | BIOTYPE | SIFT | PolyPhen | Tumor Sample Barcode | Tissue | Histology | Sex | Age | Stage | Therapy Types | Drugs | Outcome |
| MRPL24 | insertion | Frame_Shift_Ins | rs760797871 | c.52_53insC | p.His18ProfsTer34 | p.H18Pfs*34 | Q96A35 | protein_coding | TCGA-AU-6004-01 | Colorectum | colon adenocarcinoma | Female | >=65 | I/II | Unknown | Unknown | SD | ||
| MRPL24 | SNV | Missense_Mutation | novel | c.374N>A | p.Pro125His | p.P125H | Q96A35 | protein_coding | deleterious(0) | probably_damaging(0.909) | TCGA-A5-A0G1-01 | Endometrium | uterine corpus endometrioid carcinoma | Female | >=65 | I/II | Unknown | Unknown | SD |
| MRPL24 | SNV | Missense_Mutation | rs377386411 | c.122N>A | p.Arg41Gln | p.R41Q | Q96A35 | protein_coding | deleterious(0.04) | benign(0.052) | TCGA-A5-A0G2-01 | Endometrium | uterine corpus endometrioid carcinoma | Female | <65 | III/IV | Unknown | Unknown | SD |
| MRPL24 | SNV | Missense_Mutation | novel | c.545C>A | p.Ala182Asp | p.A182D | Q96A35 | protein_coding | deleterious(0.01) | possibly_damaging(0.845) | TCGA-AJ-A3EK-01 | Endometrium | uterine corpus endometrioid carcinoma | Female | <65 | I/II | Chemotherapy | carboplatin | CR |
| MRPL24 | SNV | Missense_Mutation | c.5G>A | p.Arg2His | p.R2H | Q96A35 | protein_coding | deleterious(0) | probably_damaging(0.997) | TCGA-AP-A051-01 | Endometrium | uterine corpus endometrioid carcinoma | Female | >=65 | I/II | Unknown | Unknown | SD | |
| MRPL24 | SNV | Missense_Mutation | rs766410907 | c.427N>T | p.Arg143Trp | p.R143W | Q96A35 | protein_coding | deleterious(0) | probably_damaging(0.92) | TCGA-AX-A0IZ-01 | Endometrium | uterine corpus endometrioid carcinoma | Female | <65 | I/II | Unknown | Unknown | SD |
| MRPL24 | SNV | Missense_Mutation | novel | c.617A>T | p.Glu206Val | p.E206V | Q96A35 | protein_coding | deleterious(0) | probably_damaging(0.929) | TCGA-AX-A2HC-01 | Endometrium | uterine corpus endometrioid carcinoma | Female | <65 | III/IV | Chemotherapy | paclitaxel | PD |
| MRPL24 | SNV | Missense_Mutation | c.102N>T | p.Lys34Asn | p.K34N | Q96A35 | protein_coding | tolerated(0.4) | benign(0.034) | TCGA-BS-A0UF-01 | Endometrium | uterine corpus endometrioid carcinoma | Female | >=65 | I/II | Unknown | Unknown | SD | |
| MRPL24 | SNV | Missense_Mutation | rs766410907 | c.427N>T | p.Arg143Trp | p.R143W | Q96A35 | protein_coding | deleterious(0) | probably_damaging(0.92) | TCGA-D1-A175-01 | Endometrium | uterine corpus endometrioid carcinoma | Female | <65 | I/II | Chemotherapy | paclitaxel | SD |
| MRPL24 | SNV | Missense_Mutation | rs765130559 | c.124C>T | p.Arg42Cys | p.R42C | Q96A35 | protein_coding | deleterious(0) | possibly_damaging(0.642) | TCGA-D1-A17Q-01 | Endometrium | uterine corpus endometrioid carcinoma | Female | <65 | I/II | Unknown | Unknown | SD |
| Page: 1 2 3 |
Top |
Related drugs of malignant transformation related genes |
| Identification of chemicals and drugs interact with genes involved in malignant transfromation |
| (DGIdb 4.0) |
| Entrez ID | Symbol | Category | Interaction Types | Drug Claim Name | Drug Name | PMIDs |
| Page: 1 |

Copyright 2023-Present -The University of Texas Health Science Center at Houston |