
|
|||||
|
 | |
| |
| |
| |
| |
| |
|
Gene: MRPL21 |
Gene summary for MRPL21 |
| Gene information | Species | Human | Gene symbol | MRPL21 | Gene ID | 219927 |
| Gene name | mitochondrial ribosomal protein L21 | |
| Gene Alias | L21mt | |
| Cytomap | 11q13.3 | |
| Gene Type | protein-coding | GO ID | GO:0006412 | UniProtAcc | Q7Z2W9 |
Top |
Malignant transformation analysis |
| Identification of the aberrant gene expression in precancerous and cancerous lesions by comparing the gene expression of stem-like cells in diseased tissues with normal stem cells |
| Entrez ID | Symbol | Replicates | Species | Organ | Tissue | Adj P-value | Log2FC | Malignancy |
| 219927 | MRPL21 | LZE4T | Human | Esophagus | ESCC | 7.42e-30 | 1.24e+00 | 0.0811 |
| 219927 | MRPL21 | LZE8T | Human | Esophagus | ESCC | 4.09e-37 | 2.85e+00 | 0.067 |
| 219927 | MRPL21 | LZE20T | Human | Esophagus | ESCC | 4.14e-20 | 1.19e+00 | 0.0662 |
| 219927 | MRPL21 | LZE22T | Human | Esophagus | ESCC | 5.80e-06 | 1.09e+00 | 0.068 |
| 219927 | MRPL21 | LZE24D1 | Human | Esophagus | HGIN | 1.58e-19 | 1.29e+00 | 0.054 |
| 219927 | MRPL21 | LZE24T | Human | Esophagus | ESCC | 1.07e-19 | 8.11e-01 | 0.0596 |
| 219927 | MRPL21 | P1T-E | Human | Esophagus | ESCC | 3.11e-19 | 1.56e+00 | 0.0875 |
| 219927 | MRPL21 | P2T-E | Human | Esophagus | ESCC | 1.86e-34 | 9.42e-01 | 0.1177 |
| 219927 | MRPL21 | P4T-E | Human | Esophagus | ESCC | 1.90e-55 | 1.74e+00 | 0.1323 |
| 219927 | MRPL21 | P5T-E | Human | Esophagus | ESCC | 3.08e-86 | 2.05e+00 | 0.1327 |
| 219927 | MRPL21 | P8T-E | Human | Esophagus | ESCC | 2.52e-53 | 1.14e+00 | 0.0889 |
| 219927 | MRPL21 | P9T-E | Human | Esophagus | ESCC | 1.42e-22 | 7.78e-01 | 0.1131 |
| 219927 | MRPL21 | P10T-E | Human | Esophagus | ESCC | 5.54e-18 | 4.30e-01 | 0.116 |
| 219927 | MRPL21 | P11T-E | Human | Esophagus | ESCC | 3.19e-15 | 8.56e-01 | 0.1426 |
| 219927 | MRPL21 | P12T-E | Human | Esophagus | ESCC | 1.52e-44 | 1.01e+00 | 0.1122 |
| 219927 | MRPL21 | P15T-E | Human | Esophagus | ESCC | 1.44e-60 | 1.98e+00 | 0.1149 |
| 219927 | MRPL21 | P16T-E | Human | Esophagus | ESCC | 4.98e-48 | 9.91e-01 | 0.1153 |
| 219927 | MRPL21 | P17T-E | Human | Esophagus | ESCC | 5.08e-19 | 1.05e+00 | 0.1278 |
| 219927 | MRPL21 | P19T-E | Human | Esophagus | ESCC | 7.78e-06 | 8.49e-01 | 0.1662 |
| 219927 | MRPL21 | P20T-E | Human | Esophagus | ESCC | 3.95e-55 | 1.51e+00 | 0.1124 |
| Page: 1 2 3 4 5 6 7 |
| Tissue | Expression Dynamics | Abbreviation |
| Esophagus | 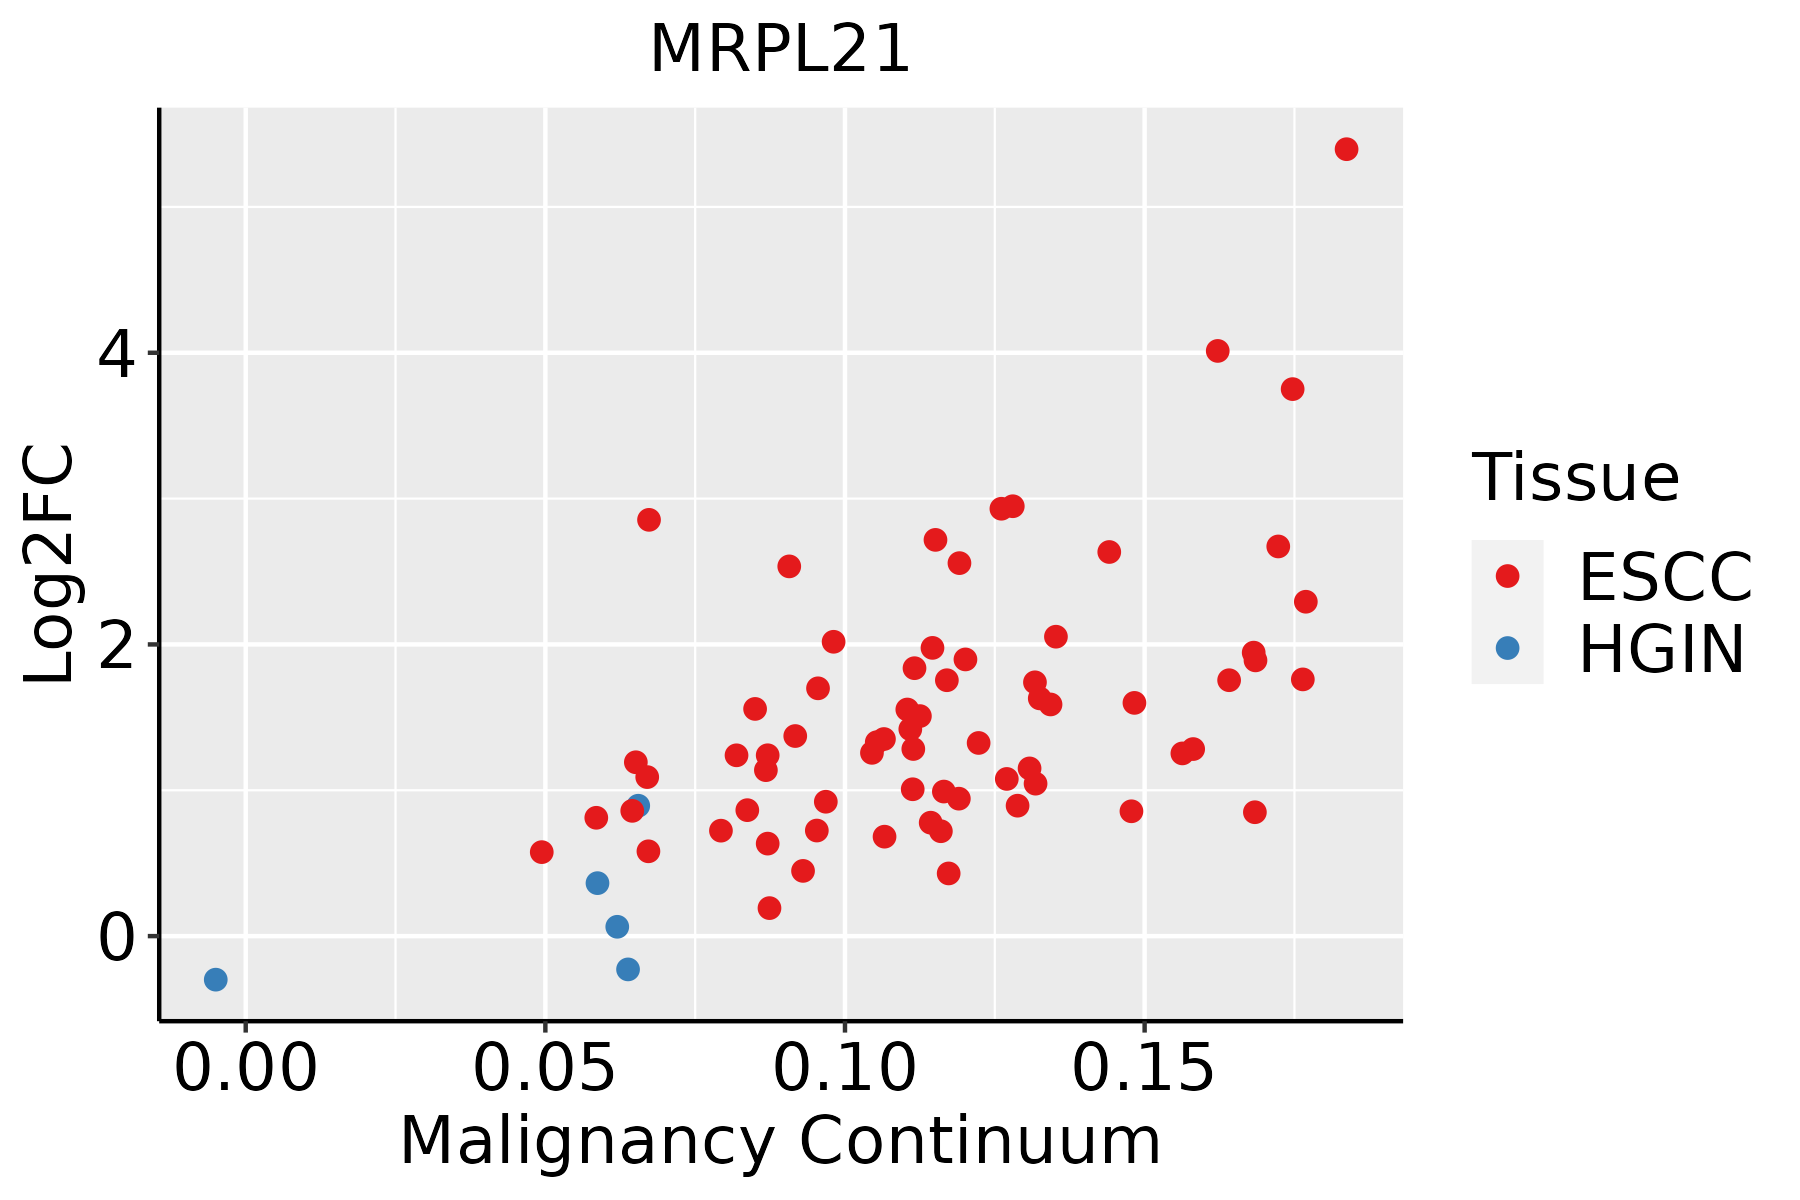 | ESCC: Esophageal squamous cell carcinoma |
| HGIN: High-grade intraepithelial neoplasias | ||
| LGIN: Low-grade intraepithelial neoplasias | ||
| Liver |  | HCC: Hepatocellular carcinoma |
| NAFLD: Non-alcoholic fatty liver disease | ||
| Oral Cavity |  | EOLP: Erosive Oral lichen planus |
| LP: leukoplakia | ||
| NEOLP: Non-erosive oral lichen planus | ||
| OSCC: Oral squamous cell carcinoma | ||
| Prostate | 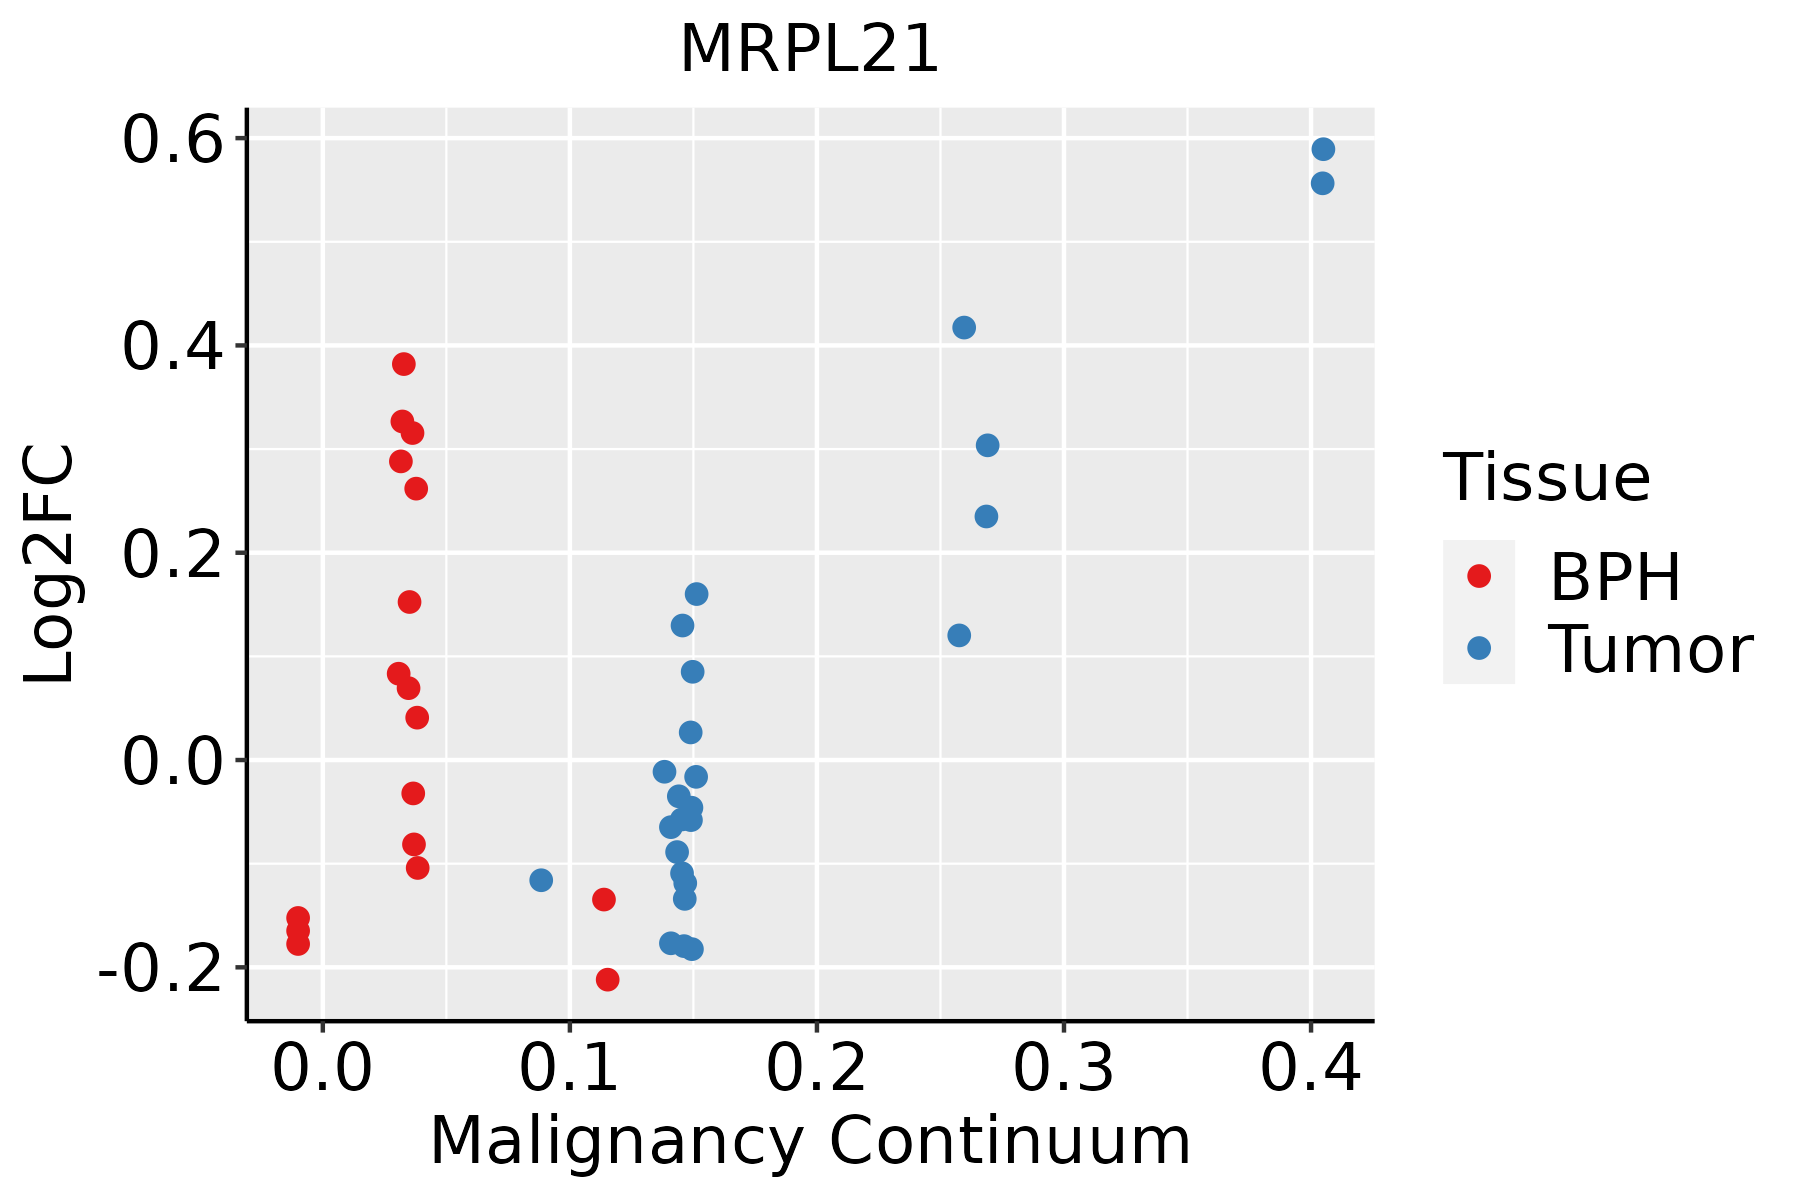 | BPH: Benign Prostatic Hyperplasia |
| Skin |  | AK: Actinic keratosis |
| cSCC: Cutaneous squamous cell carcinoma | ||
| SCCIS:squamous cell carcinoma in situ | ||
| Thyroid | 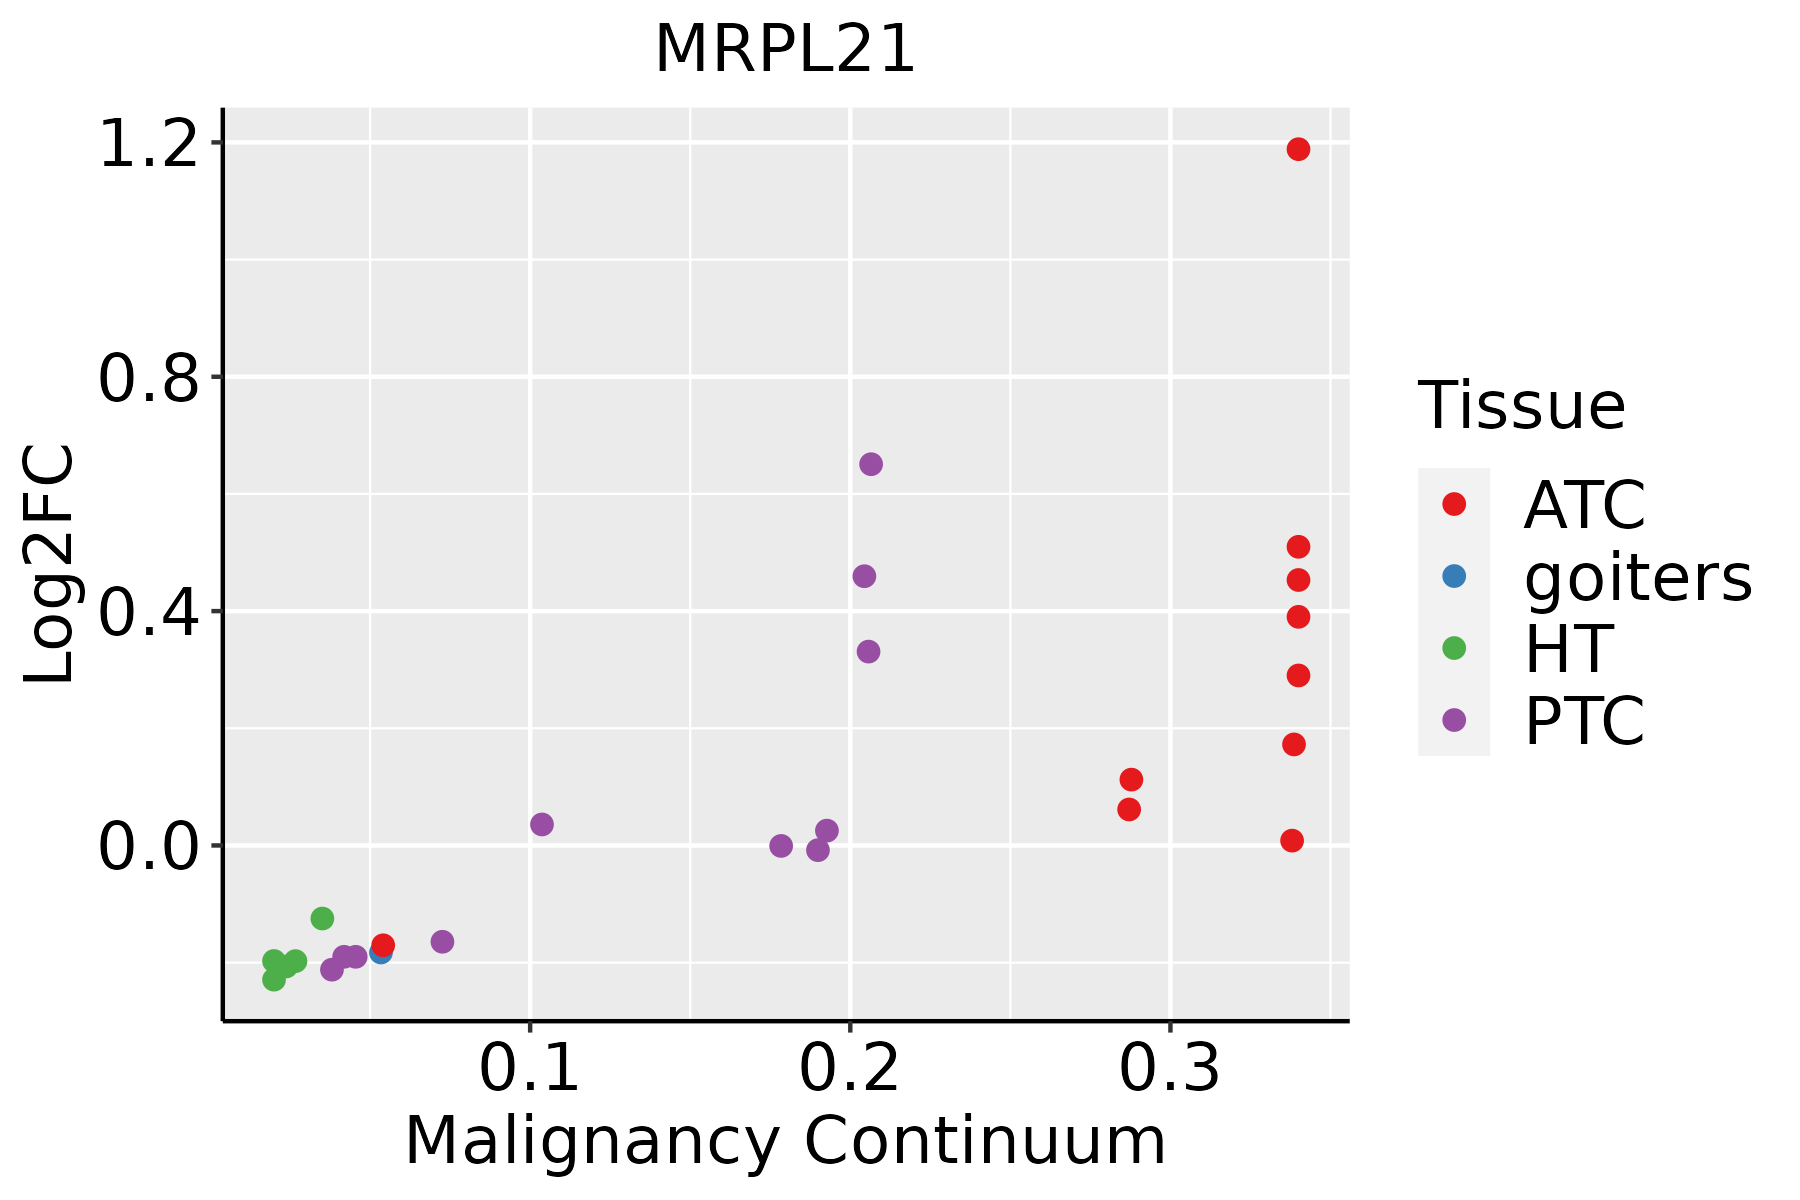 | ATC: Anaplastic thyroid cancer |
| HT: Hashimoto's thyroiditis | ||
| PTC: Papillary thyroid cancer |
| ∗log2FC in expression of this searched gene in stem-like cells from each diseased tissue sample relative to stem-like cells in normal samples in each tissue plotted against the malignancy continuum. Samples are colored based on if they are from different disease stage. |
Top |
Malignant transformation related pathway analysis |
| Find out the enriched GO biological processes and KEGG pathways involved in transition from healthy to precancer to cancer |
| Tissue | Disease Stage | Enriched GO biological Processes |
| Colorectum | AD |  |
| Colorectum | SER |  |
| Colorectum | MSS |  |
| Colorectum | MSI-H |  |
| Colorectum | FAP |  |
| ∗Top 15 enriched GO BP terms are showed in the bar plot of each disease state in each tissue. Each row represents a significant GO biological process which is colored according to the -log10(p.adjust). |
| Page: 1 2 3 4 5 6 7 8 9 |
| GO ID | Tissue | Disease Stage | Description | Gene Ratio | Bg Ratio | pvalue | p.adjust | Count |
| Page: 1 |
| Pathway ID | Tissue | Disease Stage | Description | Gene Ratio | Bg Ratio | pvalue | p.adjust | qvalue | Count |
| hsa03010211 | Esophagus | ESCC | Ribosome | 129/4205 | 167/8465 | 1.43e-13 | 3.43e-12 | 1.75e-12 | 129 |
| hsa03010310 | Esophagus | ESCC | Ribosome | 129/4205 | 167/8465 | 1.43e-13 | 3.43e-12 | 1.75e-12 | 129 |
| hsa0301022 | Liver | Cirrhotic | Ribosome | 127/2530 | 167/8465 | 2.12e-35 | 7.06e-33 | 4.35e-33 | 127 |
| hsa0301032 | Liver | Cirrhotic | Ribosome | 127/2530 | 167/8465 | 2.12e-35 | 7.06e-33 | 4.35e-33 | 127 |
| hsa0301042 | Liver | HCC | Ribosome | 128/4020 | 167/8465 | 7.32e-15 | 2.23e-13 | 1.24e-13 | 128 |
| hsa0301052 | Liver | HCC | Ribosome | 128/4020 | 167/8465 | 7.32e-15 | 2.23e-13 | 1.24e-13 | 128 |
| hsa0301030 | Oral cavity | OSCC | Ribosome | 128/3704 | 167/8465 | 2.42e-18 | 1.62e-16 | 8.25e-17 | 128 |
| hsa03010114 | Oral cavity | OSCC | Ribosome | 128/3704 | 167/8465 | 2.42e-18 | 1.62e-16 | 8.25e-17 | 128 |
| hsa03010210 | Oral cavity | LP | Ribosome | 127/2418 | 167/8465 | 1.22e-37 | 4.05e-35 | 2.61e-35 | 127 |
| hsa0301038 | Oral cavity | LP | Ribosome | 127/2418 | 167/8465 | 1.22e-37 | 4.05e-35 | 2.61e-35 | 127 |
| hsa0301028 | Prostate | BPH | Ribosome | 104/1718 | 167/8465 | 8.04e-33 | 1.33e-30 | 8.21e-31 | 104 |
| hsa03010113 | Prostate | BPH | Ribosome | 104/1718 | 167/8465 | 8.04e-33 | 1.33e-30 | 8.21e-31 | 104 |
| hsa0301029 | Prostate | Tumor | Ribosome | 104/1791 | 167/8465 | 3.53e-31 | 5.84e-29 | 3.62e-29 | 104 |
| hsa0301037 | Prostate | Tumor | Ribosome | 104/1791 | 167/8465 | 3.53e-31 | 5.84e-29 | 3.62e-29 | 104 |
| Page: 1 |
Top |
Cell-cell communication analysis |
| Identification of potential cell-cell interactions between two cell types and their ligand-receptor pairs for different disease states |
| Ligand | Receptor | LRpair | Pathway | Tissue | Disease Stage |
| Page: 1 |
Top |
Single-cell gene regulatory network inference analysis |
| Find out the significant the regulons (TFs) and the target genes of each regulon across cell types for different disease states |
| TF | Cell Type | Tissue | Disease Stage | Target Gene | RSS | Regulon Activity |
| ∗The dot plots of a searched regulon are shown for all cell subpopulations in each disease state of each tissue based on the regulon specific score inferred using pySCENIC and by calculating the average expression. |
| Page: 1 |
Top |
Somatic mutation of malignant transformation related genes |
| Annotation of somatic variants for genes involved in malignant transformation |
| Hugo Symbol | Variant Class | Variant Classification | dbSNP RS | HGVSc | HGVSp | HGVSp Short | SWISSPROT | BIOTYPE | SIFT | PolyPhen | Tumor Sample Barcode | Tissue | Histology | Sex | Age | Stage | Therapy Types | Drugs | Outcome |
| MRPL21 | SNV | Missense_Mutation | rs148367955 | c.191N>A | p.Val64Asp | p.V64D | Q7Z2W9 | protein_coding | deleterious(0) | benign(0.028) | TCGA-A7-A3J1-01 | Breast | breast invasive carcinoma | Female | <65 | I/II | Hormone Therapy | anastrazole | SD |
| MRPL21 | SNV | Missense_Mutation | c.258N>A | p.Met86Ile | p.M86I | Q7Z2W9 | protein_coding | tolerated(0.1) | benign(0.003) | TCGA-GM-A2D9-01 | Breast | breast invasive carcinoma | Female | >=65 | I/II | Hormone Therapy | arimidex | SD | |
| MRPL21 | insertion | Frame_Shift_Ins | novel | c.239_240insCACCCAG | p.Lys81ThrfsTer7 | p.K81Tfs*7 | Q7Z2W9 | protein_coding | TCGA-A8-A06X-01 | Breast | breast invasive carcinoma | Female | >=65 | I/II | Unknown | Unknown | SD | ||
| MRPL21 | insertion | Frame_Shift_Ins | novel | c.238_239insCTCTG | p.Val80AlafsTer3 | p.V80Afs*3 | Q7Z2W9 | protein_coding | TCGA-A8-A06X-01 | Breast | breast invasive carcinoma | Female | >=65 | I/II | Unknown | Unknown | SD | ||
| MRPL21 | SNV | Missense_Mutation | rs143584803 | c.386G>A | p.Arg129Gln | p.R129Q | Q7Z2W9 | protein_coding | tolerated(0.11) | probably_damaging(0.939) | TCGA-C5-A1MJ-01 | Cervix | cervical & endocervical cancer | Female | <65 | I/II | Unknown | Unknown | SD |
| MRPL21 | SNV | Missense_Mutation | rs757166826 | c.425N>T | p.Thr142Met | p.T142M | Q7Z2W9 | protein_coding | deleterious(0) | probably_damaging(0.998) | TCGA-AA-3956-01 | Colorectum | colon adenocarcinoma | Male | >=65 | I/II | Unknown | Unknown | SD |
| MRPL21 | SNV | Missense_Mutation | novel | c.496N>C | p.Ser166Pro | p.S166P | Q7Z2W9 | protein_coding | deleterious(0) | probably_damaging(0.996) | TCGA-A5-A0G2-01 | Endometrium | uterine corpus endometrioid carcinoma | Female | <65 | III/IV | Unknown | Unknown | SD |
| MRPL21 | SNV | Missense_Mutation | novel | c.378N>C | p.Glu126Asp | p.E126D | Q7Z2W9 | protein_coding | tolerated(1) | benign(0.007) | TCGA-AJ-A23O-01 | Endometrium | uterine corpus endometrioid carcinoma | Female | >=65 | I/II | Unknown | Unknown | SD |
| MRPL21 | SNV | Missense_Mutation | novel | c.107C>T | p.Ser36Phe | p.S36F | Q7Z2W9 | protein_coding | deleterious(0.04) | benign(0.1) | TCGA-AX-A06F-01 | Endometrium | uterine corpus endometrioid carcinoma | Female | <65 | III/IV | Chemotherapy | carboplatin | SD |
| MRPL21 | SNV | Missense_Mutation | novel | c.160N>G | p.Thr54Ala | p.T54A | Q7Z2W9 | protein_coding | tolerated(0.08) | probably_damaging(0.997) | TCGA-EO-A22X-01 | Endometrium | uterine corpus endometrioid carcinoma | Female | <65 | III/IV | Unspecific | Carboplatin | Complete Response |
| Page: 1 2 |
Top |
Related drugs of malignant transformation related genes |
| Identification of chemicals and drugs interact with genes involved in malignant transfromation |
| (DGIdb 4.0) |
| Entrez ID | Symbol | Category | Interaction Types | Drug Claim Name | Drug Name | PMIDs |
| Page: 1 |

Copyright 2023-Present -The University of Texas Health Science Center at Houston |