
|
|||||
|
 | |
| |
| |
| |
| |
| |
|
Gene: MRPL20 |
Gene summary for MRPL20 |
| Gene information | Species | Human | Gene symbol | MRPL20 | Gene ID | 55052 |
| Gene name | mitochondrial ribosomal protein L20 | |
| Gene Alias | L20mt | |
| Cytomap | 1p36.33 | |
| Gene Type | protein-coding | GO ID | GO:0000027 | UniProtAcc | Q9BYC9 |
Top |
Malignant transformation analysis |
| Identification of the aberrant gene expression in precancerous and cancerous lesions by comparing the gene expression of stem-like cells in diseased tissues with normal stem cells |
| Entrez ID | Symbol | Replicates | Species | Organ | Tissue | Adj P-value | Log2FC | Malignancy |
| 55052 | MRPL20 | GSM4909281 | Human | Breast | IDC | 1.53e-07 | 3.63e-01 | 0.21 |
| 55052 | MRPL20 | GSM4909285 | Human | Breast | IDC | 1.72e-12 | 3.71e-01 | 0.21 |
| 55052 | MRPL20 | GSM4909286 | Human | Breast | IDC | 1.92e-06 | -5.10e-02 | 0.1081 |
| 55052 | MRPL20 | GSM4909288 | Human | Breast | IDC | 4.83e-14 | 5.68e-01 | 0.0988 |
| 55052 | MRPL20 | GSM4909290 | Human | Breast | IDC | 5.68e-09 | 4.11e-01 | 0.2096 |
| 55052 | MRPL20 | GSM4909293 | Human | Breast | IDC | 3.88e-13 | 4.34e-01 | 0.1581 |
| 55052 | MRPL20 | GSM4909294 | Human | Breast | IDC | 1.60e-14 | 4.21e-01 | 0.2022 |
| 55052 | MRPL20 | GSM4909296 | Human | Breast | IDC | 1.56e-09 | 2.22e-01 | 0.1524 |
| 55052 | MRPL20 | GSM4909297 | Human | Breast | IDC | 3.53e-07 | 3.06e-03 | 0.1517 |
| 55052 | MRPL20 | GSM4909301 | Human | Breast | IDC | 2.27e-14 | 5.05e-01 | 0.1577 |
| 55052 | MRPL20 | GSM4909302 | Human | Breast | IDC | 4.26e-05 | 2.54e-01 | 0.1545 |
| 55052 | MRPL20 | GSM4909304 | Human | Breast | IDC | 7.97e-06 | 3.62e-01 | 0.1636 |
| 55052 | MRPL20 | GSM4909305 | Human | Breast | IDC | 8.47e-03 | 2.77e-01 | 0.0436 |
| 55052 | MRPL20 | GSM4909306 | Human | Breast | IDC | 9.90e-21 | 4.98e-01 | 0.1564 |
| 55052 | MRPL20 | GSM4909308 | Human | Breast | IDC | 6.54e-06 | 2.70e-01 | 0.158 |
| 55052 | MRPL20 | GSM4909311 | Human | Breast | IDC | 6.60e-25 | -3.05e-01 | 0.1534 |
| 55052 | MRPL20 | GSM4909312 | Human | Breast | IDC | 1.70e-06 | -1.64e-01 | 0.1552 |
| 55052 | MRPL20 | GSM4909315 | Human | Breast | IDC | 1.59e-02 | 3.00e-01 | 0.21 |
| 55052 | MRPL20 | GSM4909316 | Human | Breast | IDC | 6.49e-06 | 2.95e-01 | 0.21 |
| 55052 | MRPL20 | GSM4909317 | Human | Breast | IDC | 2.68e-08 | 3.65e-01 | 0.1355 |
| Page: 1 2 3 4 5 6 7 8 9 10 11 |
| Tissue | Expression Dynamics | Abbreviation |
| Breast | 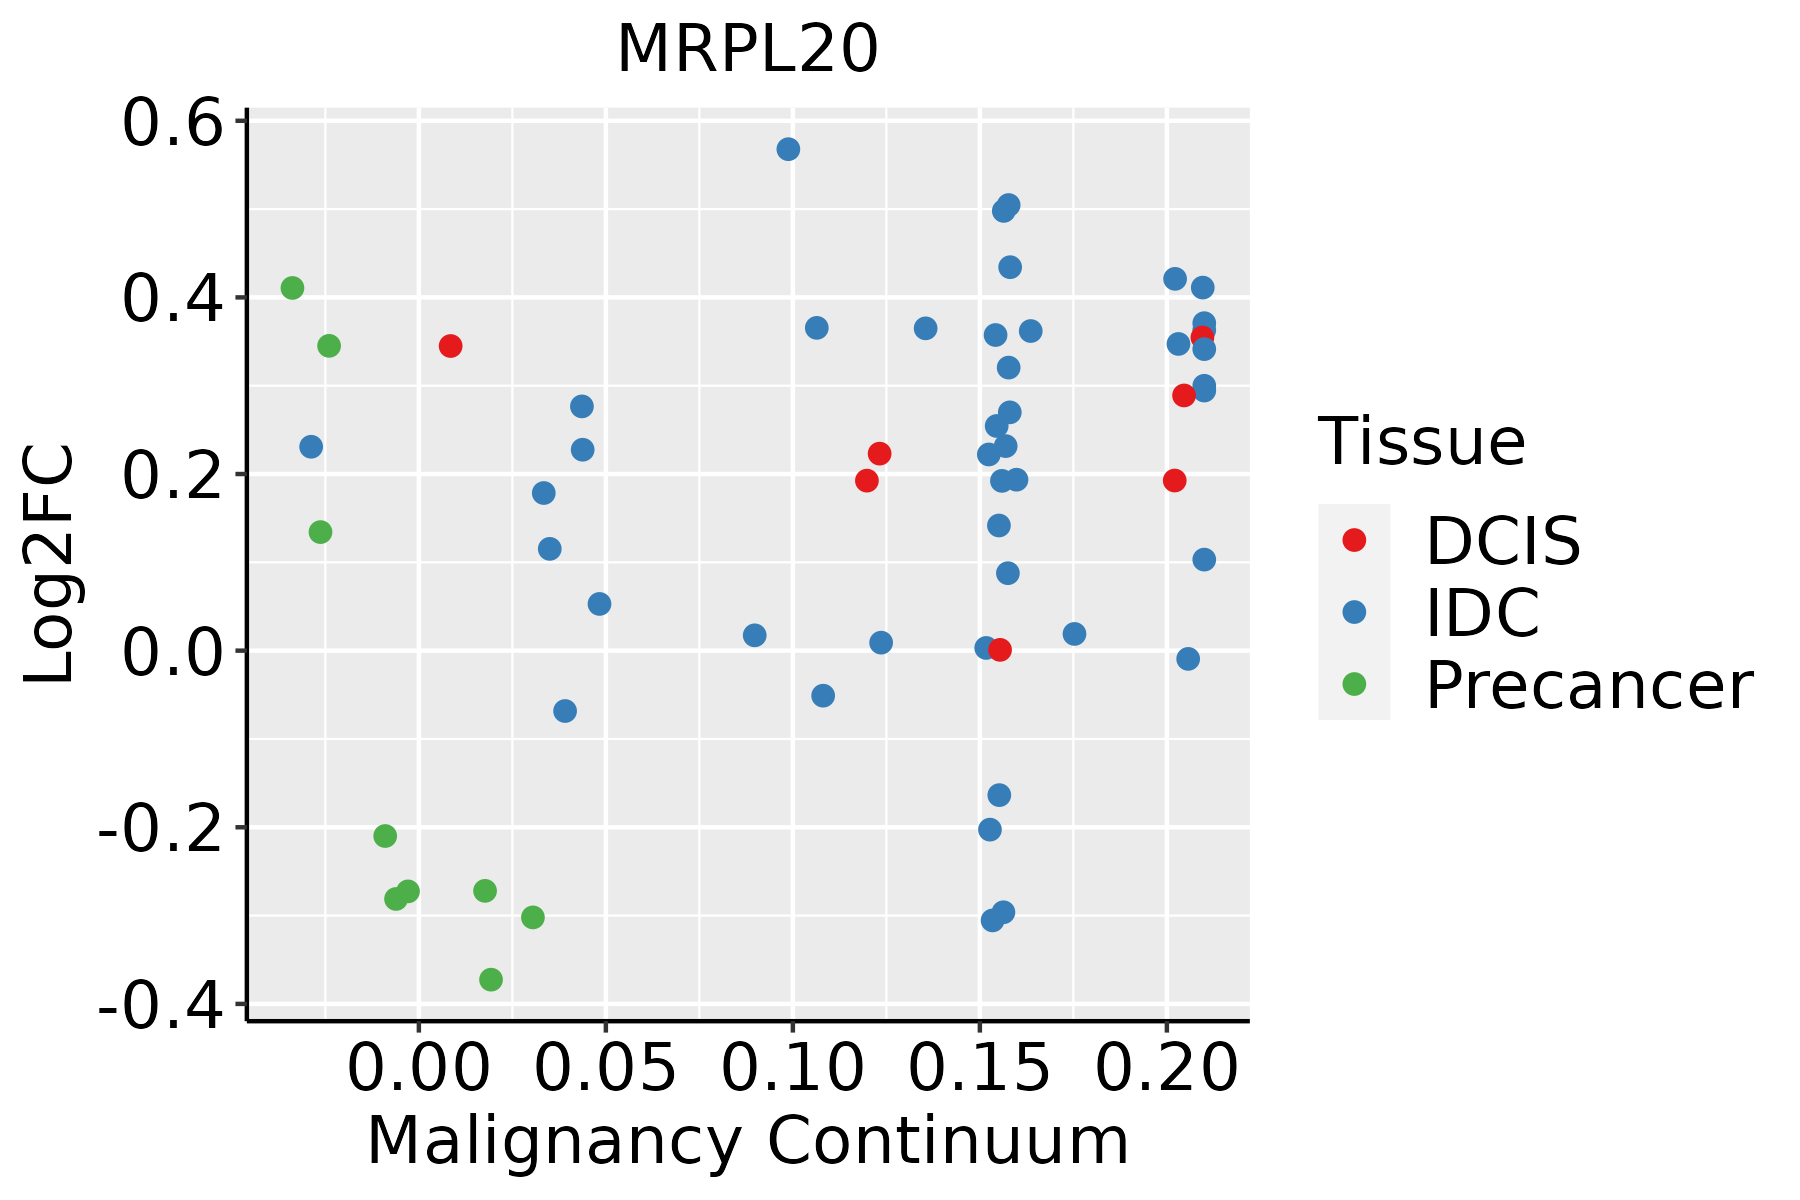 | IDC: Invasive ductal carcinoma |
| DCIS: Ductal carcinoma in situ | ||
| Precancer(BRCA1-mut): Precancerous lesion from BRCA1 mutation carriers | ||
| Cervix | 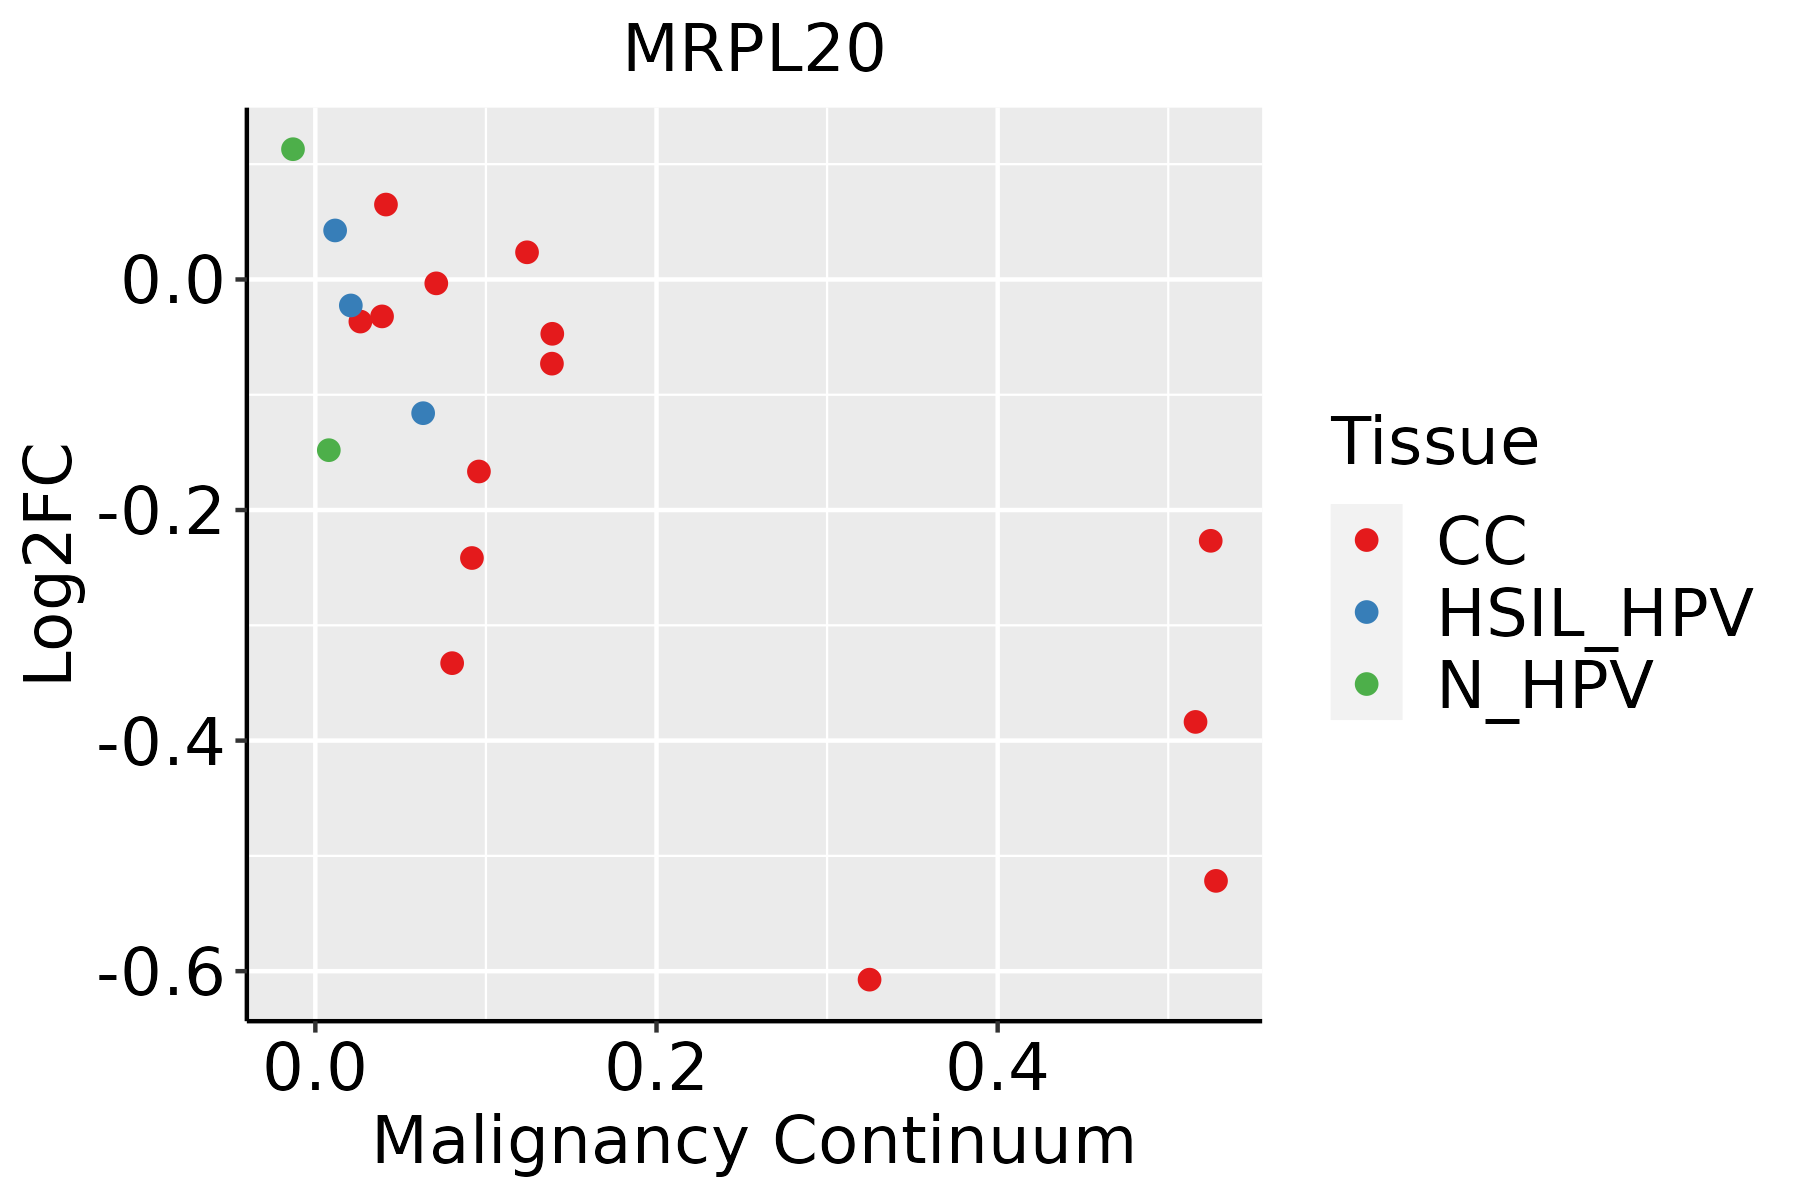 | CC: Cervix cancer |
| HSIL_HPV: HPV-infected high-grade squamous intraepithelial lesions | ||
| N_HPV: HPV-infected normal cervix | ||
| Endometrium |  | AEH: Atypical endometrial hyperplasia |
| EEC: Endometrioid Cancer | ||
| Esophagus | 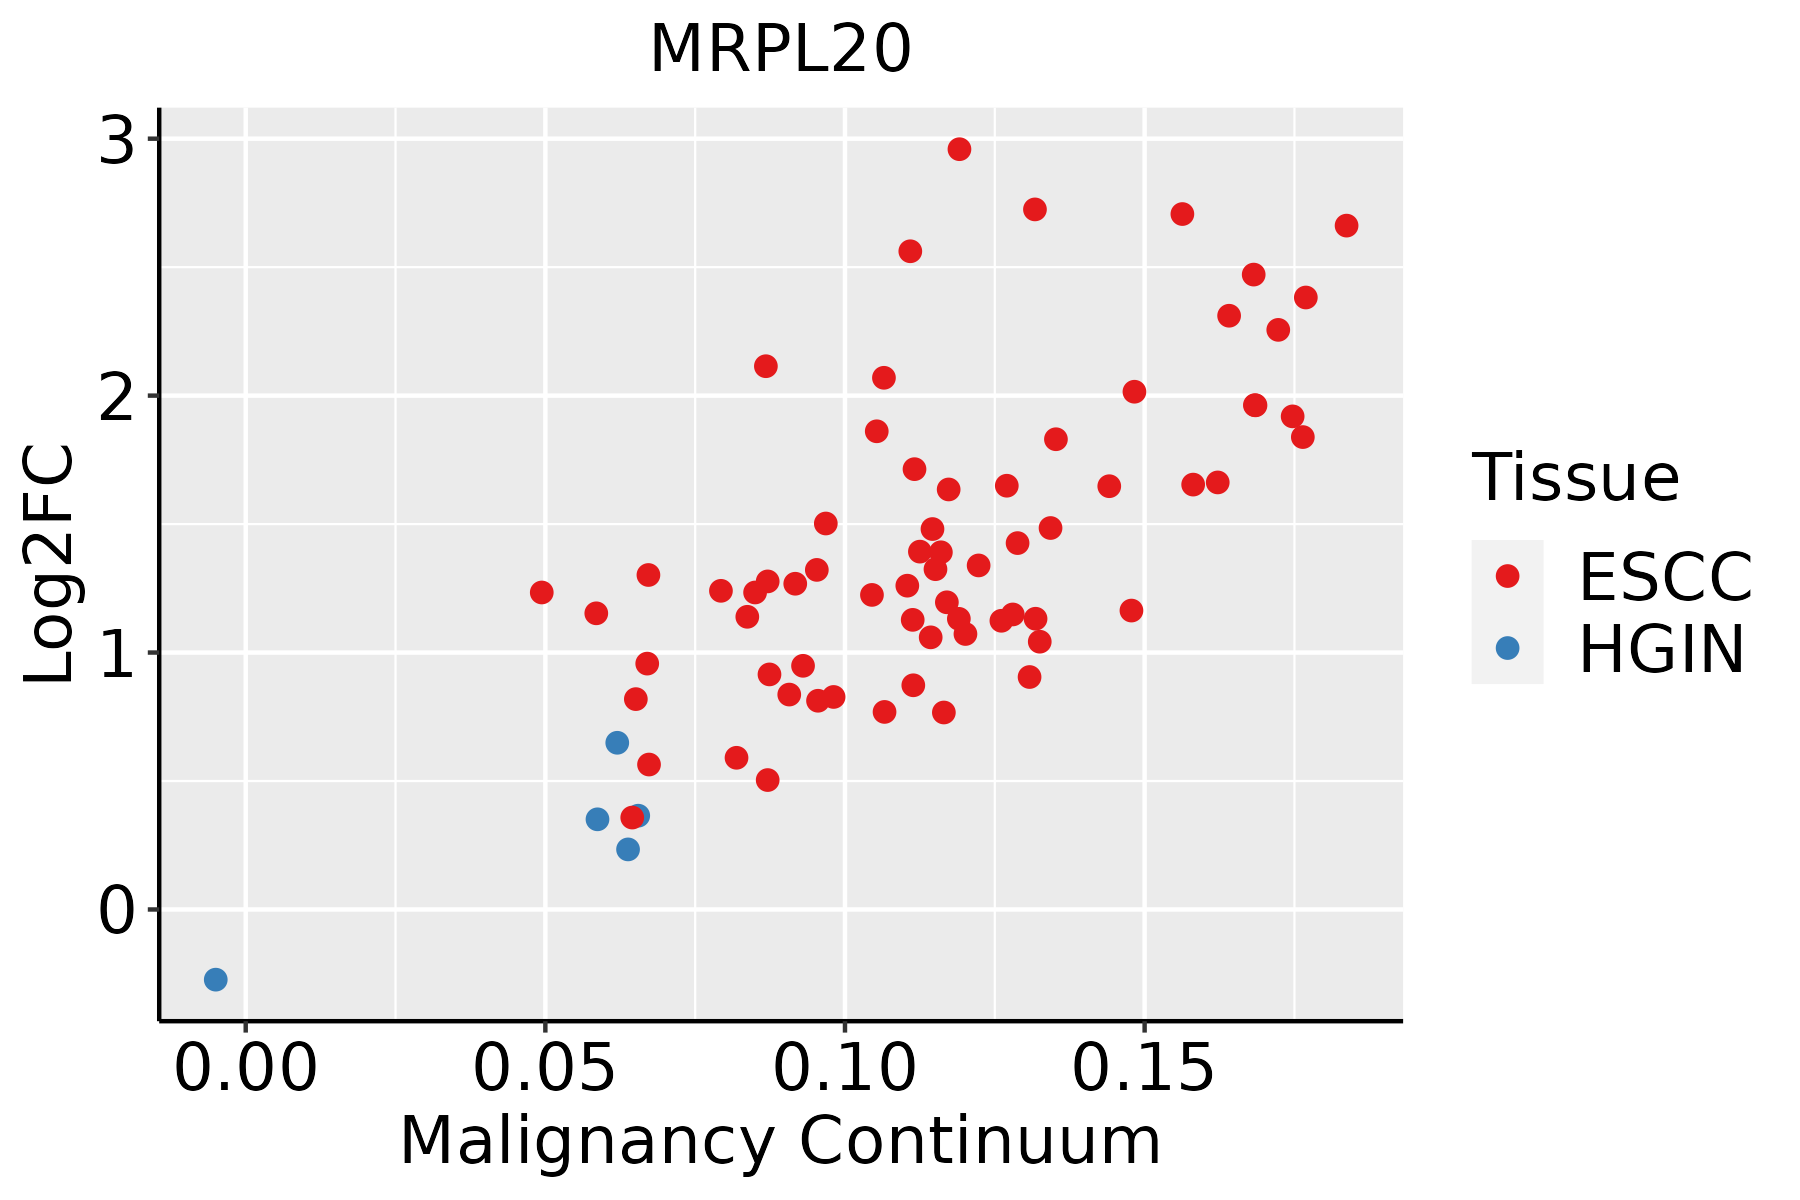 | ESCC: Esophageal squamous cell carcinoma |
| HGIN: High-grade intraepithelial neoplasias | ||
| LGIN: Low-grade intraepithelial neoplasias | ||
| Liver | 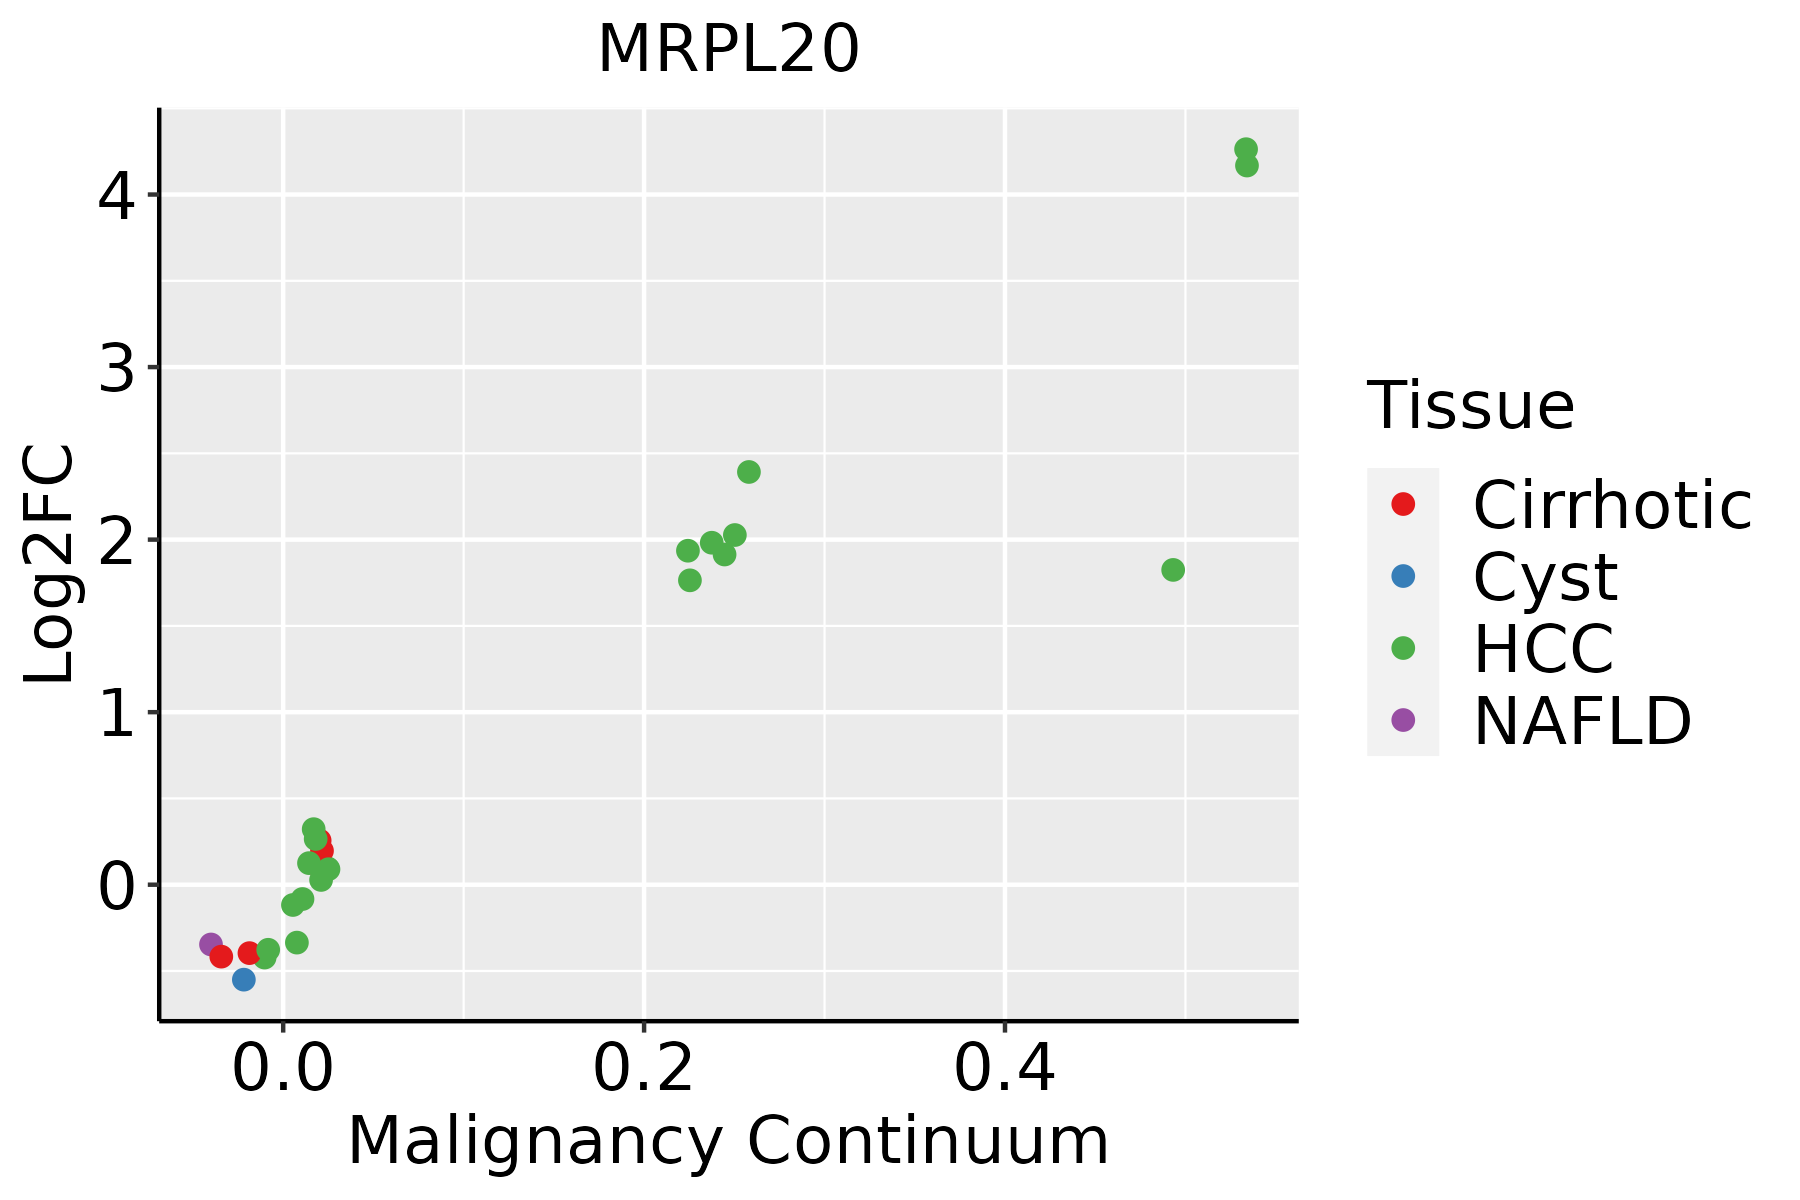 | HCC: Hepatocellular carcinoma |
| NAFLD: Non-alcoholic fatty liver disease | ||
| Oral Cavity |  | EOLP: Erosive Oral lichen planus |
| LP: leukoplakia | ||
| NEOLP: Non-erosive oral lichen planus | ||
| OSCC: Oral squamous cell carcinoma | ||
| Prostate | 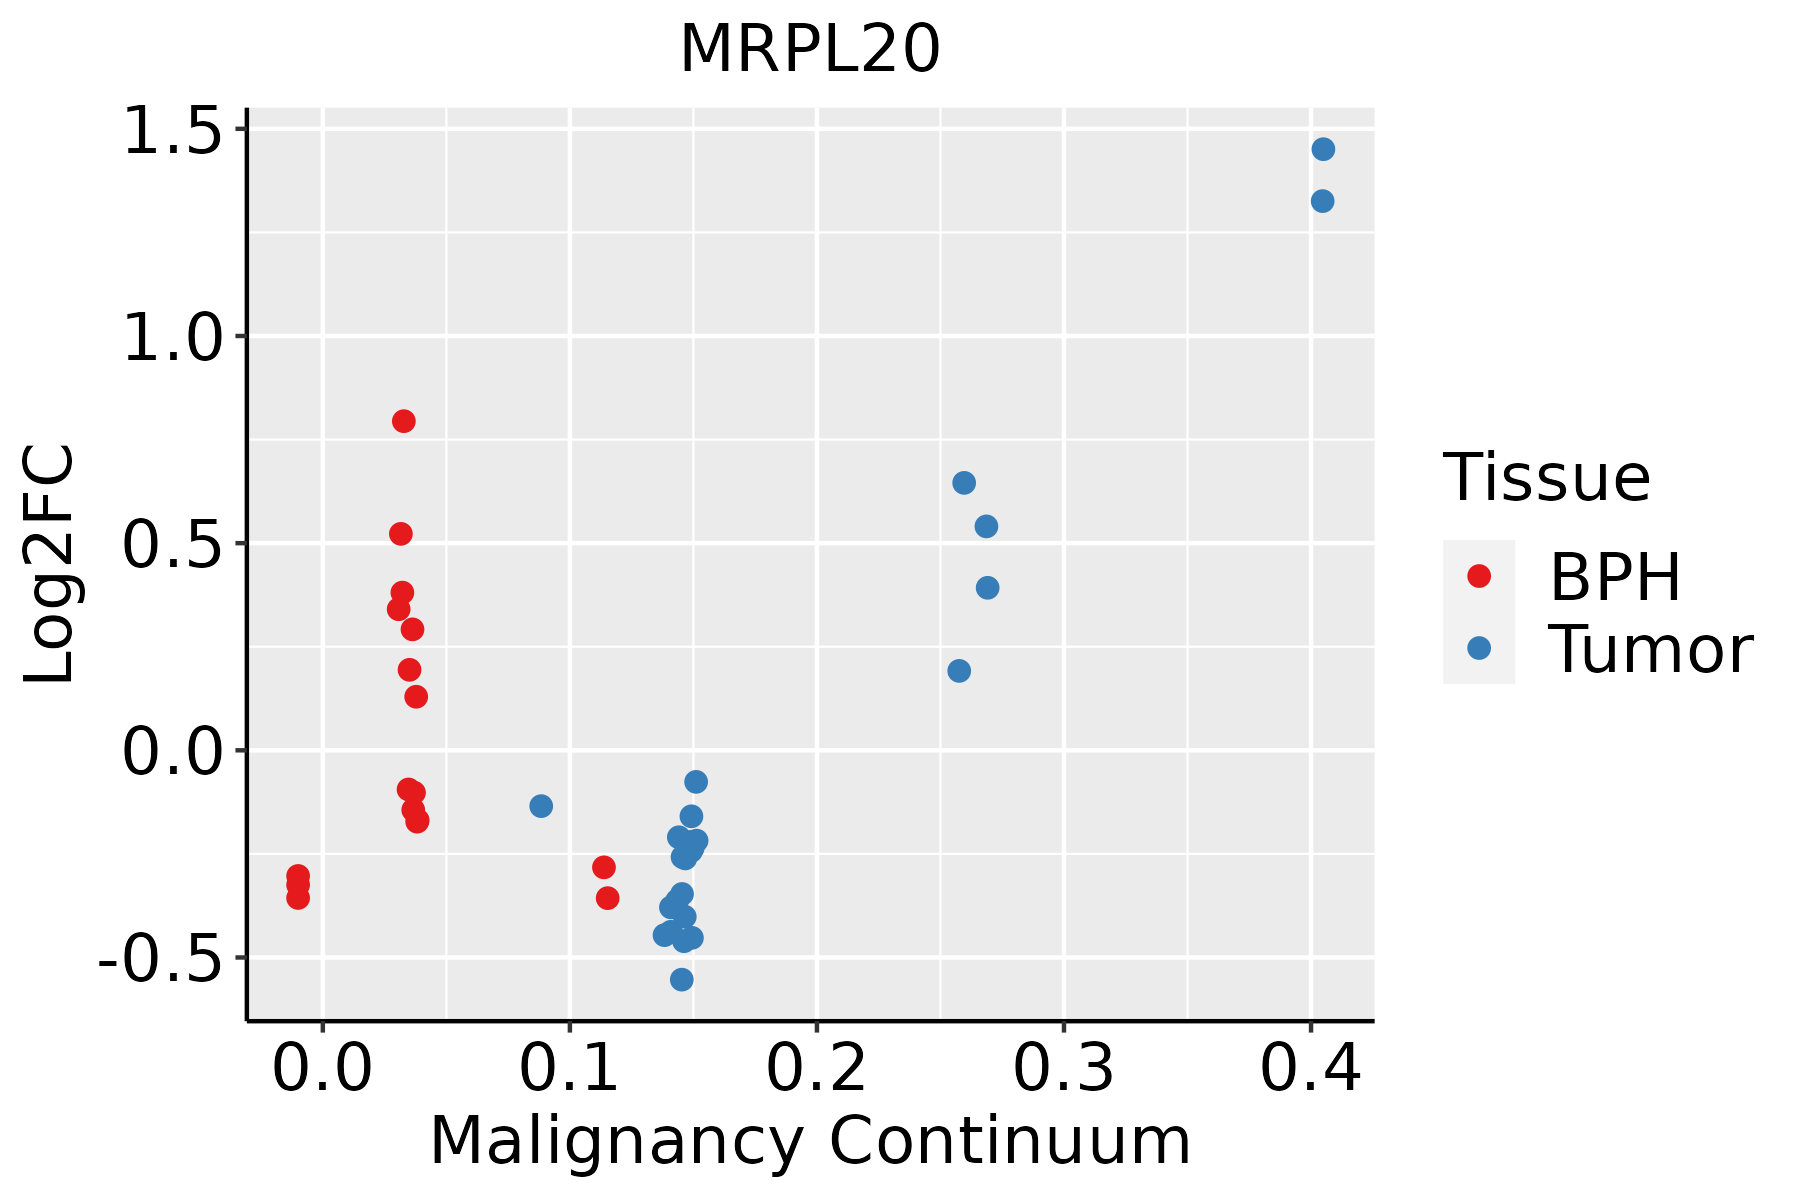 | BPH: Benign Prostatic Hyperplasia |
| Skin |  | AK: Actinic keratosis |
| cSCC: Cutaneous squamous cell carcinoma | ||
| SCCIS:squamous cell carcinoma in situ | ||
| Thyroid |  | ATC: Anaplastic thyroid cancer |
| HT: Hashimoto's thyroiditis | ||
| PTC: Papillary thyroid cancer |
| ∗log2FC in expression of this searched gene in stem-like cells from each diseased tissue sample relative to stem-like cells in normal samples in each tissue plotted against the malignancy continuum. Samples are colored based on if they are from different disease stage. |
Top |
Malignant transformation related pathway analysis |
| Find out the enriched GO biological processes and KEGG pathways involved in transition from healthy to precancer to cancer |
| Tissue | Disease Stage | Enriched GO biological Processes |
| Colorectum | AD |  |
| Colorectum | SER |  |
| Colorectum | MSS |  |
| Colorectum | MSI-H |  |
| Colorectum | FAP |  |
| ∗Top 15 enriched GO BP terms are showed in the bar plot of each disease state in each tissue. Each row represents a significant GO biological process which is colored according to the -log10(p.adjust). |
| Page: 1 2 3 4 5 6 7 8 9 |
| GO ID | Tissue | Disease Stage | Description | Gene Ratio | Bg Ratio | pvalue | p.adjust | Count |
| GO:00226139 | Breast | Precancer | ribonucleoprotein complex biogenesis | 79/1080 | 463/18723 | 2.11e-18 | 1.03e-15 | 79 |
| GO:00718269 | Breast | Precancer | ribonucleoprotein complex subunit organization | 48/1080 | 227/18723 | 2.68e-15 | 8.45e-13 | 48 |
| GO:00226189 | Breast | Precancer | ribonucleoprotein complex assembly | 47/1080 | 220/18723 | 3.47e-15 | 1.03e-12 | 47 |
| GO:00422549 | Breast | Precancer | ribosome biogenesis | 52/1080 | 299/18723 | 7.35e-13 | 1.51e-10 | 52 |
| GO:00422559 | Breast | Precancer | ribosome assembly | 21/1080 | 61/18723 | 1.06e-11 | 1.53e-09 | 21 |
| GO:00422739 | Breast | Precancer | ribosomal large subunit biogenesis | 22/1080 | 72/18723 | 5.03e-11 | 5.61e-09 | 22 |
| GO:00000279 | Breast | Precancer | ribosomal large subunit assembly | 9/1080 | 27/18723 | 1.24e-05 | 3.19e-04 | 9 |
| GO:002261314 | Breast | IDC | ribonucleoprotein complex biogenesis | 83/1434 | 463/18723 | 2.01e-13 | 5.20e-11 | 83 |
| GO:007182614 | Breast | IDC | ribonucleoprotein complex subunit organization | 52/1434 | 227/18723 | 5.18e-13 | 1.21e-10 | 52 |
| GO:002261814 | Breast | IDC | ribonucleoprotein complex assembly | 51/1434 | 220/18723 | 5.32e-13 | 1.21e-10 | 51 |
| GO:004225514 | Breast | IDC | ribosome assembly | 21/1434 | 61/18723 | 1.98e-09 | 1.76e-07 | 21 |
| GO:004227314 | Breast | IDC | ribosomal large subunit biogenesis | 22/1434 | 72/18723 | 1.04e-08 | 7.67e-07 | 22 |
| GO:004225414 | Breast | IDC | ribosome biogenesis | 52/1434 | 299/18723 | 1.90e-08 | 1.32e-06 | 52 |
| GO:000002714 | Breast | IDC | ribosomal large subunit assembly | 9/1434 | 27/18723 | 1.17e-04 | 2.17e-03 | 9 |
| GO:002261324 | Breast | DCIS | ribonucleoprotein complex biogenesis | 83/1390 | 463/18723 | 3.65e-14 | 1.09e-11 | 83 |
| GO:007182624 | Breast | DCIS | ribonucleoprotein complex subunit organization | 52/1390 | 227/18723 | 1.54e-13 | 3.95e-11 | 52 |
| GO:002261824 | Breast | DCIS | ribonucleoprotein complex assembly | 51/1390 | 220/18723 | 1.60e-13 | 3.95e-11 | 51 |
| GO:004225524 | Breast | DCIS | ribosome assembly | 21/1390 | 61/18723 | 1.13e-09 | 1.14e-07 | 21 |
| GO:004227324 | Breast | DCIS | ribosomal large subunit biogenesis | 22/1390 | 72/18723 | 5.88e-09 | 4.82e-07 | 22 |
| GO:004225423 | Breast | DCIS | ribosome biogenesis | 52/1390 | 299/18723 | 6.73e-09 | 5.44e-07 | 52 |
| Page: 1 2 3 4 5 6 7 |
| Pathway ID | Tissue | Disease Stage | Description | Gene Ratio | Bg Ratio | pvalue | p.adjust | qvalue | Count |
| hsa0301018 | Breast | Precancer | Ribosome | 80/684 | 167/8465 | 7.33e-44 | 2.32e-41 | 1.77e-41 | 80 |
| hsa0301019 | Breast | Precancer | Ribosome | 80/684 | 167/8465 | 7.33e-44 | 2.32e-41 | 1.77e-41 | 80 |
| hsa0301024 | Breast | IDC | Ribosome | 83/867 | 167/8465 | 6.07e-39 | 9.87e-37 | 7.38e-37 | 83 |
| hsa0301034 | Breast | IDC | Ribosome | 83/867 | 167/8465 | 6.07e-39 | 9.87e-37 | 7.38e-37 | 83 |
| hsa0301020 | Cervix | CC | Ribosome | 85/1267 | 167/8465 | 3.17e-28 | 5.14e-26 | 3.04e-26 | 85 |
| hsa03010110 | Cervix | CC | Ribosome | 85/1267 | 167/8465 | 3.17e-28 | 5.14e-26 | 3.04e-26 | 85 |
| hsa0301026 | Endometrium | AEH | Ribosome | 89/1197 | 167/8465 | 1.88e-33 | 6.09e-31 | 4.46e-31 | 89 |
| hsa03010112 | Endometrium | AEH | Ribosome | 89/1197 | 167/8465 | 1.88e-33 | 6.09e-31 | 4.46e-31 | 89 |
| hsa0301027 | Endometrium | EEC | Ribosome | 89/1237 | 167/8465 | 2.55e-32 | 8.39e-30 | 6.26e-30 | 89 |
| hsa0301036 | Endometrium | EEC | Ribosome | 89/1237 | 167/8465 | 2.55e-32 | 8.39e-30 | 6.26e-30 | 89 |
| hsa0301039 | Esophagus | HGIN | Ribosome | 108/1383 | 167/8465 | 1.44e-45 | 4.71e-43 | 3.74e-43 | 108 |
| hsa03010115 | Esophagus | HGIN | Ribosome | 108/1383 | 167/8465 | 1.44e-45 | 4.71e-43 | 3.74e-43 | 108 |
| hsa03010211 | Esophagus | ESCC | Ribosome | 129/4205 | 167/8465 | 1.43e-13 | 3.43e-12 | 1.75e-12 | 129 |
| hsa03010310 | Esophagus | ESCC | Ribosome | 129/4205 | 167/8465 | 1.43e-13 | 3.43e-12 | 1.75e-12 | 129 |
| hsa0301022 | Liver | Cirrhotic | Ribosome | 127/2530 | 167/8465 | 2.12e-35 | 7.06e-33 | 4.35e-33 | 127 |
| hsa0301032 | Liver | Cirrhotic | Ribosome | 127/2530 | 167/8465 | 2.12e-35 | 7.06e-33 | 4.35e-33 | 127 |
| hsa0301042 | Liver | HCC | Ribosome | 128/4020 | 167/8465 | 7.32e-15 | 2.23e-13 | 1.24e-13 | 128 |
| hsa0301052 | Liver | HCC | Ribosome | 128/4020 | 167/8465 | 7.32e-15 | 2.23e-13 | 1.24e-13 | 128 |
| hsa0301062 | Liver | Cyst | Ribosome | 70/339 | 167/8465 | 5.37e-55 | 1.55e-52 | 1.28e-52 | 70 |
| hsa0301072 | Liver | Cyst | Ribosome | 70/339 | 167/8465 | 5.37e-55 | 1.55e-52 | 1.28e-52 | 70 |
| Page: 1 2 |
Top |
Cell-cell communication analysis |
| Identification of potential cell-cell interactions between two cell types and their ligand-receptor pairs for different disease states |
| Ligand | Receptor | LRpair | Pathway | Tissue | Disease Stage |
| Page: 1 |
Top |
Single-cell gene regulatory network inference analysis |
| Find out the significant the regulons (TFs) and the target genes of each regulon across cell types for different disease states |
| TF | Cell Type | Tissue | Disease Stage | Target Gene | RSS | Regulon Activity |
| ∗The dot plots of a searched regulon are shown for all cell subpopulations in each disease state of each tissue based on the regulon specific score inferred using pySCENIC and by calculating the average expression. |
| Page: 1 |
Top |
Somatic mutation of malignant transformation related genes |
| Annotation of somatic variants for genes involved in malignant transformation |
| Hugo Symbol | Variant Class | Variant Classification | dbSNP RS | HGVSc | HGVSp | HGVSp Short | SWISSPROT | BIOTYPE | SIFT | PolyPhen | Tumor Sample Barcode | Tissue | Histology | Sex | Age | Stage | Therapy Types | Drugs | Outcome |
| MRPL20 | SNV | Missense_Mutation | c.328C>T | p.Pro110Ser | p.P110S | Q9BYC9 | protein_coding | deleterious(0) | probably_damaging(0.98) | TCGA-AR-A1AH-01 | Breast | breast invasive carcinoma | Female | <65 | I/II | Unspecific | PD | ||
| MRPL20 | SNV | Missense_Mutation | c.339N>G | p.Phe113Leu | p.F113L | Q9BYC9 | protein_coding | deleterious(0) | possibly_damaging(0.895) | TCGA-BH-A0W4-01 | Breast | breast invasive carcinoma | Female | <65 | I/II | Unknown | Unknown | SD | |
| MRPL20 | SNV | Missense_Mutation | c.417N>C | p.Glu139Asp | p.E139D | Q9BYC9 | protein_coding | tolerated(0.19) | benign(0) | TCGA-BH-A1FU-01 | Breast | breast invasive carcinoma | Female | <65 | I/II | Unknown | Unknown | PD | |
| MRPL20 | insertion | Frame_Shift_Ins | novel | c.233_234insCTTTA | p.Glu78AspfsTer6 | p.E78Dfs*6 | Q9BYC9 | protein_coding | TCGA-A8-A06X-01 | Breast | breast invasive carcinoma | Female | >=65 | I/II | Unknown | Unknown | SD | ||
| MRPL20 | insertion | Nonsense_Mutation | novel | c.231_232insACTCTGTCTCAAAAAAAAAAAAAAGTGTAGAAAAACTT | p.Glu78ThrfsTer10 | p.E78Tfs*10 | Q9BYC9 | protein_coding | TCGA-A8-A06X-01 | Breast | breast invasive carcinoma | Female | >=65 | I/II | Unknown | Unknown | SD | ||
| MRPL20 | SNV | Missense_Mutation | novel | c.260N>G | p.Ile87Ser | p.I87S | Q9BYC9 | protein_coding | tolerated(0.12) | benign(0.081) | TCGA-AA-3831-01 | Colorectum | colon adenocarcinoma | Male | >=65 | I/II | Unknown | Unknown | SD |
| MRPL20 | SNV | Missense_Mutation | rs145728085 | c.212N>A | p.Arg71Gln | p.R71Q | Q9BYC9 | protein_coding | deleterious(0) | probably_damaging(0.999) | TCGA-AA-3984-01 | Colorectum | colon adenocarcinoma | Female | <65 | I/II | Unknown | Unknown | SD |
| MRPL20 | SNV | Missense_Mutation | c.180G>T | p.Lys60Asn | p.K60N | Q9BYC9 | protein_coding | deleterious(0) | probably_damaging(0.999) | TCGA-AP-A1E0-01 | Endometrium | uterine corpus endometrioid carcinoma | Female | <65 | III/IV | Chemotherapy | paclitaxel | SD | |
| MRPL20 | SNV | Missense_Mutation | c.442N>C | p.Tyr148His | p.Y148H | Q9BYC9 | protein_coding | tolerated_low_confidence(0.58) | benign(0) | TCGA-AX-A2HJ-01 | Endometrium | uterine corpus endometrioid carcinoma | Female | <65 | I/II | Unknown | Unknown | SD | |
| MRPL20 | SNV | Missense_Mutation | c.276N>T | p.Lys92Asn | p.K92N | Q9BYC9 | protein_coding | deleterious(0) | possibly_damaging(0.767) | TCGA-D1-A174-01 | Endometrium | uterine corpus endometrioid carcinoma | Female | <65 | I/II | Unknown | Unknown | SD |
| Page: 1 2 |
Top |
Related drugs of malignant transformation related genes |
| Identification of chemicals and drugs interact with genes involved in malignant transfromation |
| (DGIdb 4.0) |
| Entrez ID | Symbol | Category | Interaction Types | Drug Claim Name | Drug Name | PMIDs |
| Page: 1 |

Copyright 2023-Present -The University of Texas Health Science Center at Houston |